2. a. The readability of the table could be improved by: removing unnecessary grid lines,
left-aligning the first column because it contains text entries, right aligning all other
columns because they contain numerical values, reducing the number of digits
displayed by displaying numerical values in millions or billions of dollars and using
shading to differentiate the columns. Note that we could also sort these values by
GDP in 2010 if this was the value of most interest.
b.
Country Year 1 Year 2 Year 3 Year 4 Year 5 Year 6
Albania 7.4 8.1 9.7 11.6 10.8 10.6
Argentina 169.7 198.0 241.0 301.3 285.1 339.6
Australia 704.5 758.3 916.9 983.0 934.2 1178.8
Austria 272.9 290.7 336.8 375.8 344.5 341.4
Belgium 335.6 355.4 408.5 451.7 421.4 416.5
Brazil 756.8 935.5 1175.0 1407.0 1370.8 1782.4
Canada 1056.8 1193.9 1332.1 1404.8 1245.2 1469.9
Costa Rica 18.9 21.2 24.7 28.0 28.0 33.9
Czech Republic 111.7 128.7 156.6 194.6 170.9 172.6
Finland 169.9 180.2 214.8 236.6 206.7 207.9
France 1915.0 2015.0 2312.8 2541.6 2367.9 2301.8
Germany 2516.9 2632.8 2984.7 3258.9 2973.7 2966.1
Greece 217.2 234.3 273.8 307.1 292.6 269.1
Ireland 177.7 195.3 229.6 233.3 199.5 186.2
Israel 122.4 133.2 153.4 185.7 178.7 199.8
Italy 1597.3 1661.9 1892.7 2063.9 1900.0 1836.9
Mexico 823.3 928.5 1011.9 1085.6 858.3 1010.3
Netherlands 567.3 600.9 694.8 775.4 708.0 700.8
New Zealand 108.9 105.1 129.0 125.7 112.9 136.2
Peru 72.3 84.4 98.5 117.8 120.4 144.3
Poland 267.8 300.1 371.9 463.4 382.6 413.4
Portugal 165.3 172.9 200.1 218.7 206.0 200.5
Saudi Arabia 317.4 358.4 386.7 477.3 374.4 436.2
Singapore 119.7 139.1 167.0 179.3 173.8 209.7
South Africa 220.3 232.2 254.4 247.5 256.9 328.8
Spain 1012.0 1100.0 1293.2 1459.0 1361.0 1287.9
Switzerland 350.6 368.2 409.2 474.7 464.9 498.2
Turkey 425.5 467.9 579.0 656.6 557.7 655.8
United Kingdom 2030.3 2178.0 2504.6 2381.9 1959.2 2005.6
United States 12579.7 13336.3 14010.9 14369.5 14113.3 14601.6
Gross Domestic Product (in Billions of US Dollars, $)
3. a. The chart contains unnecessary grid lines, the y-axis label values are spaced much
too close together, the shading of the chart does not add value.
b.
0
50000
100000
150000
200000
250000
Jan Feb Mar Apr May Jun Jul Aug Sep Oct Nov Dec
Revenue ($)
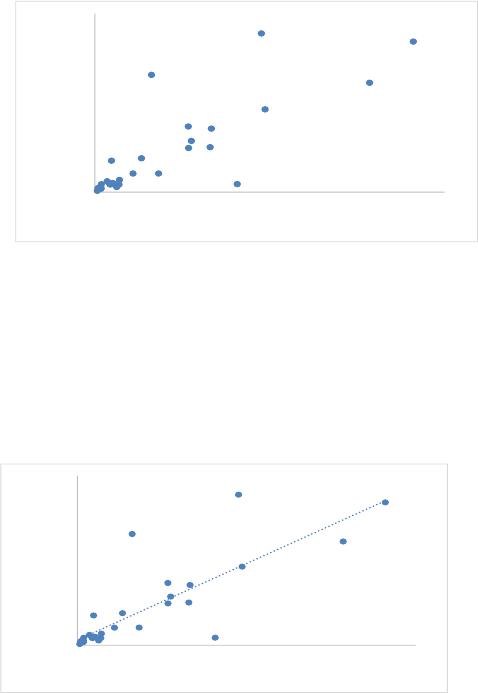
Note that here we have also added small markers on the line chart at each data point to indicate
that the data are not continuous.
10. a.
0
2,000
4,000
6,000
8,000
10,000
12,000
14,000
0 50,000 100,000 150,000 200,000
Profits ($ millions)
Market Capitalization ($ millions)
There appears to be a positive linear relationship between profits and market capitalization. As
profit increases, market capitalization also increases.
b.
0
2,000
4,000
6,000
8,000
10,000
12,000
14,000
0 50,000 100,000 150,000 200,000
Profits ($ millions)
Market Capitalization ($ millions)
The trend line confirms that there is a positive linear trend between profits and market
capitalization.
12. a.
0.00
0.50
1.00
1.50
2.00
2.50
3.00
3.50
4.00
4.50
1357911 13 15 17 19 21 23 25 27 29 31 33 35
Price ($)
Month
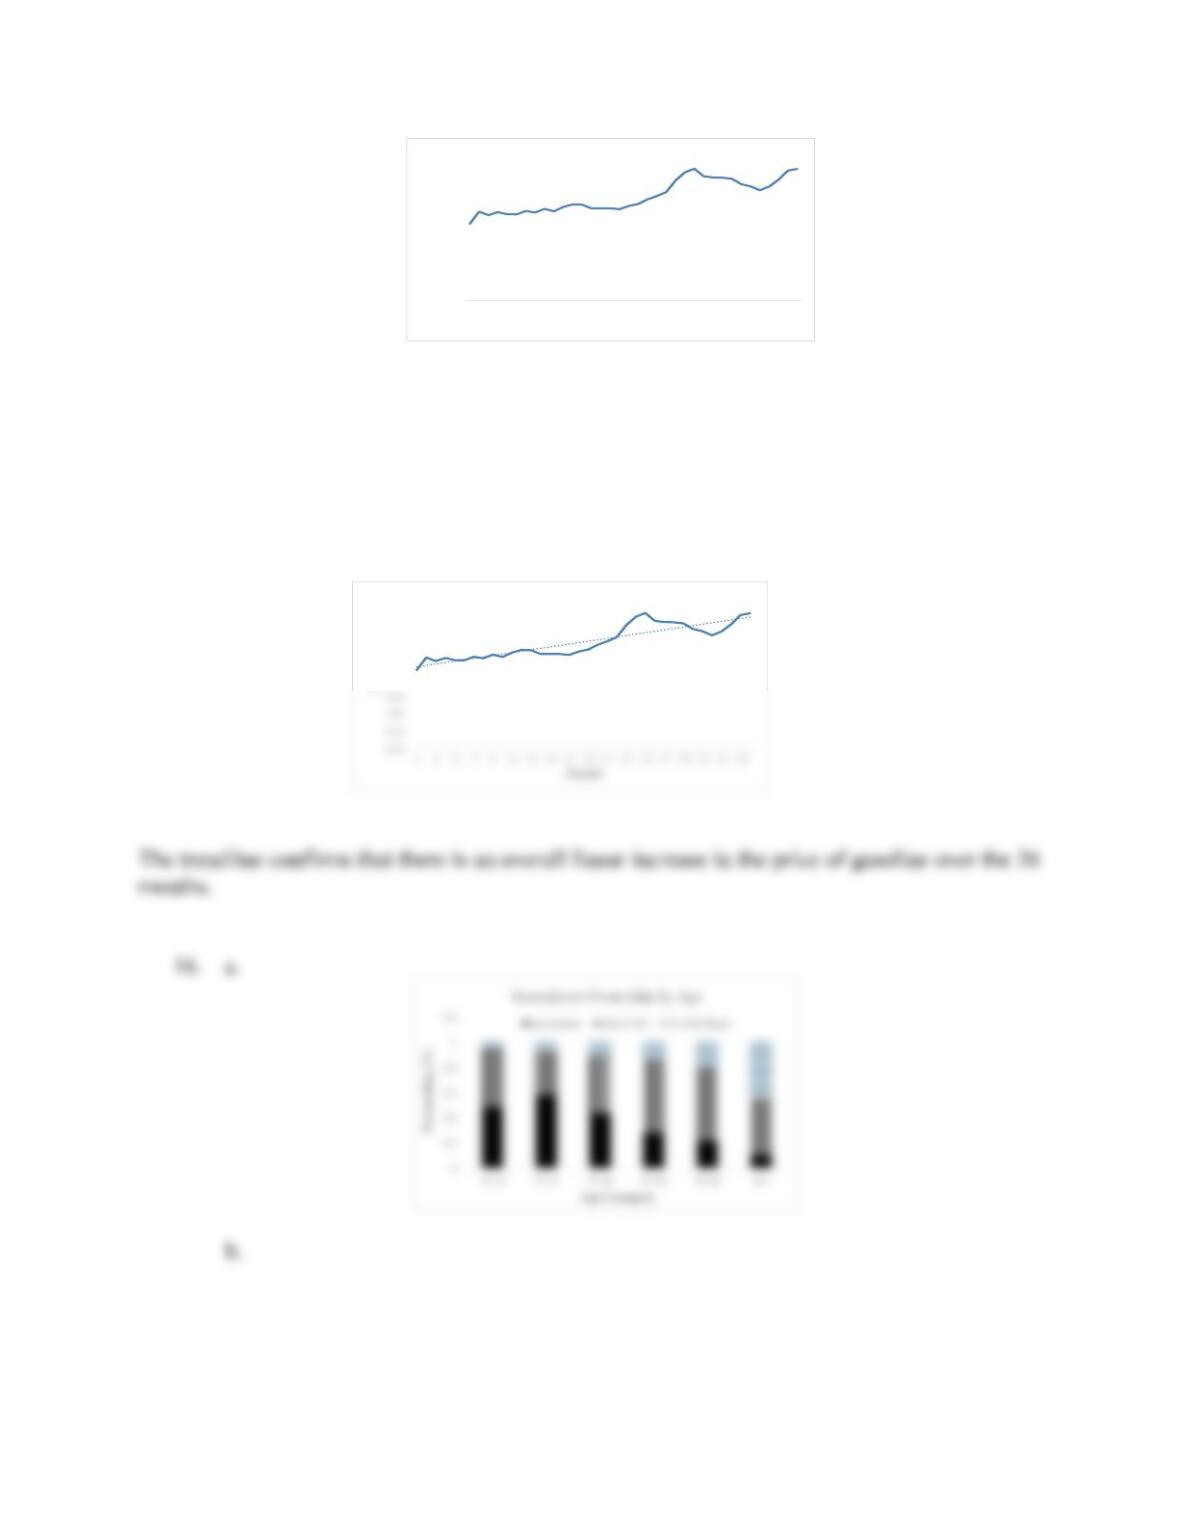
Gasoline prices were relatively steady for about the first 16 to 18 months and then increased
rapidly through about month 25 before falling before rising in the last few months. Overall the
price of gasoline appears to be increasing over the 36 months, but it is not a constant increase.
b.
2.00
2.50
3.00
3.50
4.00
4.50