MBA 646
Professor Carter
Assignment 5
Problem 1; Ch. 4: 11; Chapter 5: 2, 9, 46, 60, 78
1
Problem 1
These data show the random number of arrivals at a toll booth in a fixed period of one minute during peak hour. This is a typical
situation where the Poisson distribution often models the empirical data well.
This frequency graph could describe a binomial or Poisson process. In both cases, the mean (center of gravity) arrivals per minute
would appear to be between 2 and 3.
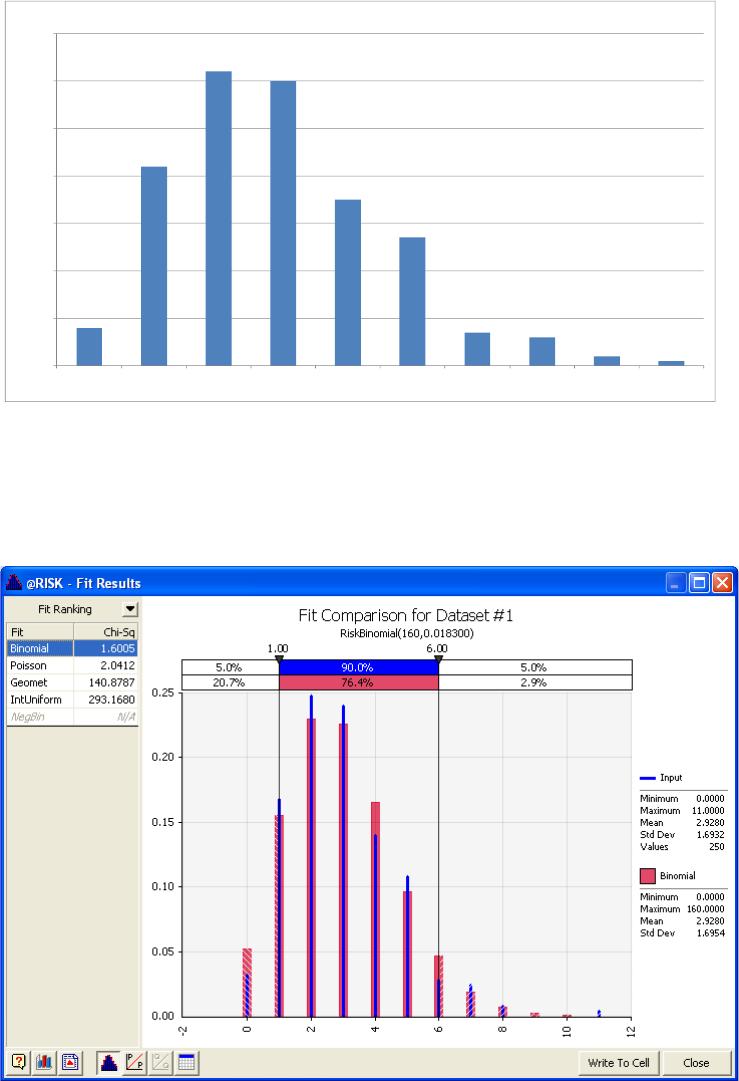
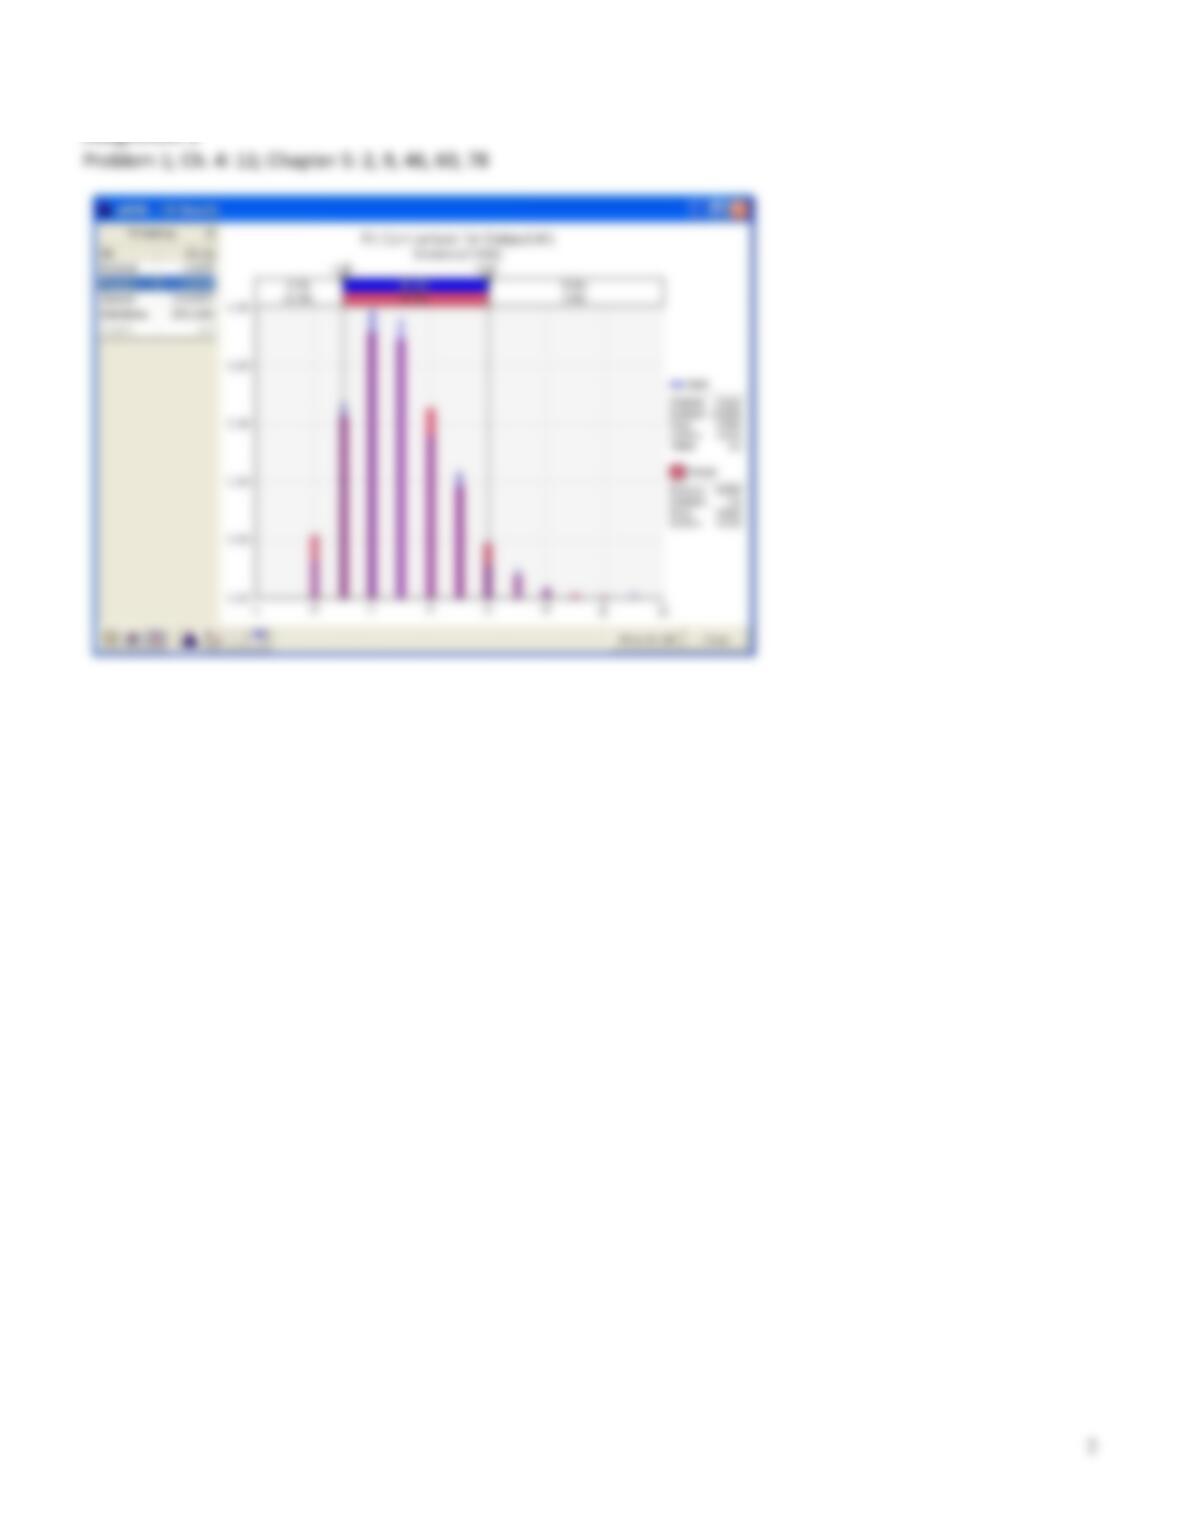
After specifying discrete data, @Risk produced the following chart:
This shows that the binomial model fits better than the Poisson model (it has the smaller Chi-square value of 1.60). The
parameters of the best fitting binomial are n = 160 and p = 0.0183.
Here is the fit of the Poisson distribution with a parameter (mean) of 2.928. Chi-square 2.04
0
10
20
30
40
50
60
70
0 1 2 3 4 5 6 7 8 11
F
r
e
q
u
e
n
c
y
Arrivals per minute
Arrivals frequency distribution
MBA 646
Professor Carter