Applied Summary Analysis Report
Target Corporation
Executive Summary
This report provides an analysis and evaluation of the current and prospective
profitability, liquidity and financial stability of Target Corporation. Methods of analysis include
trend and common size analyses as well as ratios such as Debt, Current and Quick ratios. Other
calculations include rates of return on Shareholders’ Equity and Total Assets and earnings per
share to name a few. Results of data analyzed show that all ratios are considered mostly above
average compared to industry standards. In particular, comparative performance is above average
in the areas of profit margins, liquidity, and debt to equity.
The report finds the prospects of the company in its current position are fairly positive.
The major areas of weakness require further investigation and remedial action by management.
Recommendations:
• Positively differentiate Target from other retailers
• Improve positive perceptions of Target for continued success
• Anticipate and respond quickly to changing consumer preferences.
• Successfully access capital markets or obtain bank credit for successful financial
position
Introduction
Target Corporation’s history begins in 1902, when founder George D. Dayton, a banker
and real estate investor, opened the Goodfellow Dry Goods Store in Minneapolis, Minnesota.
The business grew rapidly and George D. Dayton became the first president of the newly
renamed Dayton Dry Goods Company. After a decade of rapid growth, the company was
renamed The Dayton Company to better reflect its wide assortment of goods and services. The
company was able to survive during difficult economic time such as the Great depression.
Following George D. Dayton’s death in 1938, son George N. Dayton became the new President
of The Dayton Company. The company was run as a family enterprise and to keep the founders
values in place The Dayton Company established the practice of giving 5 percent of pretax
profits back to the community.
In 1953 Dayton’s opens a commercial interiors department tailored to offer furnishings,
fabrics and decorations for business and other public institutions. In 1956, Dayton Company
built the world’s first fully enclosed shopping mall just outside of downtown Minneapolis. On
May 1, 1962 The Dayton Company entered discount merchandising by opening its first Target
store in Roseville, Minnesota. Target differentiated itself from other retail stores by taking high
quality merchandise found in bargain basements of high-end department stores and sell it in its
own store.
The company’s growth continued with the 1969 acquisition of J.L. Hudson, a similar
department store. The merger established the corporation as one of the 15 largest non-food
retailers in the nation. In 1975, Target Stores becomes the number one revenue producer of the
Dayton-Hudson Corporation. In 1990, Target began opening larger Target Greatland stores and
in 1995 Target opened its first Super Target for convenient one-stop shopping. Finally in 2000,
Dayton-Hudson Corporation was renamed Target Corporation to better reflect its core business.
Body
Financial Ratios
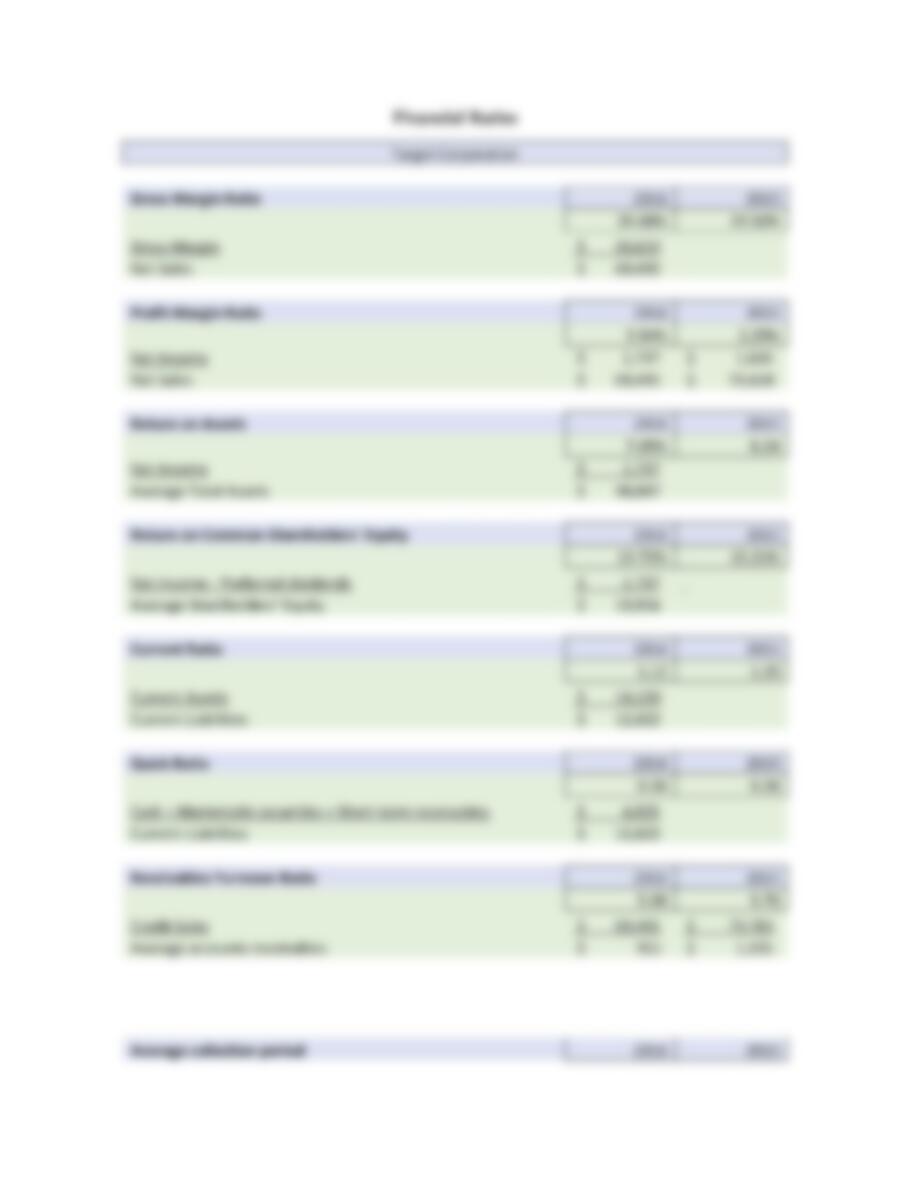
Current Ratio: Current ratio indicates whether a company has sufficient current assets to cover
current liabilities. Target’s current ratio deteriorated from 2015 to 2016. Target had 1.12 times of
current assets to meet the requirements of its current liabilities in 2016 and 1.20 times in 2015.
Quick Ratio: This indicates that the company has sufficient current assets to cover current
liabilities. In 2016 Target had 38 cents in quick assets for every dollar in current liabilities.
Target’s quick ratio did not improve from 2015 to 2016. Target’s quick ratio was at 0.38 in 2016.
Which is higher than the industry standard of 0.15.
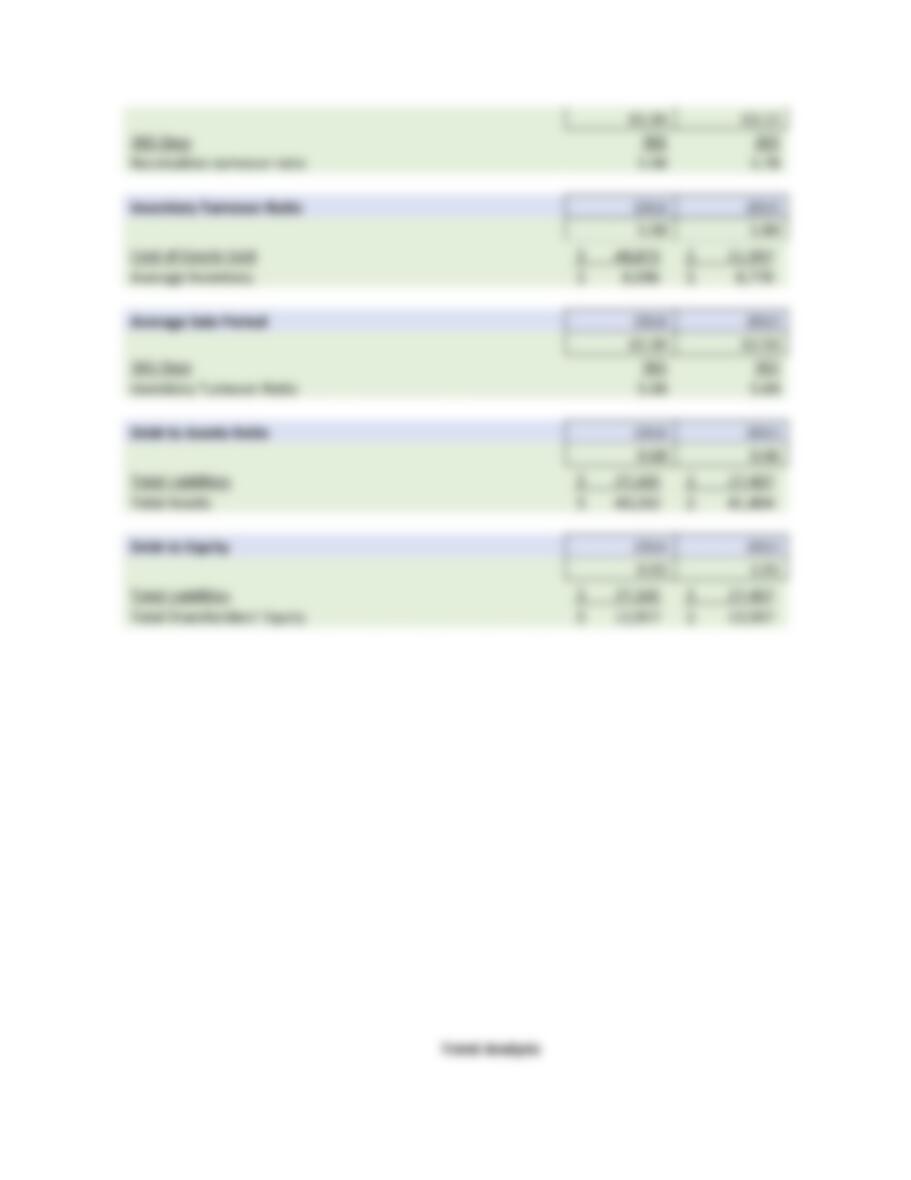
Inventory Turnover Ratio: indicates how many times inventory is sold and restocked in a
given period. Target is able to sell off its inventory 5.98 times in the year 2016 and 5.84 times in
2015. The ratio in 2016 was actually higher than the industry standard of 5.86. However,
Target’s Inventory Turnover Ratio is ranked number 1 in the Department and Discount Retail
Industry but is ranked 55 in the retail sector.
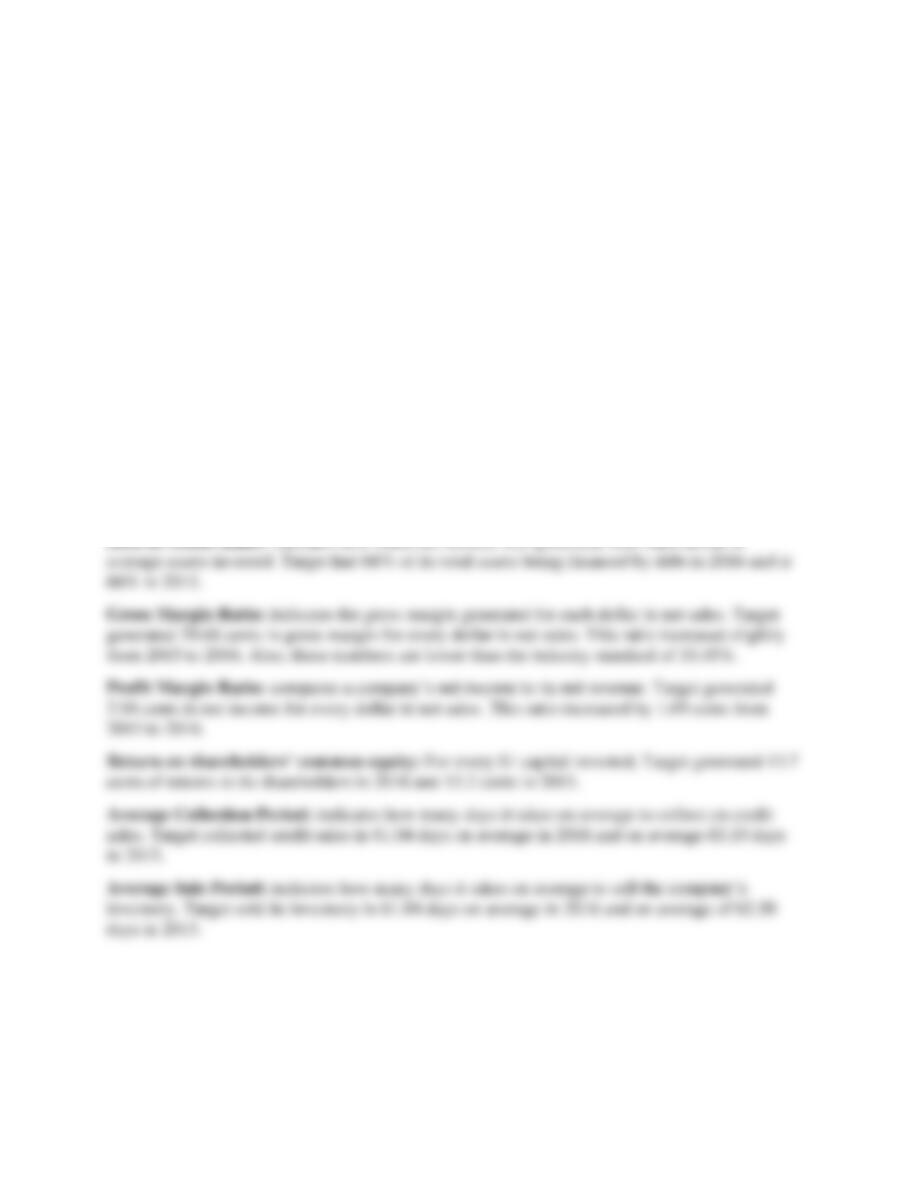
Average Collection Period: indicates how many days it takes on average to collect on credit
sales. Target was able to collect its debt on average 61.04 days after the debt is made in 2016 and
on average of 63.15 in 2015.