APPLE, INC.
TICKER: AAPL
CURRENT PRICE: $133.00
RECOMMENDATION: Sell
PRICE TARGET: $120.00
Company Description
Designs, manufactures, and markets mobile communication and media devices, personal
computers, and portable digital music players worldwide.
Company also sells related software, services, accessories, networking solutions, and third-party
digital content and applications.
Economic Outlook
Growth in emerging markets such as China provides signi cant upside for Apple globally.
Diverse product lines allow promising revenue and consistent cash “ow.
AAPL stock price has a high ceiling according to most analysts.
Stock Performance
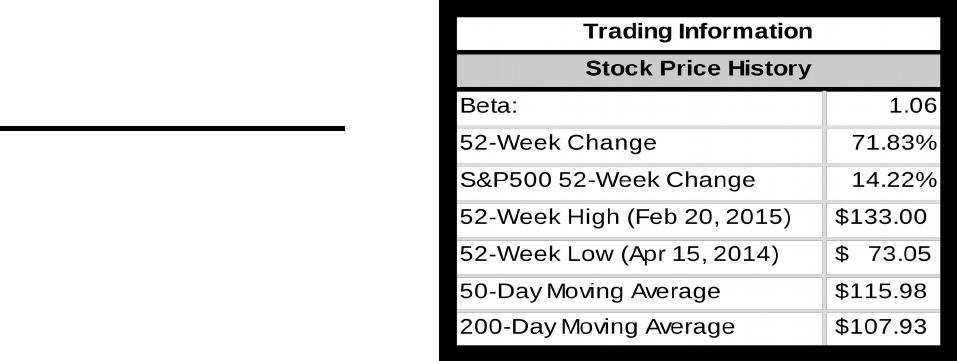
APPL stock currently trades at $133.00 as of the market close on February 23, 2015.
The security has recently achieved all-time highs.
Fundamental Analysis
Current P/E is in line with historical averages. EPS nearly double closest competitors.
Market to book ratio is lower than the industry average.
Apple liquidity and asset utilization ratios continue to impress.
Technical Analysis
MACD and RSI show that the stock is approaching levels considered overbought.
AAPL stock is currently trading above its 10, 50, and 90 day SMA.
Comparison of payout ratio, as well as dividend growth analysis.

Company Description & Economic Outlook
Brief History
Apple Inc., originally founded as Apple Computer Inc., is a leading consumer electronics company
and one of the most recognized brands in the world. Apple Inc. was founded in 1976 in the region
today known as “Silicon Valley”, California. The story of Apple’s modest establishment, through its
founders Steve Jobs and Steve Wozniak is generally regarded as the symbol of a Silicon Valley
startup achieving global success.[ CITATION Lev14 \l 1033 ]
From its inception, Apple has competed in the consumer electronics industry. Apple’s roots began in
the personal computing industry, where throughout the 1980s they sought to make computers
accessible to the general public battling tech titans IBM and Microsoft. Their focus was making
personal computing accessible for the general consumer, and Apple computers were the first to
popularize a graphical user interface assisted by use of a mouse.
Much of Apple’s success is attributed to their founder Steve Jobs, whose passion, drive, and
attention to detail led Apple from their beginning in a two-car garage to a tech titan. After being
removed from Apple in 1985, and a market shift toward competitor’s products such as those
created by Microsoft, Apple found itself near bankruptcy. In 1997, after purchasing Steve Jobs’
software company NeXT – which later became the underpinnings of OS X and iOS – Steve Jobs
returned to Apple. He then led the company to develop some of the most popular products in the
world, which include iPods, iTunes Music & Movies, MacBook Computers, iPhones, and iPads.
Competitors
The mobile industry is fiercely competitive, driven through constant innovation. Consumers are
constantly upgrading devices as new features and improvements are released. Apple, as a device
manufacturer is consistently challenged from both mobile software and device manufacturers. The
largest direct competitors challenging iPhone sales for both the US and abroad are Samsung, HTC,
LG, and the astonishing fast growth up-and-comer Xiaomi. All of these competitors run Google’s
Android operating system, a mobile operating system that Google releases free to device
manufacturers. Despite having lagged behind Android sales in the US, the recent 4Q15 iPhone sales
data shows that Apple overtook Android sales for the first time in 2 years. The release of larger
screen iPhones resulted in increased sales in almost every developed country where iPhones are
sold. [ CITATION Kif15 \l 1033 ]
Economic Outlook
Today, personal computing makes up a much smaller portion of Apple’s earnings. As of 1Q15
reporting, Apple reported revenue of $74.6B, net profit of $18B, gross margins of 39.9%, and
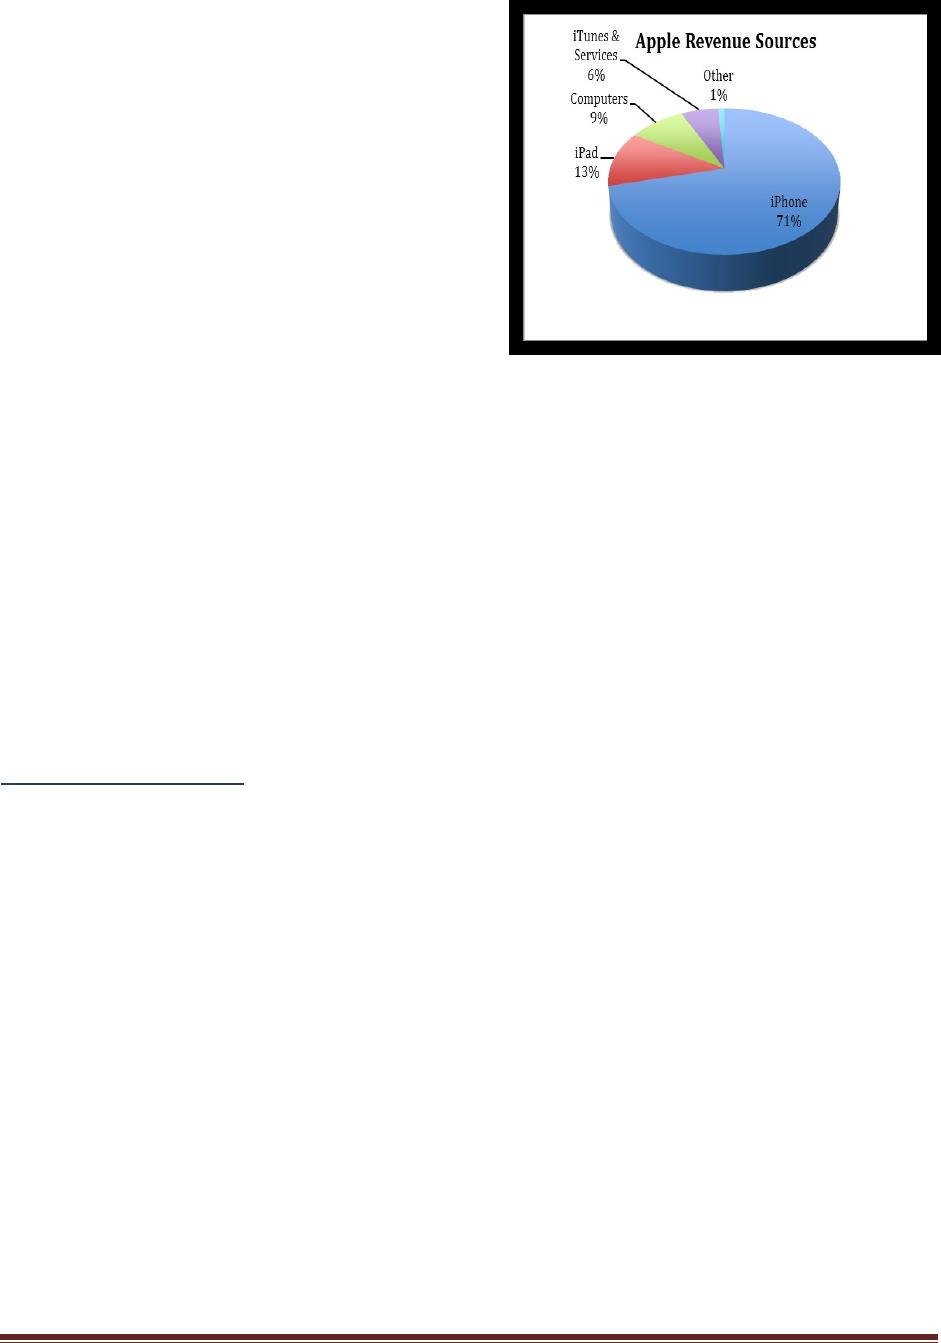
increased their cash on hand to $178B. A significant portion of the revenue came from blockbuster
iPhone sales, attributed to the recent release of the iPhone 6 and 6Plus in addition to new sales
opportunities in China. [ CITATION App15 \l 1033 ] The current breakdown of Apple’s 1Q15
reported revenue is as follows [ CITATION Jor15 \l 1033 ]
The economic outlook for Apple looks promising
due to several key indicators. The first is increased
demand in key markets like China where Apple’s
presence was previously limited due to
restrictions by the Chinese government. New
carrier deals have made the iPhone available to
one of the fastest growing markets. In the 1Q15
reported revenue of $16.4B, up a staggering 70%
from a year ago. Additionally, emerging markets
such as Brazil, Russia, and India show increased
revenue topping 97%. The following graph shows
key international growth markets [ CITATION
Ing15 \l 1033 ]
Forward Outlook
Based on the continued success of iPhone and iPad sales, especially in the emerging markets
previous detailed, forward projection of an increased stock price is based upon projected iWatch
sales. As of February 11, JP Morgan increased their year-end forecast of AAPL to $145. This is
primarily based on Analyst Rod Hall of JP Morgan’s estimate of iWatch sales. The estimate projects
Apple to sell 26.3 million units in 2015. That projection is based upon revenue continuing with
Apple’s historic 39% margin and earnings of $9.21 per share. [ CITATION Nei14 \l 1033 ]
Stock Performance
Stock History
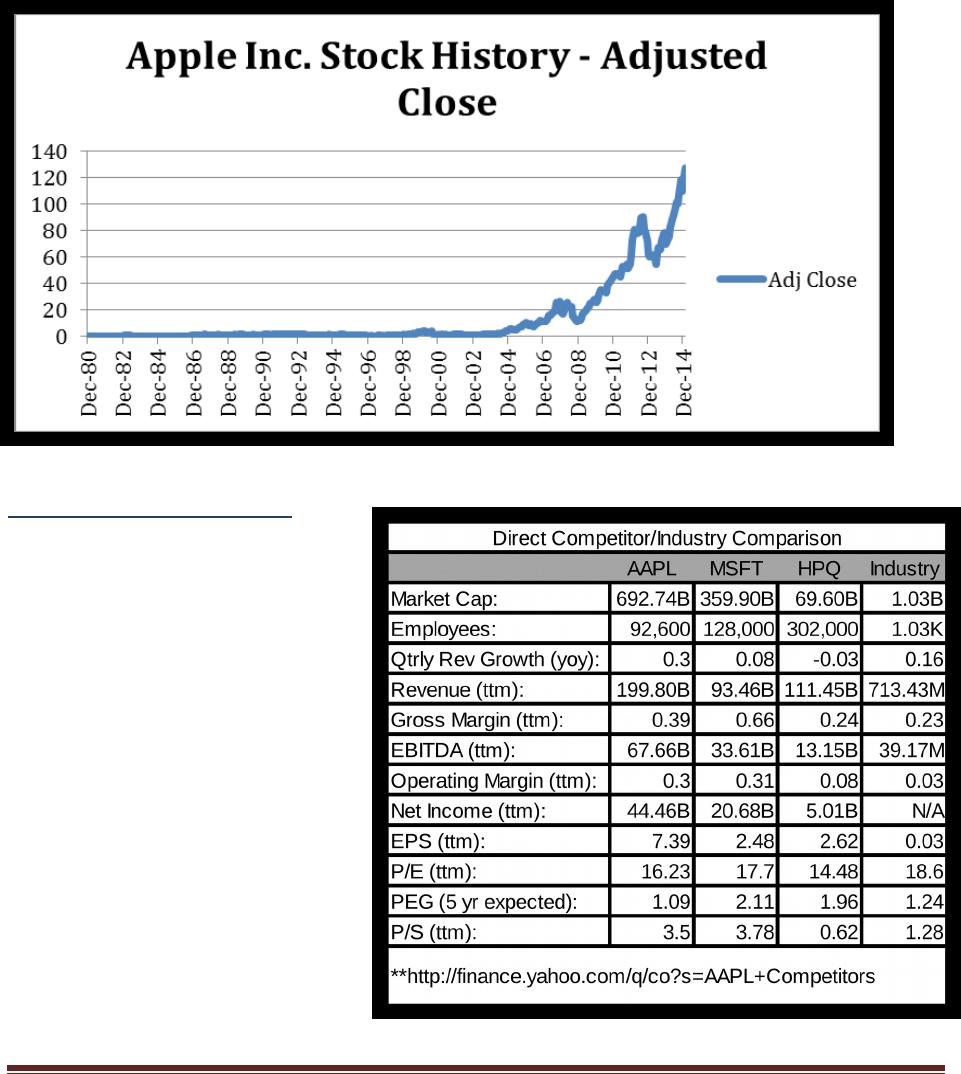
Apple Inc.’s initial public offering was on Dec 12, 1980 at $22 per share. By the end of the first
trading day all shares were sold and the stock closed at $29 a share which when adjusted to today’s
value due to stock splits would represent $.52. Thought much mid ‘80s and early ‘90s AAPL’s stock
was a poor performer. They were unable to achieve gains throughout that period in the face of strict
competition from the likes of Microsoft and Dell. The return of Steve Jobs to a struggling AAPL
ushered in a new era in growth. From 1997 to 1999 Apple saw enormous gains, running from $3 a
share to $37. Growth was largely attributed to new success in Apple’s line of Macintosh computers.
Another significant run occurred between the spring of 2005 and the following winter; AAPL saw
its stock increase by 50%. During 2005, AAPL quadrupled due to continued success of its product
lineup. From 2009 to current, APPL has had a meteoric rise attributed to blockbuster sales from
their iPhone and iPad music line. [ CITATION Unk15 \l 1033 ]As of Feb 23, 2015 the stock closed at
$133.00. The significant gains in Apple stock occurred primarily from 2004 forward, with revenue
gains largely from iPods, iPhones, and iPads.
The biggest question regarding Apple stock may be “where is the ceiling?” For AAPL, one may not
exist. Based on performance in China and emerging markets, and the potential for significant Apple
Watch sales (soon to be released), the current consensus is to outperform the market with a target
stock price of $135 within 12 months.
According to the financial times, “The 41 analysts offering 12 month price targets for Apple Inc.
have a median target of $135.00, with a high estimate of $160.00 and a low estimate of $60.00. The
median estimate represents a 6.23% increase from the last price of $127.08.” [ CITATION App151 \l
1033 ]
Fundamental Analysis
A Fundamental Analysis of Apple
(AAPL) indicates that the company
demonstrates positive
performance when compared to
the Electronic Equipment industry.
The company’s different measures
of margins and ratios are also
typically above those of its
competitors. This fundamental
analysis will compare several of
these key ratios and show that the
company is a good stock to buy, as
far as value stock is concerned.
This analysis will examine the
company’s financial statements
over the past three years and
calculate the company’s growth
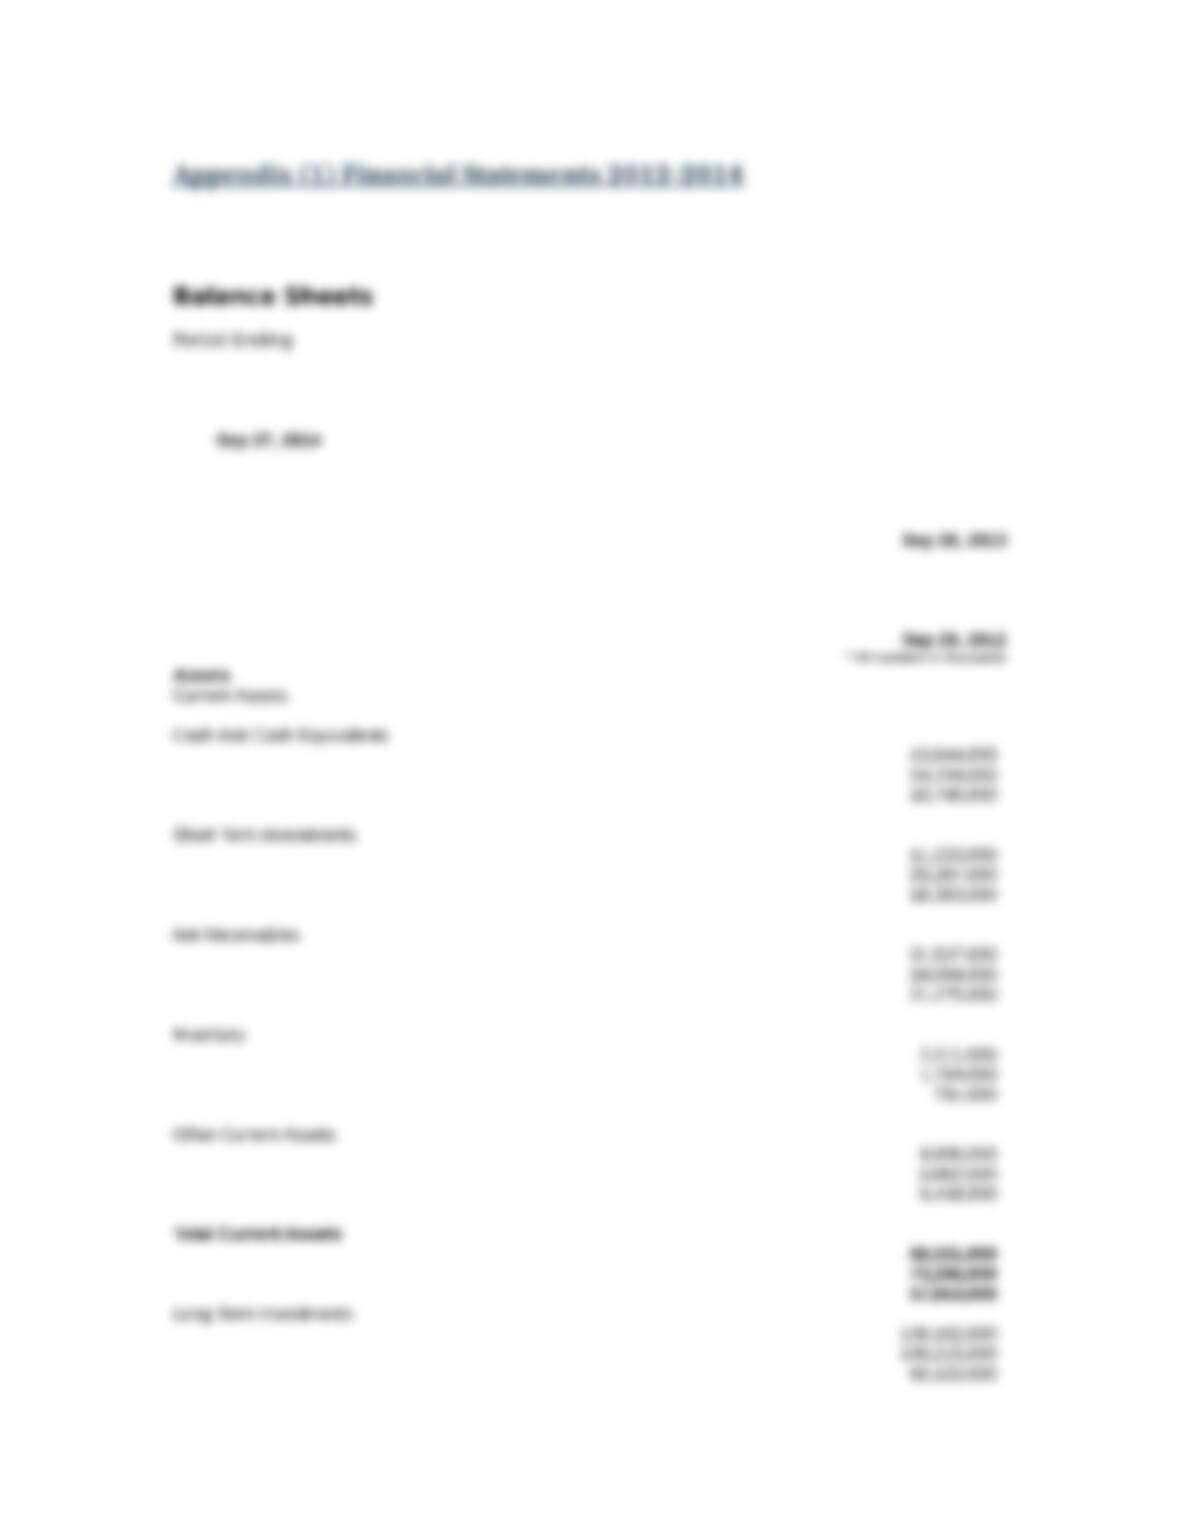
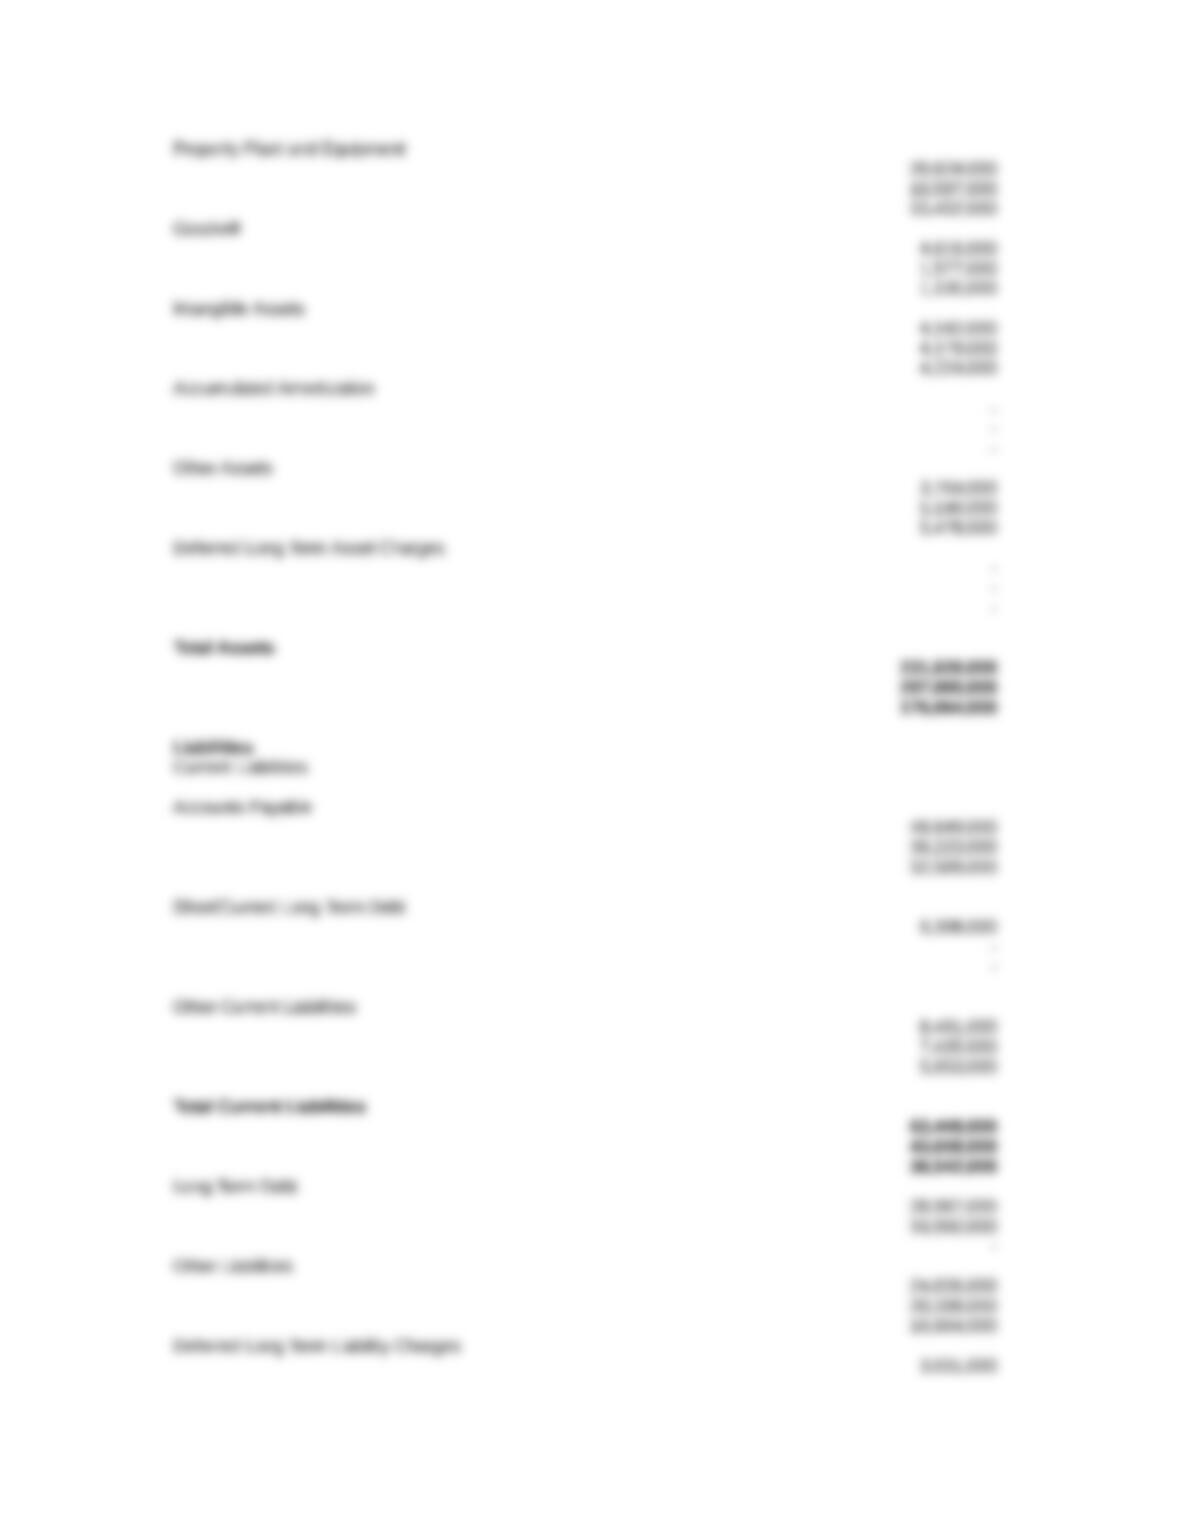
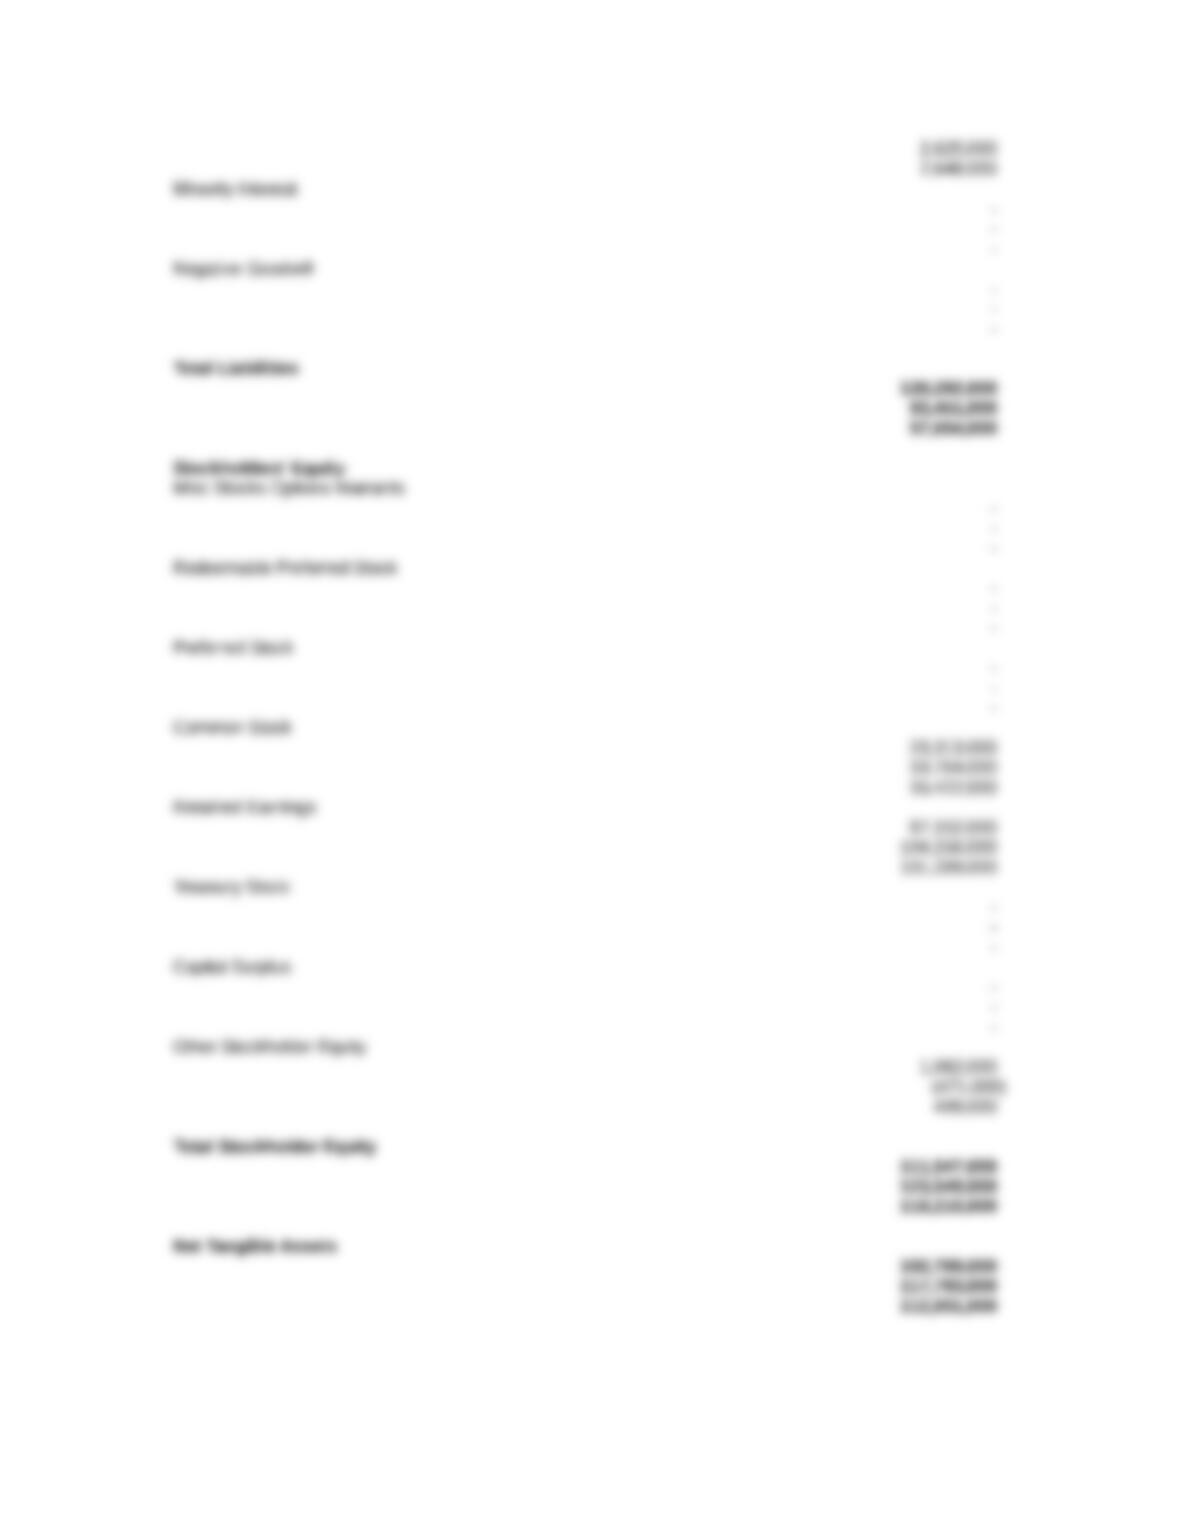
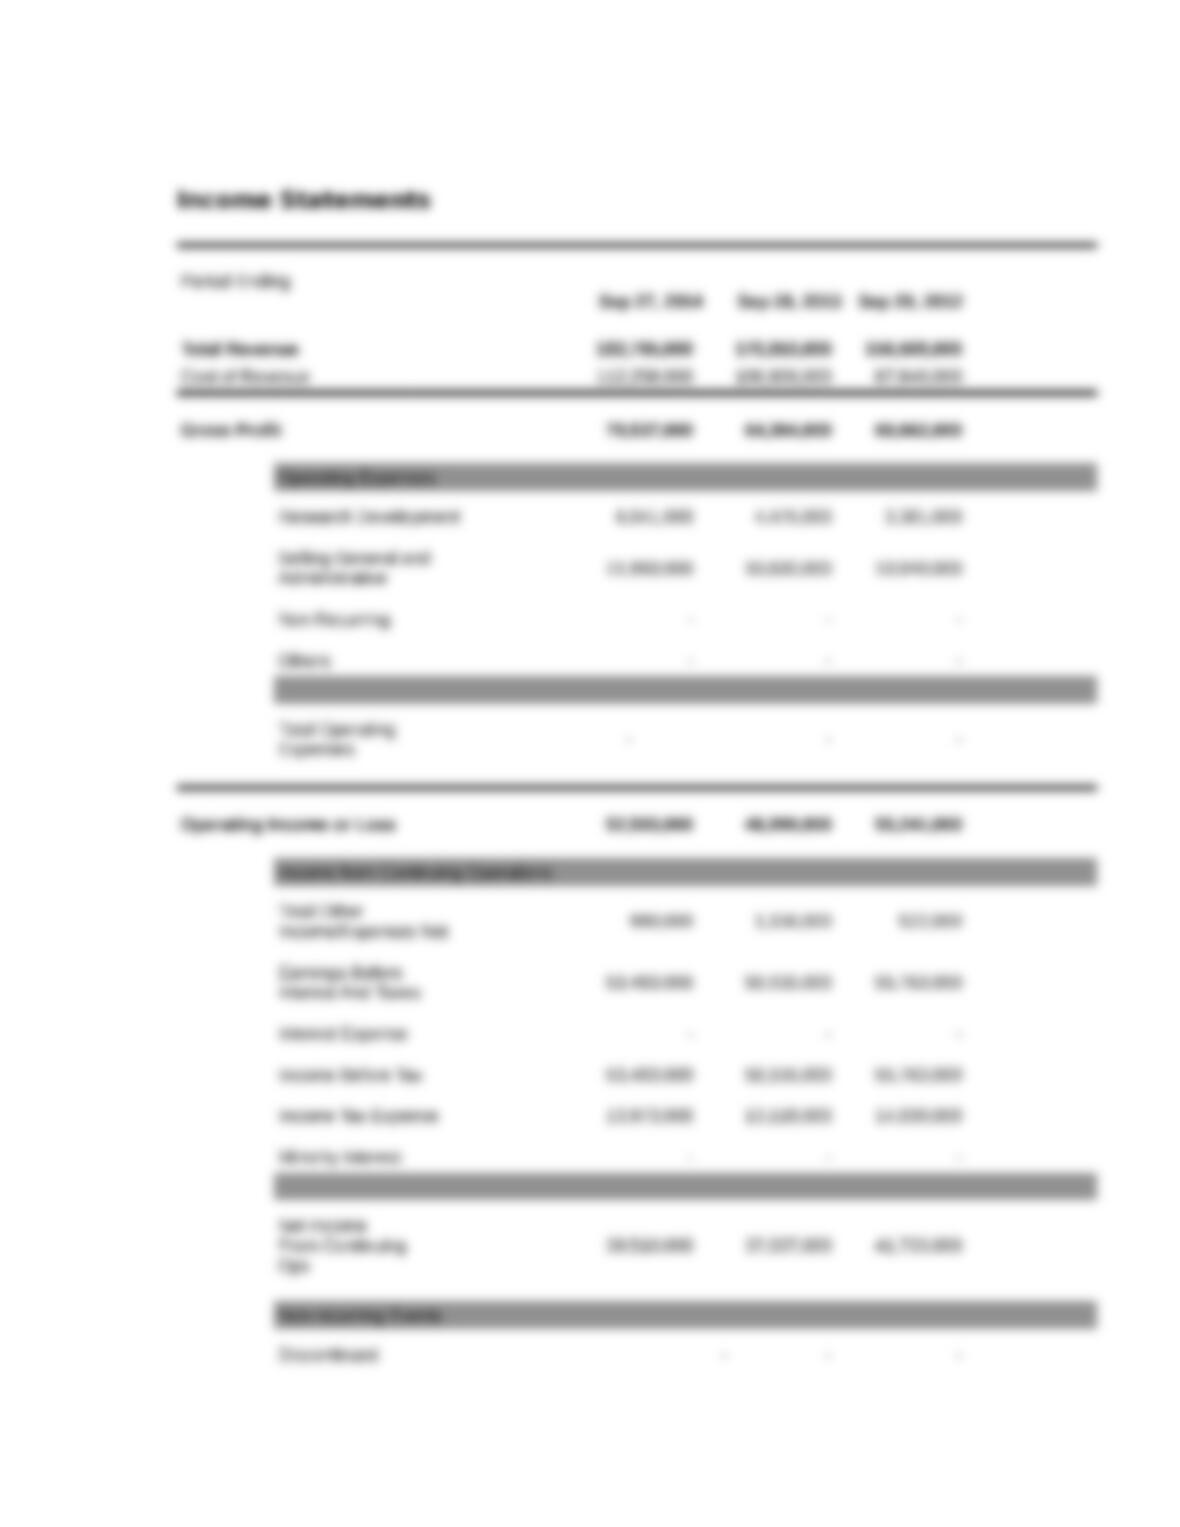
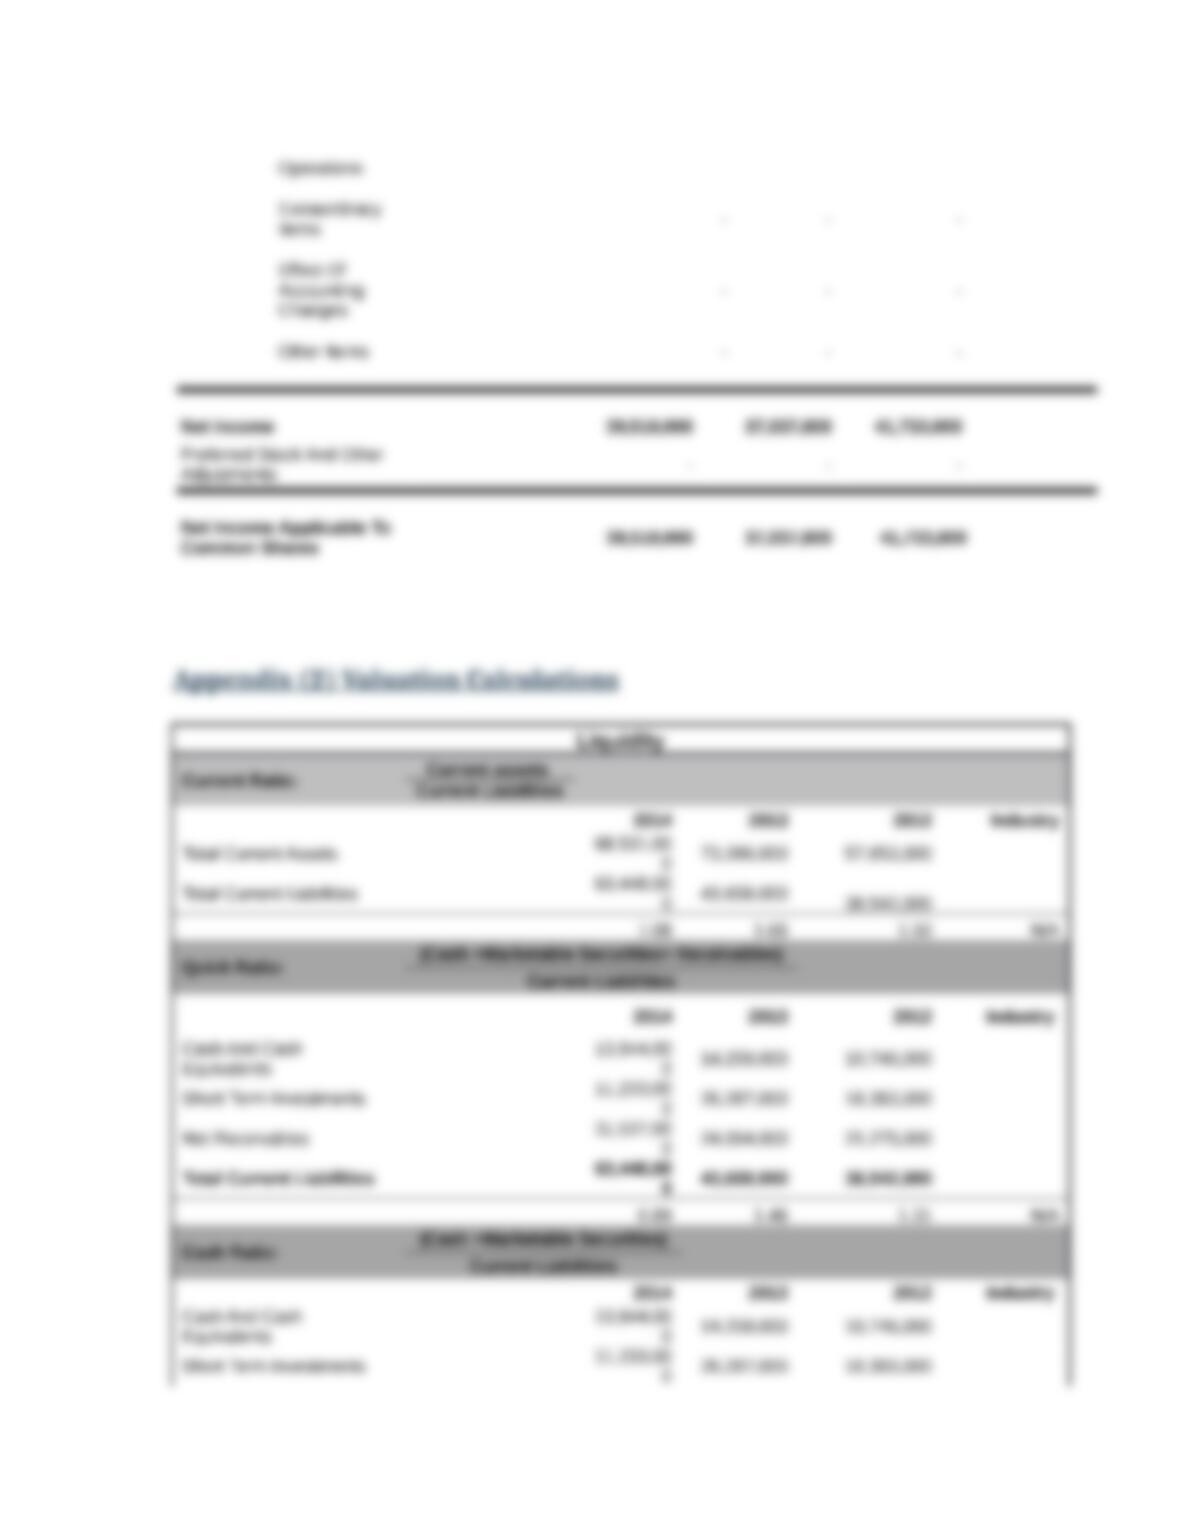
rate and profitability. The Company’s financial statements along with the calculations used to
determine these ratios can be referenced in Appendix 1 and 2.
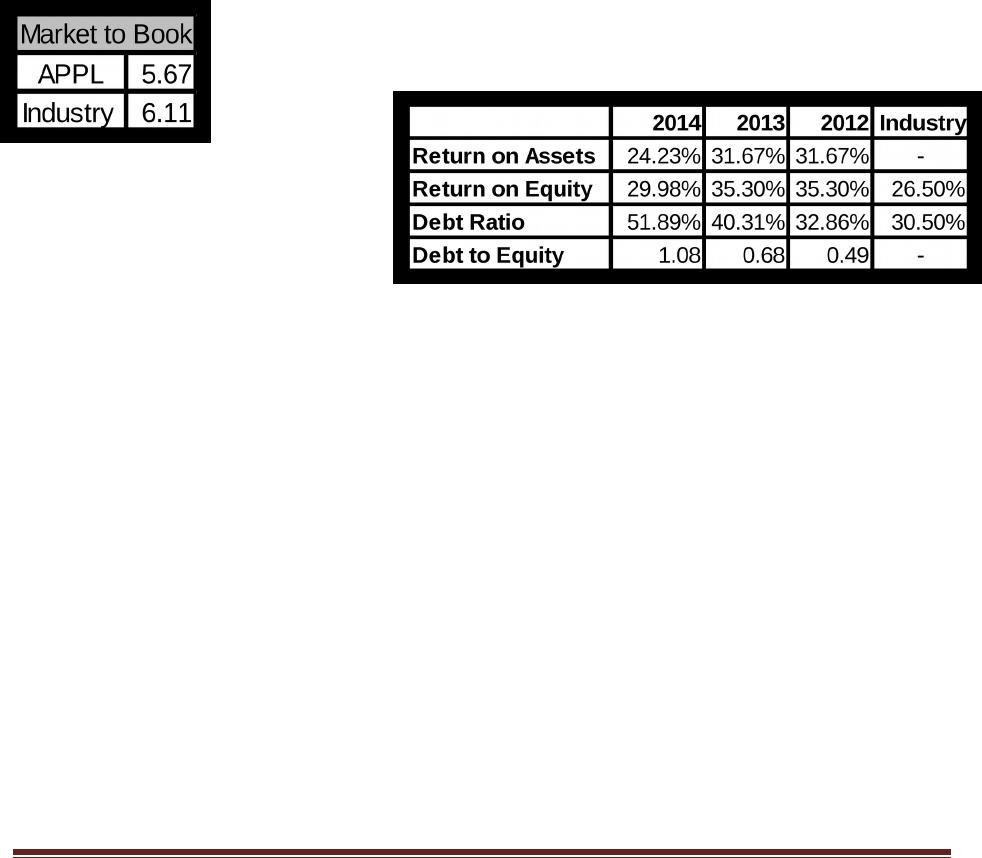
The chart to the right is a direct comparison of Apples key profitability and growth ratios with that
of two of its major competitors, Microsoft (MSFT) and Hewlett-Packard (HPQ), and well as the
Electronic Equipment industry.
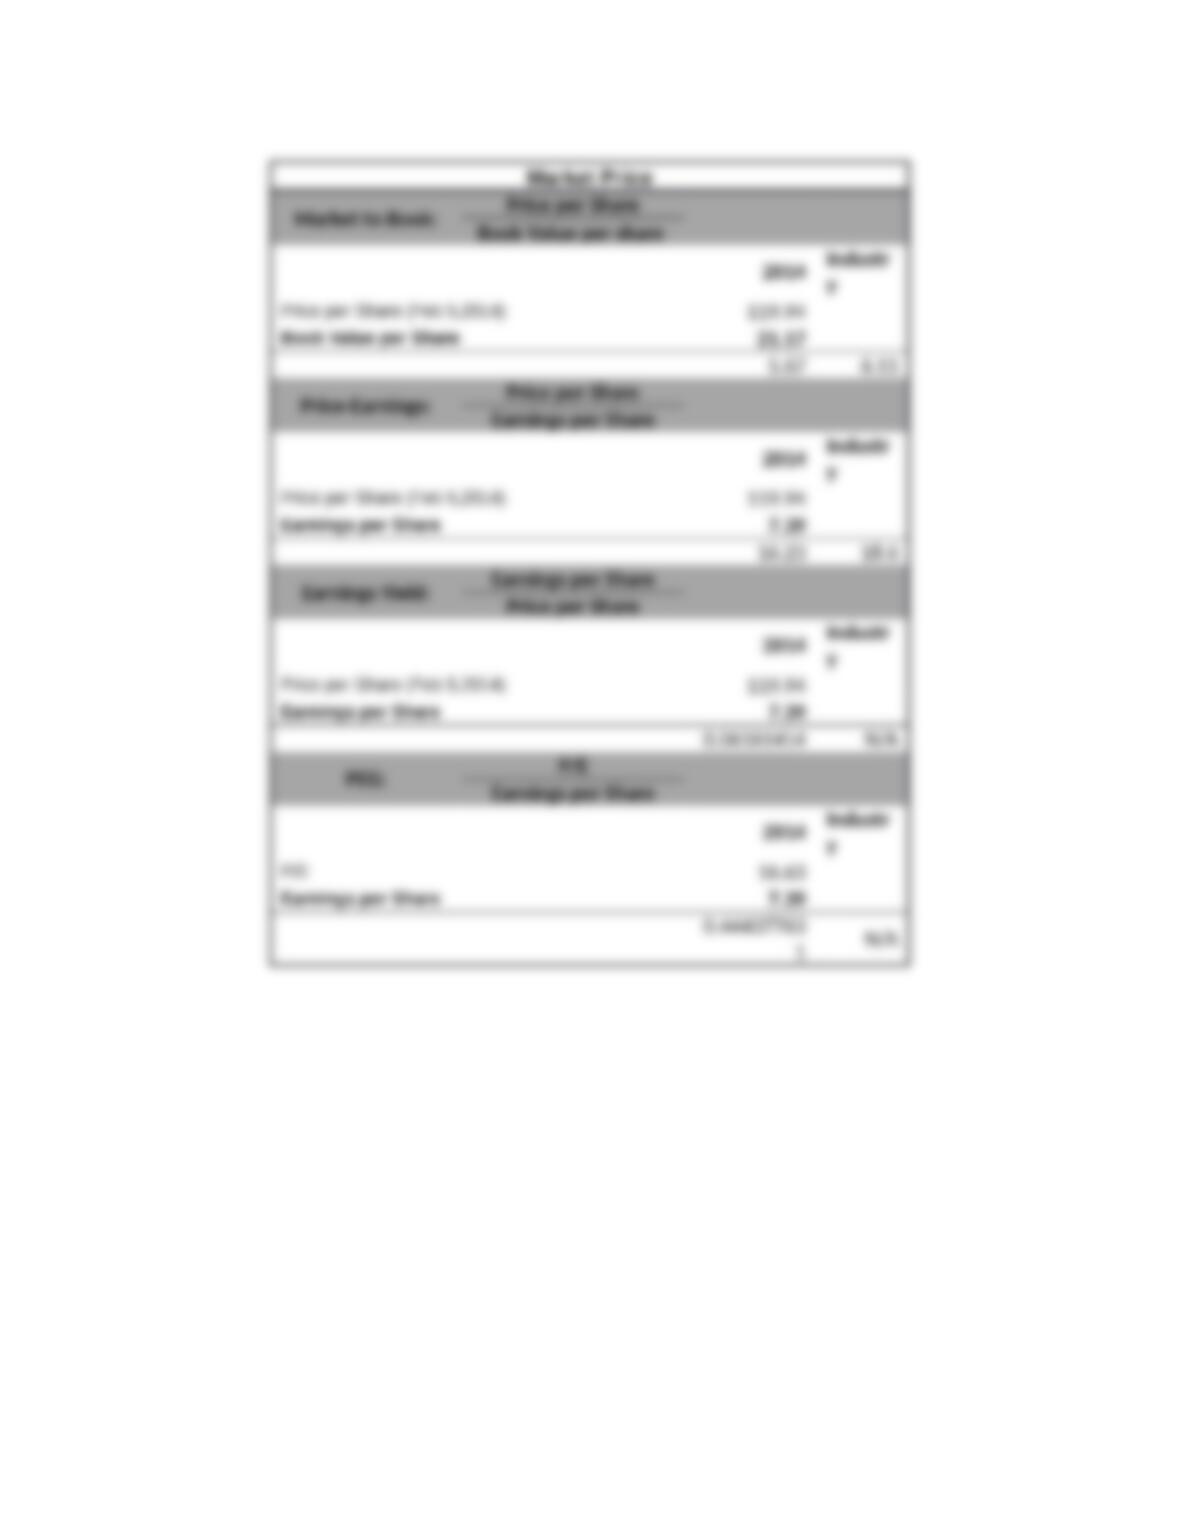
Apple has a current P/E of 16.23. Historically, the average P/E ratio in the market has been around
15-25. When compared to the industry average of 18.6 Apple is lower. This low P/E ratio is
indicative of a vital trait associated with value stocks. The stock out performs the market and its
competitors with its current earnings per share (EPS) of 7.39. The current EPS is nearly double that
of its closest competitor, MSFT. This is not the only area where Apple manages to beat both
competitors and the industry. When it comes to the revenue the company is able to generate nearly
two billion dollars, more than double that of MSFT and 93% more than HPQ. Additionally, the
company out performs the industry average when it comes to the gross margin and quarterly
revenue growth ratios.
Apple’s Market to Book ratio of 5.67 is lower than the industry average.
This ratio signifies that there are high growth expectations for the
company.
The
industry
having a
6.11 Market to Book ratio signifies
that stocks within it are relatively
overvalued. Companies in high-
growth industry sectors, such as
Internet/Electronic; which Apple is
a part of, typically have high market to book ratios because investors expect these companies to
demonstrate high year-over-year profit growth.
Profitability
As can be seen in the below graph Apple has seen a decrease in both Return on Assets and Equity
within the last three years. This has resulted in an increase in the Debt and Debt to Equity ratios.
While is it evident that the Apple Debt ratio is 21% higher than the industry average the ROE over
the past three years has performed better that the industry by an average of 7%.
Liquidity
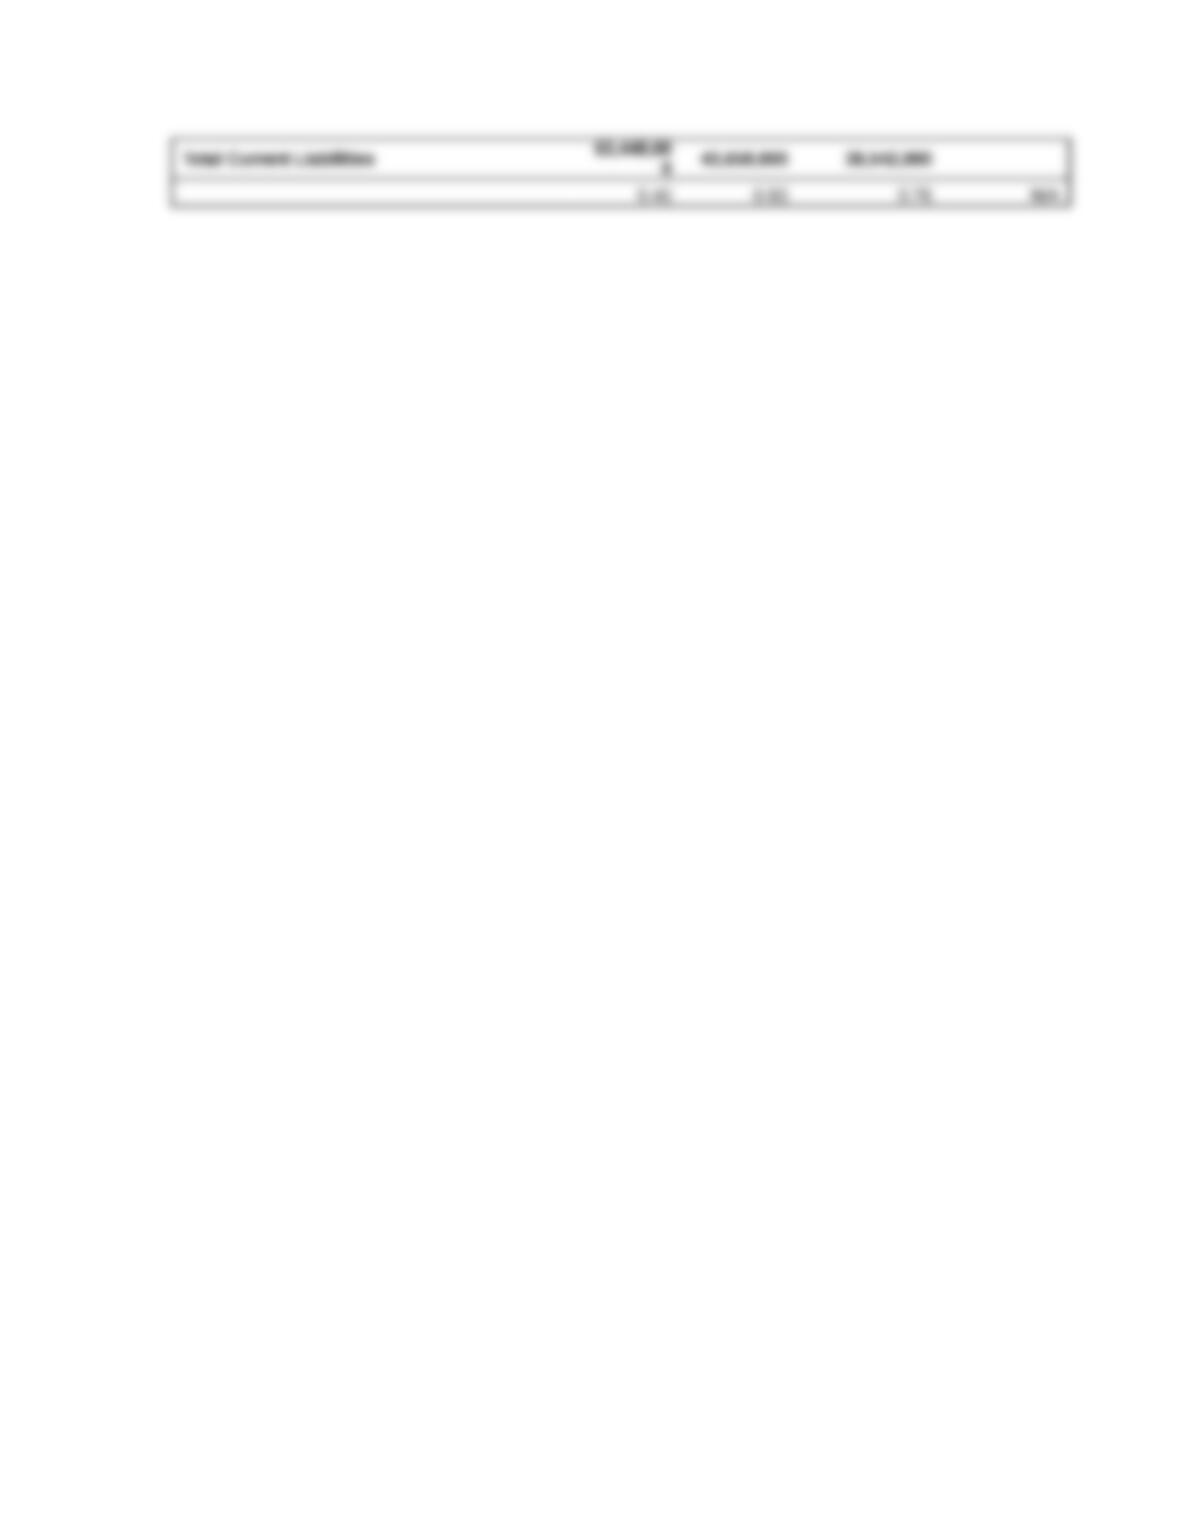
Apples’ current ratio for the past three years denotes that it has consistently been able to cover all
of its short-term obligations/liabilities with its current assets. With regards to the quick ratio, it has
decreased over the past three years. This is due to a 46% increase in current liabilities and a 40%
decrease in cash and marketable securities from 2013 to 2014. The decrease in cash ratio in 2014
was due in part to the amount of cash and cash equivalent held on its balance sheet for that year. In
doing so Apple has been able to pay a dividend in February and March 2014 at a rate of $3.29 and
$3.05 respectively.
Asset Utilization
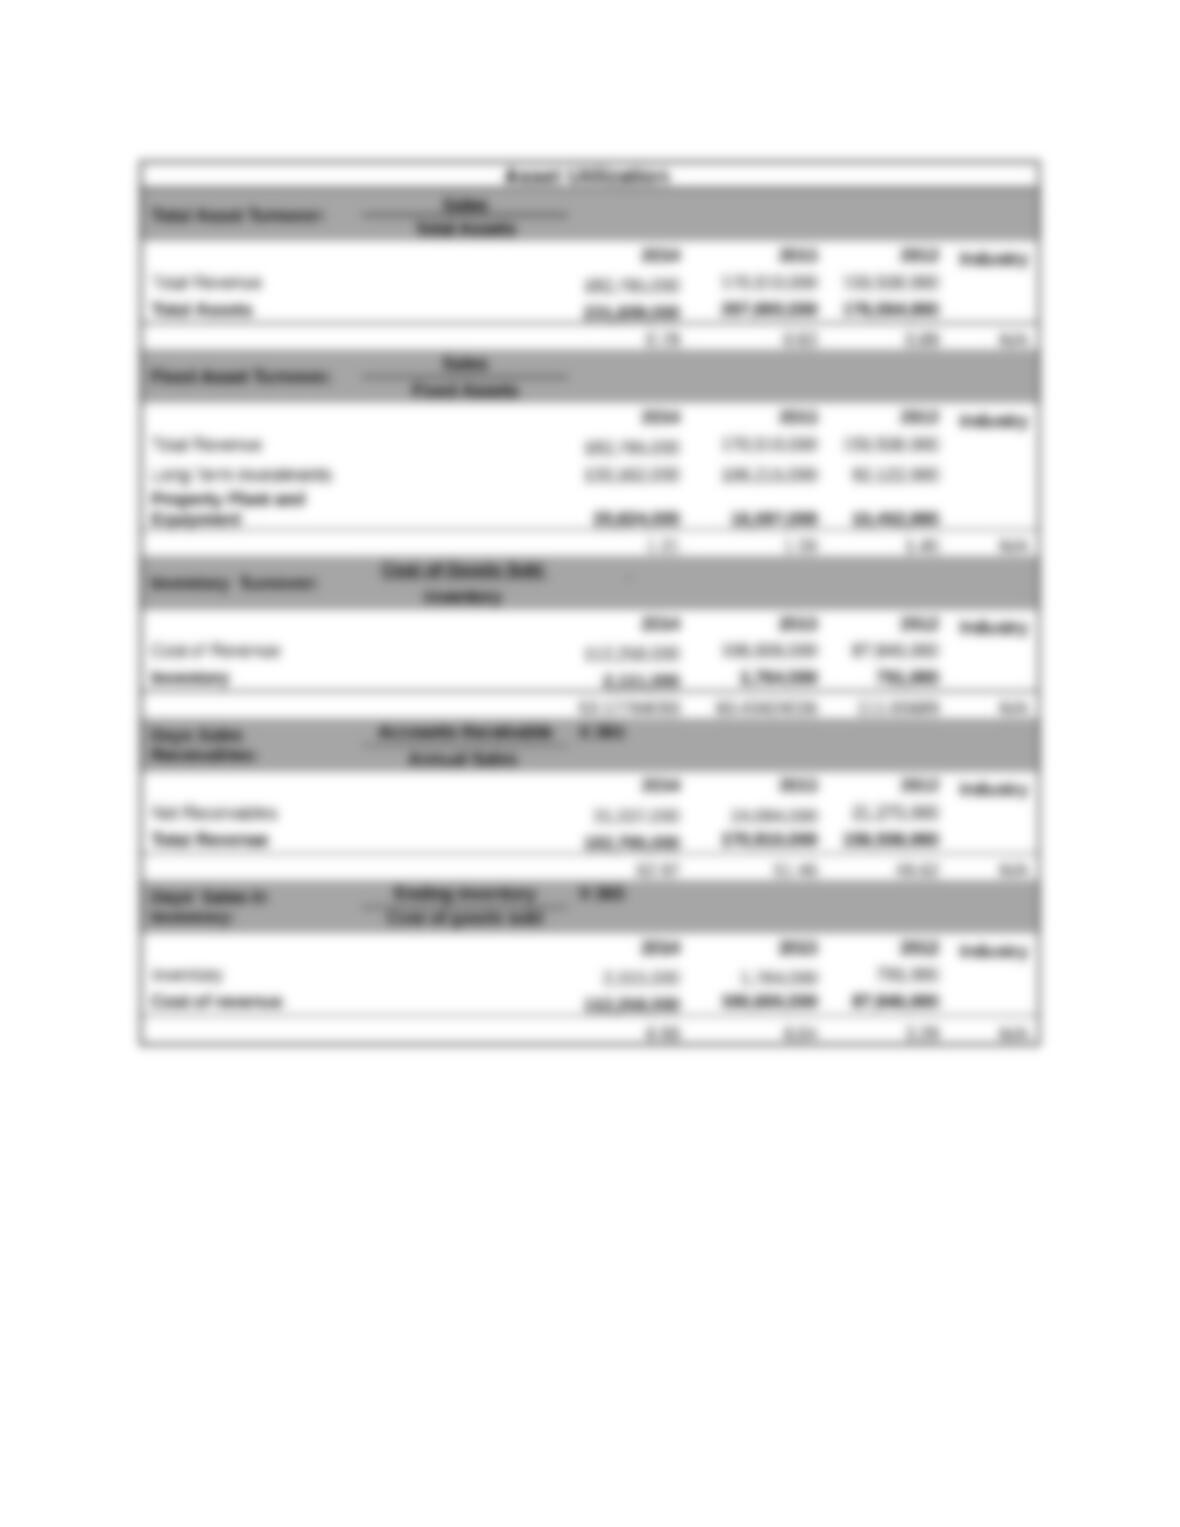
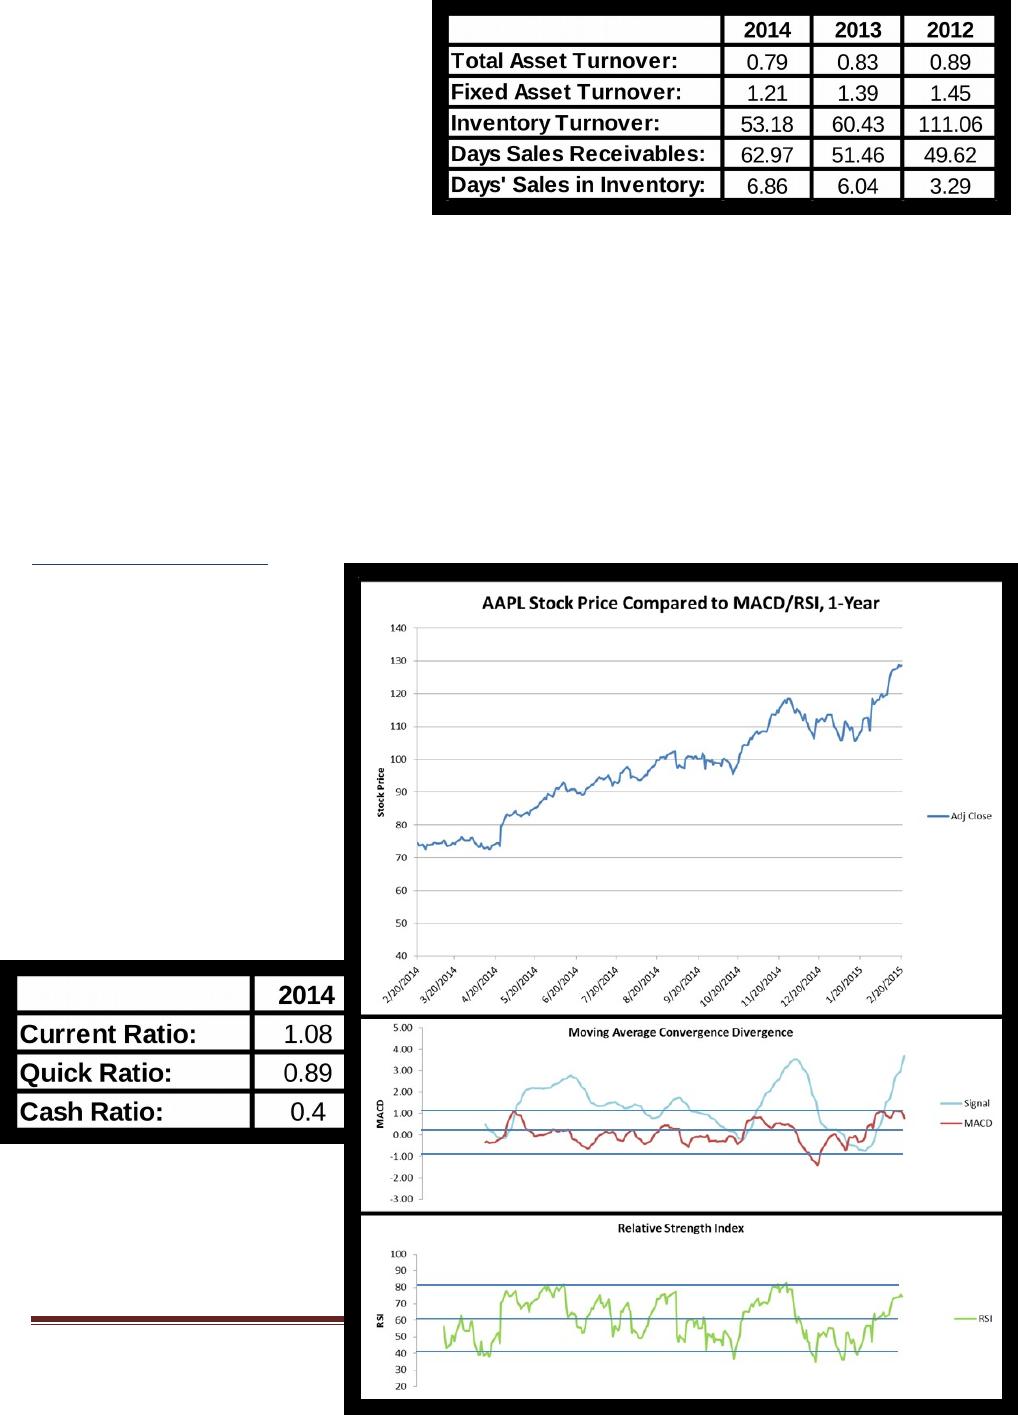
The decrease in Total Asset and Total Fixed Asset Turnover ratios combined with the increase of
Inventory Turnover and Days Sales Receivable and in Inventory is an indication the Apple sales have
decreased over the past three years. While assets have increased by 31% since 2012 the increase of
revenue has been nearly half that at 16%. Additionally, the increase in ending year inventory from
2012 to 2014 has increased by over 100%.
Technical Analysis
Apple stock has undergone
an incredible run during the
early months of 2015. Many
analysts have expected this
breakout for quite some time.
However, when comparing
the current stock price to a
few key technical indicators,
the argument can be made
that Apple’s stock may be
overdue for a small pull back
or correction.
MACD
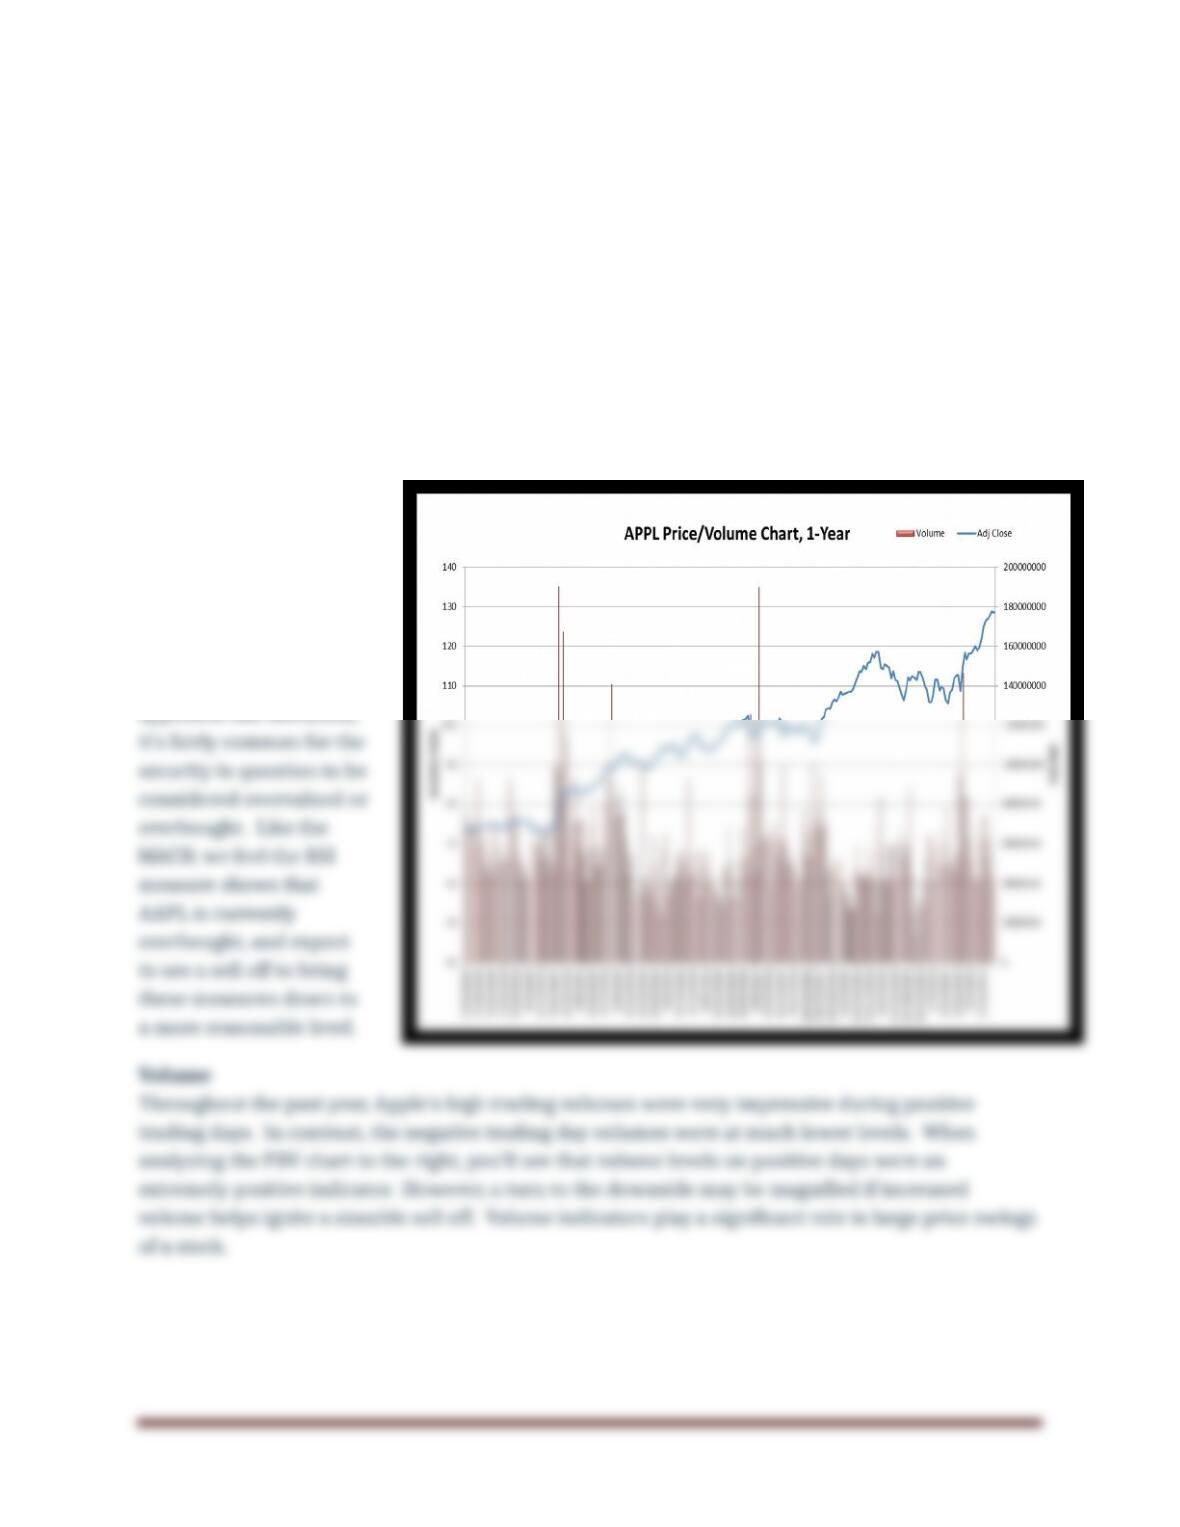
In the chart to the right, the MACD for AAPL is currently around the 1.0 level. The current level
tends to be on the high end, and indicates a security may be overbought. Also, the shorter moving
average, or signal line, has recently pulled away from the MACD. When the MACD breaks below the
signal line, this indicates it may be time to sell a security. This indicator also reinforces Apple being
overbought. In conclusion, the MACD has risen dramatically over the past month, and indicates that
the security may be overbought. We would expect the security to return to normal levels soon via a
healthy sell off.
Relative Strength Index
Due to the nature of the bull market, we have adjusted the RSI range lines up to 40-80. Typically,
you would see assets or
securities trade in
between 30-70, but the
RSI has been relatively
inflated during the recent
run in the market.
Currently, AAPL stock RSI
is sitting around 75.
When RSI levels