1
Economics 101
Spring 2011
Answers to Homework #3
Due Tuesday, March 1
Directions: The homework will be collected in a box before the lecture. Staple your
homework before handing it in. Please place your name, TA name and section number on
top of the homework (legibly). Make sure you write your name as it appears on your ID
so that you can receive the correct grade. Please remember the section number for the
section you are registered, because you will need that number when you submit exams
and homework. Late homework will not be accepted so make plans ahead of time. Please
show your work. Good luck!
1. AGRICULTURAL INTERVENTION
Use the following to answer parts (a) through (e).
Consider the market for pineapples in a small island nation. The domestic demand curve
(in Island Dollars) is P = 60 – 3QD and the domestic supply curve is P = 10 + 2QS.
a. What is the market equilibrium price and quantity?
Solution: Set prices equal and solve to get P = $30 and Q = 10
PRICE CEILINGS AND FLOORS:
b. If the government, hoping to help the poor, imposes a price ceiling of $15, what
will be the shortage of pineapples in the market? Graph your response.
Solution: Plug P=15 into the supply and demand curves to find that quantity
demand at this price is 15 and the quantity supplied is 2.5. The shortage is
therefore 15-2.5 =12.5 pineapples.
c. What price floor would yield a surplus of 15 pineapples?
Solution: Solve both equations for quantity to get:
QD=20-P/3 and QS = P/2-5
With the price floor, we know that QS=QD+15
Plug in our equations to get: P/2-5=20-P/3+15
Solving this gives P = 48.
PRICE SUPPORT PROGRAMS
d. Suppose the government price target is $42, which they plan to accomplish by
use of a price support program. How many pineapples will the government have

2
to buy with this program, and how much will the program cost the government?
Graph your results, and shade the region corresponding to total government cost.
Solution: By plugging P = 42 into the supply and demand curves, we see that
quantity demanded is 6 and quantity supplied is 16. The surplus is thus 10
pineapples, which will cost them $420 to buy at the price of $42 a pineapple.
Your graph should show the surplus as a horizontal line between the points (Q=6,
P=42) and (Q=16, P=42). The total government cost is the rectangle whose top
side is the surplus line and bottom is the Q axis.
PRICE SUBSIDY PROGRAMS
e. Suppose the government offers the pineapple producers a $10 subsidy on every
unit they sell. Graph the new market supply curve. What will the new market
equilibrium quantity and price be with this program? How much does this
program cost the government?
At any given quantity, the supplier can afford to sell at $10 less per pineapple than
before, since they are now getting the extra money from the government. Thus the
new supply curve is shifted down by $10, or
Psubsidized=(original supply price)-$10=2Qs
To find the new equilibrium price and quantity, set 60-3Q=2Q which gives Q=12.
Plug this into the demand curve to see that consumers pay a price of $24 now.
The program costs the government: (subsidy)x(quantity sold) = 10*12=$120
f. What size of subsidy would the government need to provide to attain a target
price of $27?
Solution: At $27, consumers will buy 11 units. Suppliers will only produce 11
units at a per unit price of $32. The government thus needs to cover the
difference, which is $5 per pineapple.
2. TARIFFS AND QUOTAS
Use the following information to answer parts (a) through (d).
Consider the market for lawnmowers in a small country. The domestic demand curve is
P = 100 – (1/10) QD and the domestic supply curve is P = 10 + (1/5)QS.
a. What is the equilibrium market price and quantity, assuming no imports or
exports?
Solution: Q=300, P=70
b. If the government opens up the economy to outside trade, and the world price is
$60, will the country be importing or exporting lawnmowers? How many
lawnmowers will it import or export? Draw this on a graph.
At this price, domestic consumers demand 400 lawnmowers and domestic
suppliers produce 250 lawnmowers. Thus 150 lawnmowers will need to be
imported to cover the difference between the domestic demand and the domestic
supply.
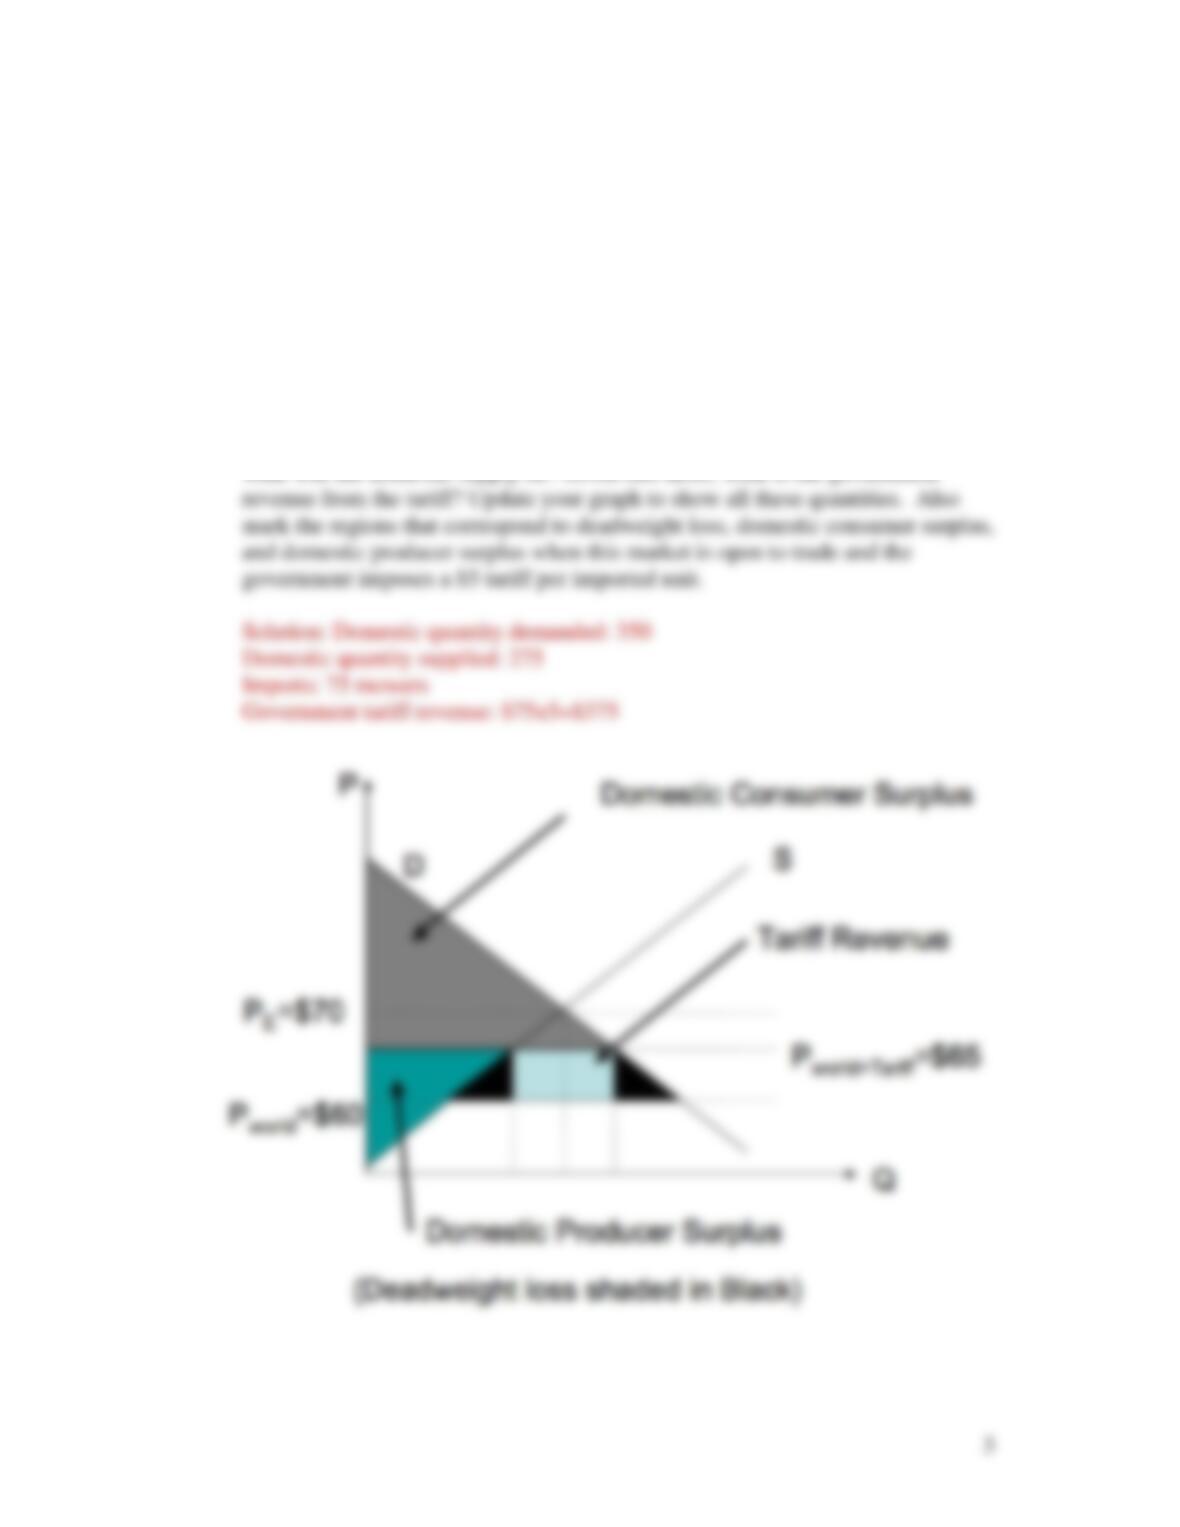
c. Suppose the world price of lawnmowers is $60 and the government opens this
market to trade while at the same it imposes a $5 tariff on each lawnmower that is
imported. Given this tariff, what will the domestic demand be? Given this tariff,