Class 11: Analyzing and Improving
Processes & Quality Mgt

Learning Objectives
Be able to:
•Explain what a business process is and understand that business processes are cross-functional.
•Understand the purposes of mapping processes.
•Be able to recognize four different types of Process Maps and understand the benefits, features, and uses of each.
•Understand various measures companies use to assess performance and be able to calculate simple measures of
Productivity and Efficiency
•Define Business Benchmarking, how it is done, and how it benefits organizations.
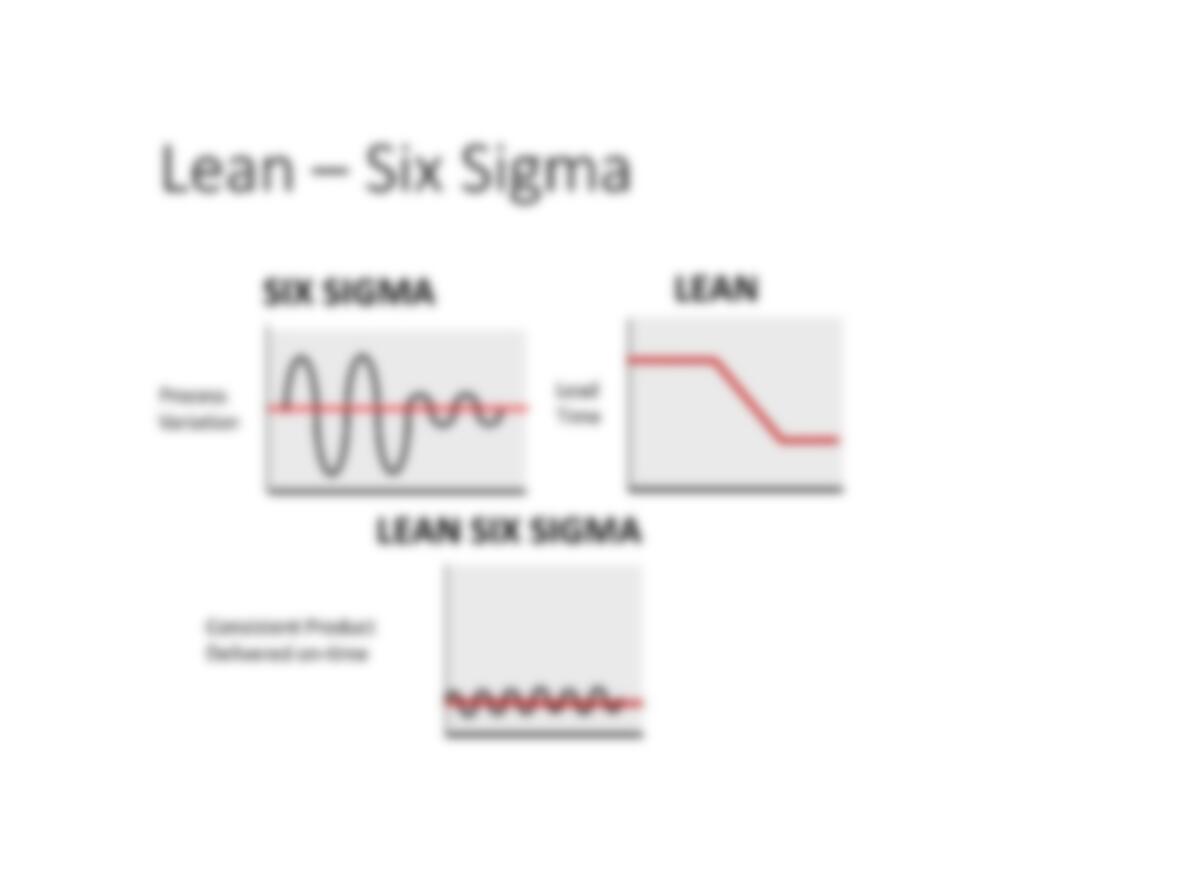
•Understand the purpose and benefits from lean and Six Sigma.
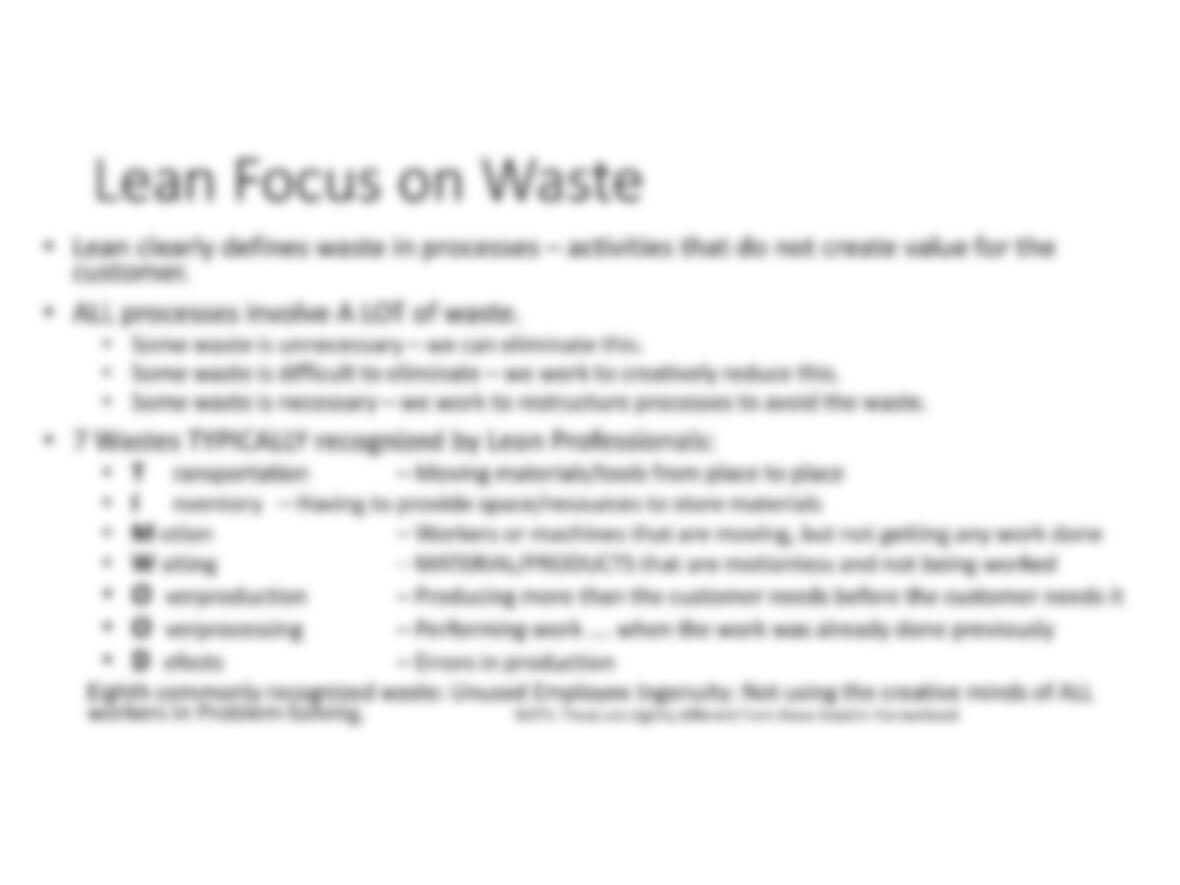
•Discuss the Lean perspective on waste and describe the eight major forms of waste, or muda, in an organization.
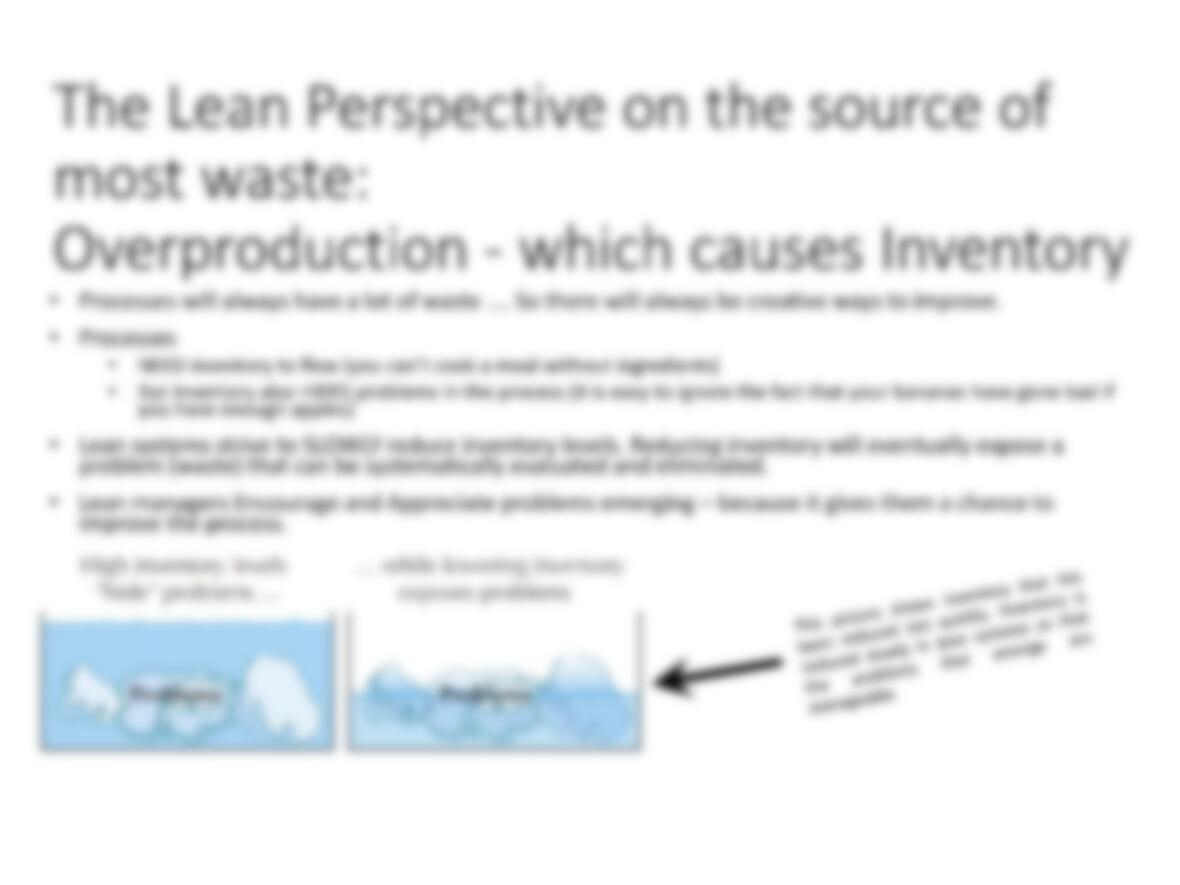
•Discuss the Lean utilizes inventory to expose problems and improve processes.
•Describe several recent developments in Lean Thinking and types of companies that benefit from Lean and Six
Sigma.
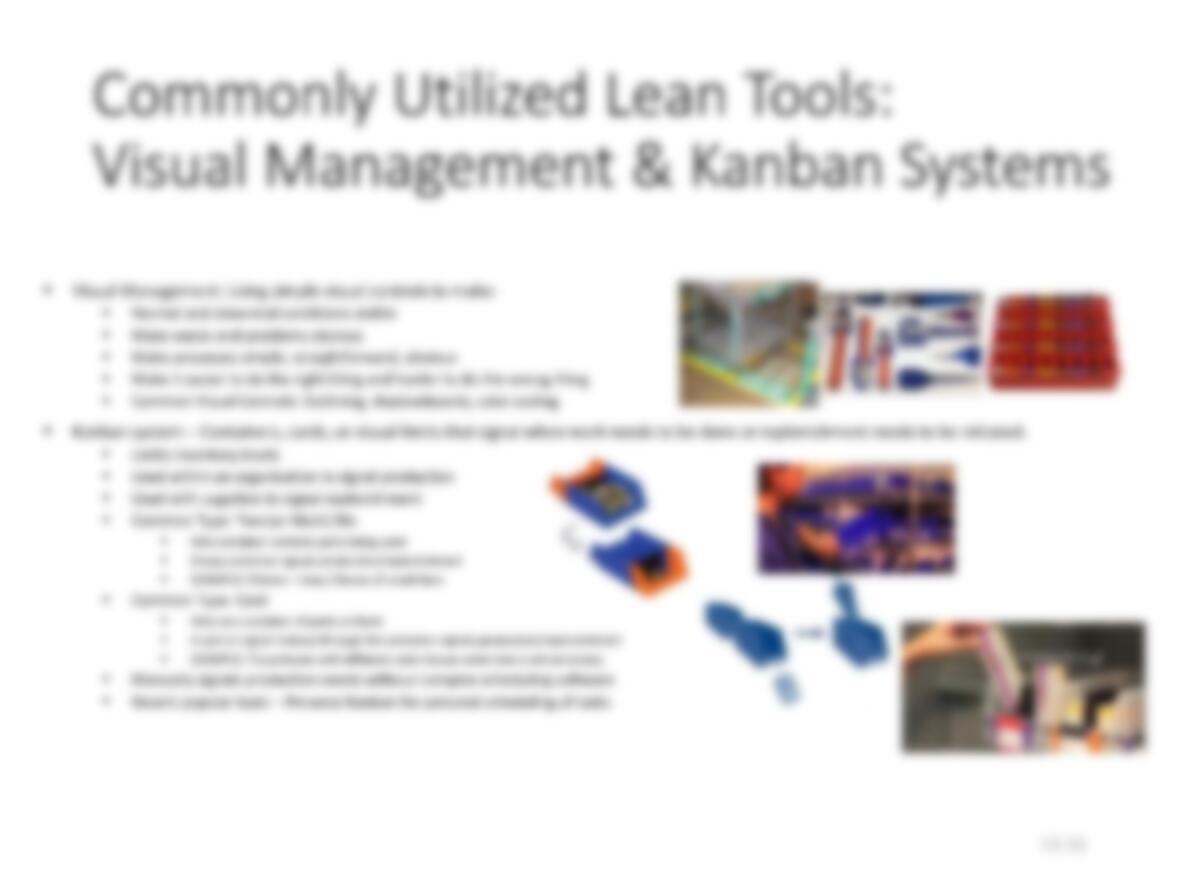
•Explain the benefits, features, and use of Visual Management and Kanban tools.
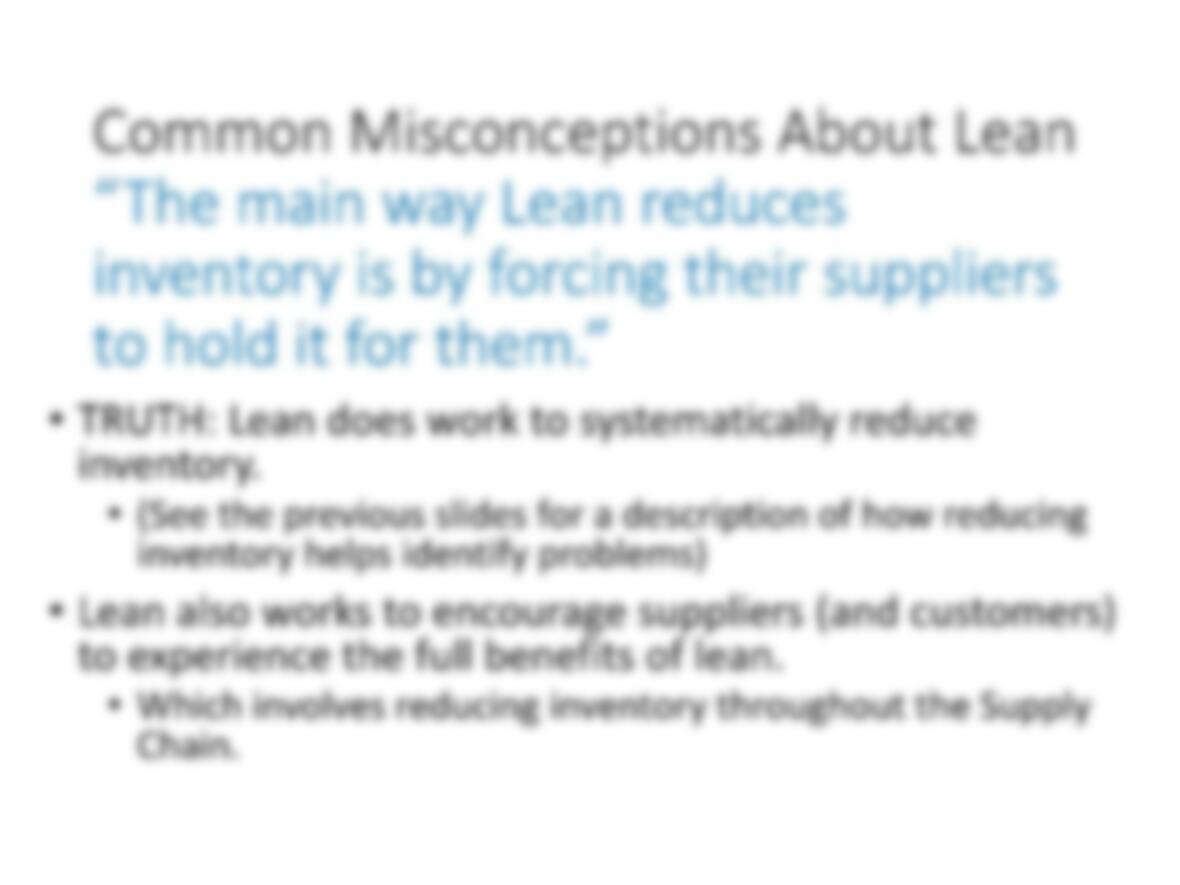
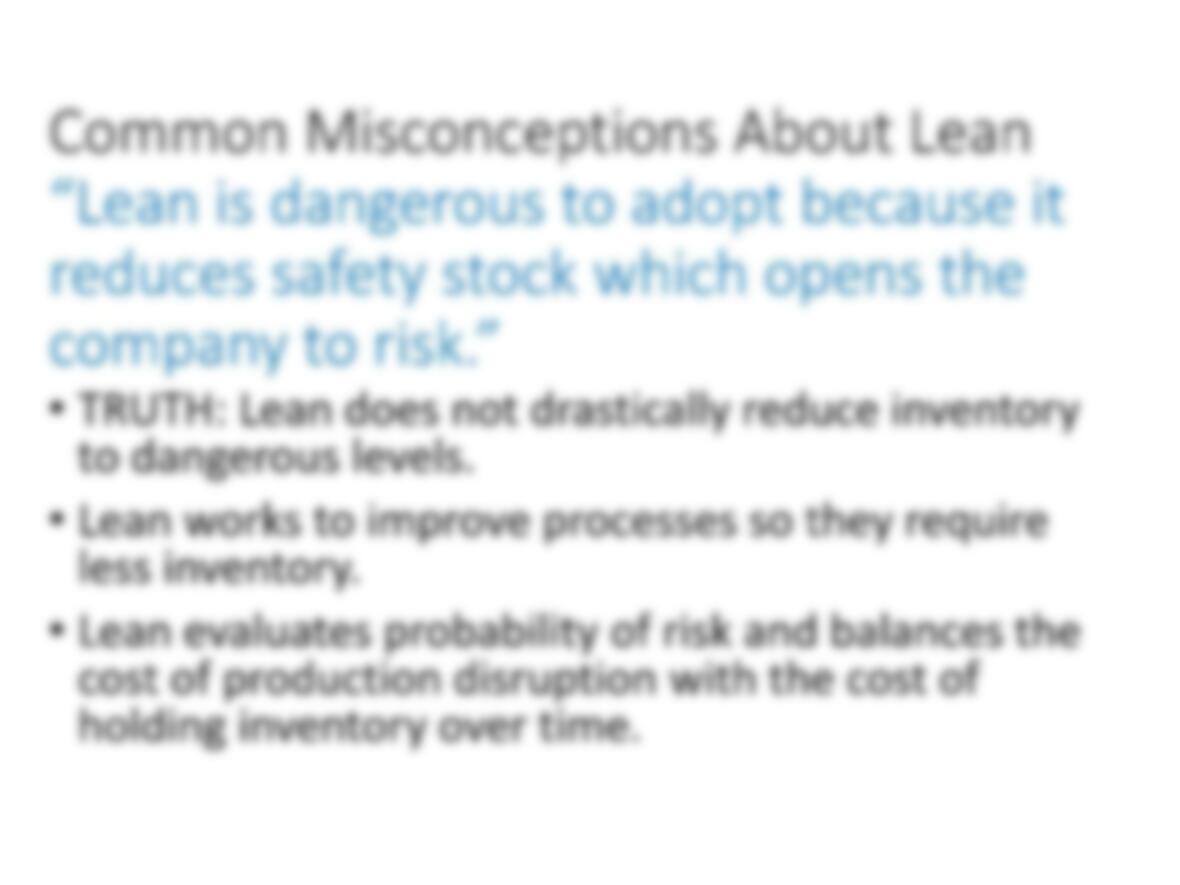
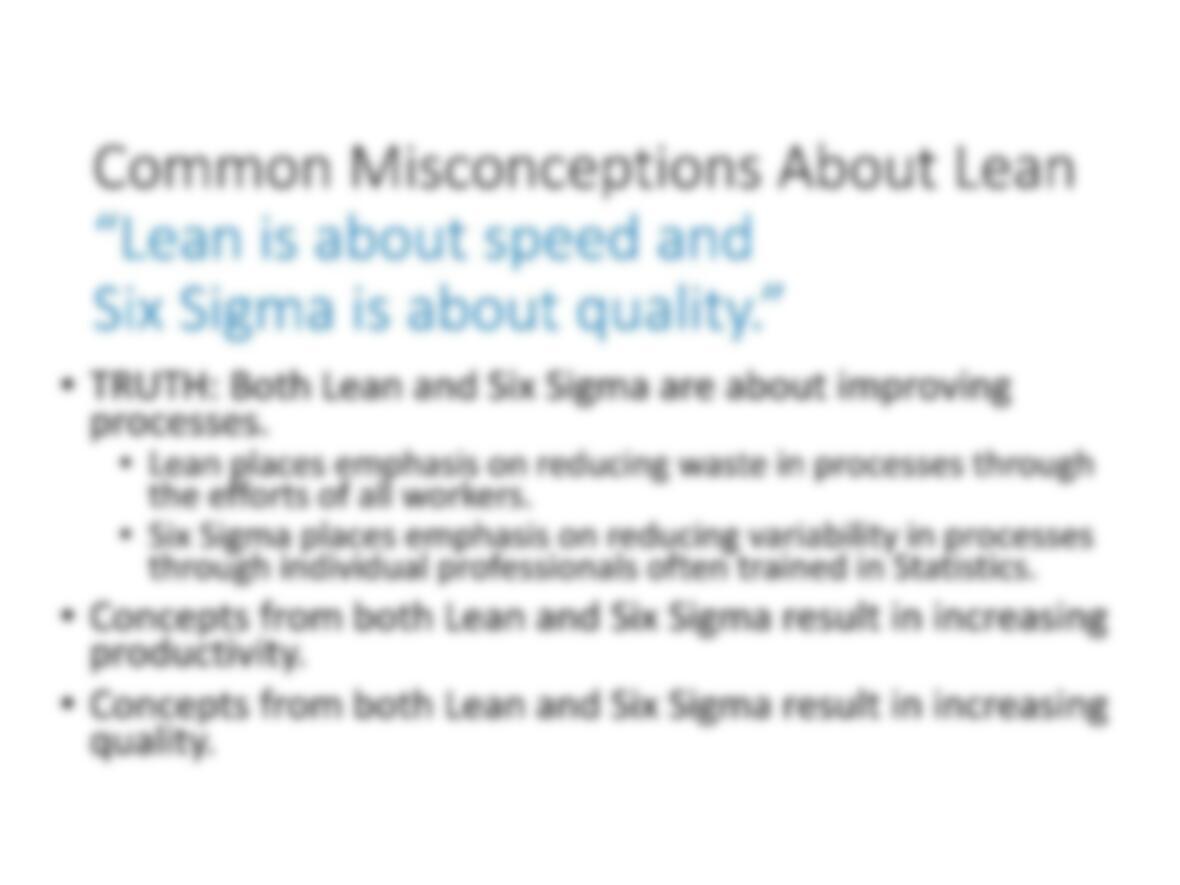
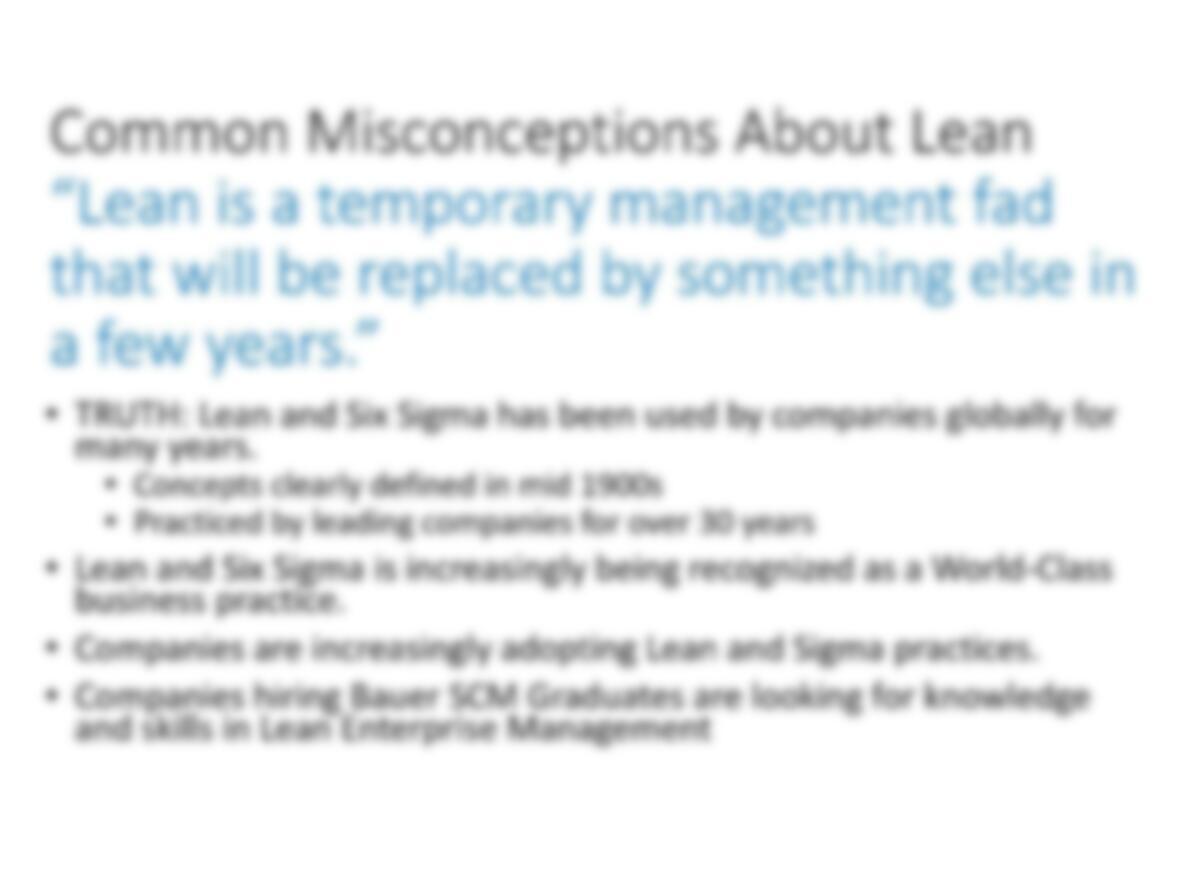
•Be able to argue against several of the common misconceptions people have about Lean and Six Sigma.
Business Processes
▪Process –A set of logically related tasks or activities
performed to achieve a defined business outcome…to
create value for a customer.
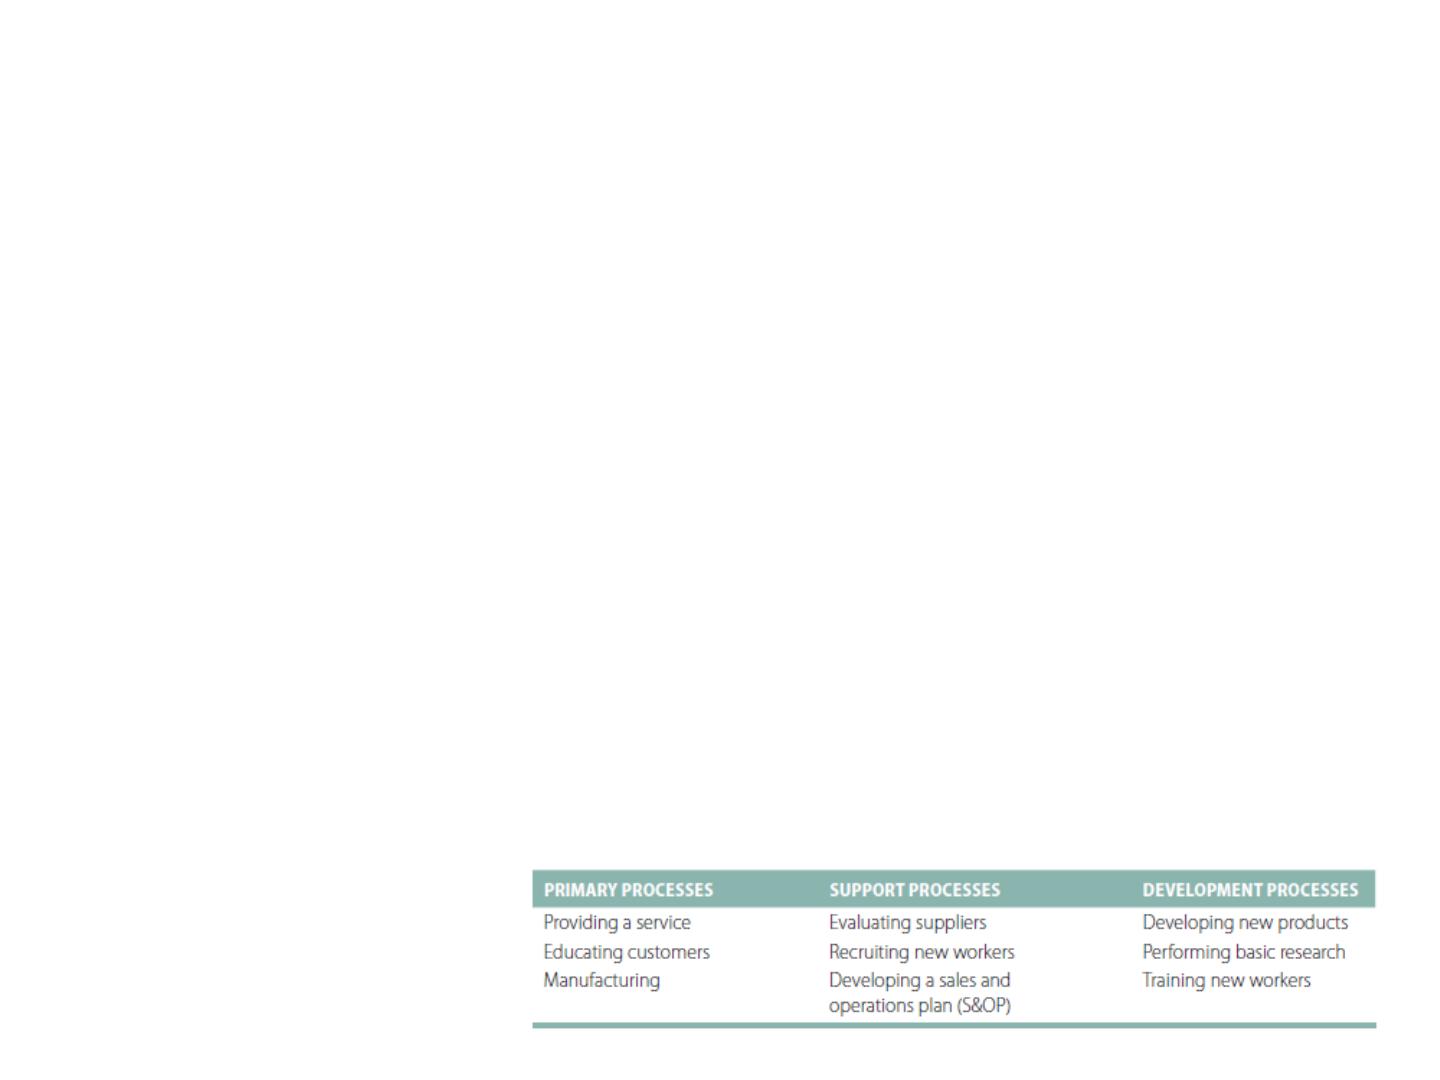
▪Primary process –A process that addresses the main value-added activities of an
organization: Creating value for external customers.
▪Support process –A process that performs necessary, albeit not value-added activities:
Creating value for internal customers.
▪Development process –A process that seeks to improve the performance of primary
and support processes (Process Improvement)
Business processes are Cross-Functional, involving a variety of functions (people)

Mapping Business Processes
•Mapping –The process of developing graphic representations of the
organizational relationships and/or activities within a business process.
•Purposes of Mapping
▪It creates a common understanding of the content of the process: its activities,
its results, and who performs the various steps.
▪It defines the boundaries of the process.
▪It provides a baseline against which to measure the impact of improvement
efforts.
▪It makes the process visible so that people can discuss it, trouble-shoot it,
improve it.
▪It forces people to address what is actually happening in the organization. The
mapping activity itself often highlights problems that can be addressed &
improved.
Types of Process Mapping
•FlowChart Process Map
•Involves a well defined start and finish connected by a variety of
process steps.
•Typically arranged top-down (but may be arranged left to right) to
describe a process from start to finish.
•Usually involves both tasks and options. There may be several
possible paths to get from the start to the finish.
•Used to understand and simplify complex processes.
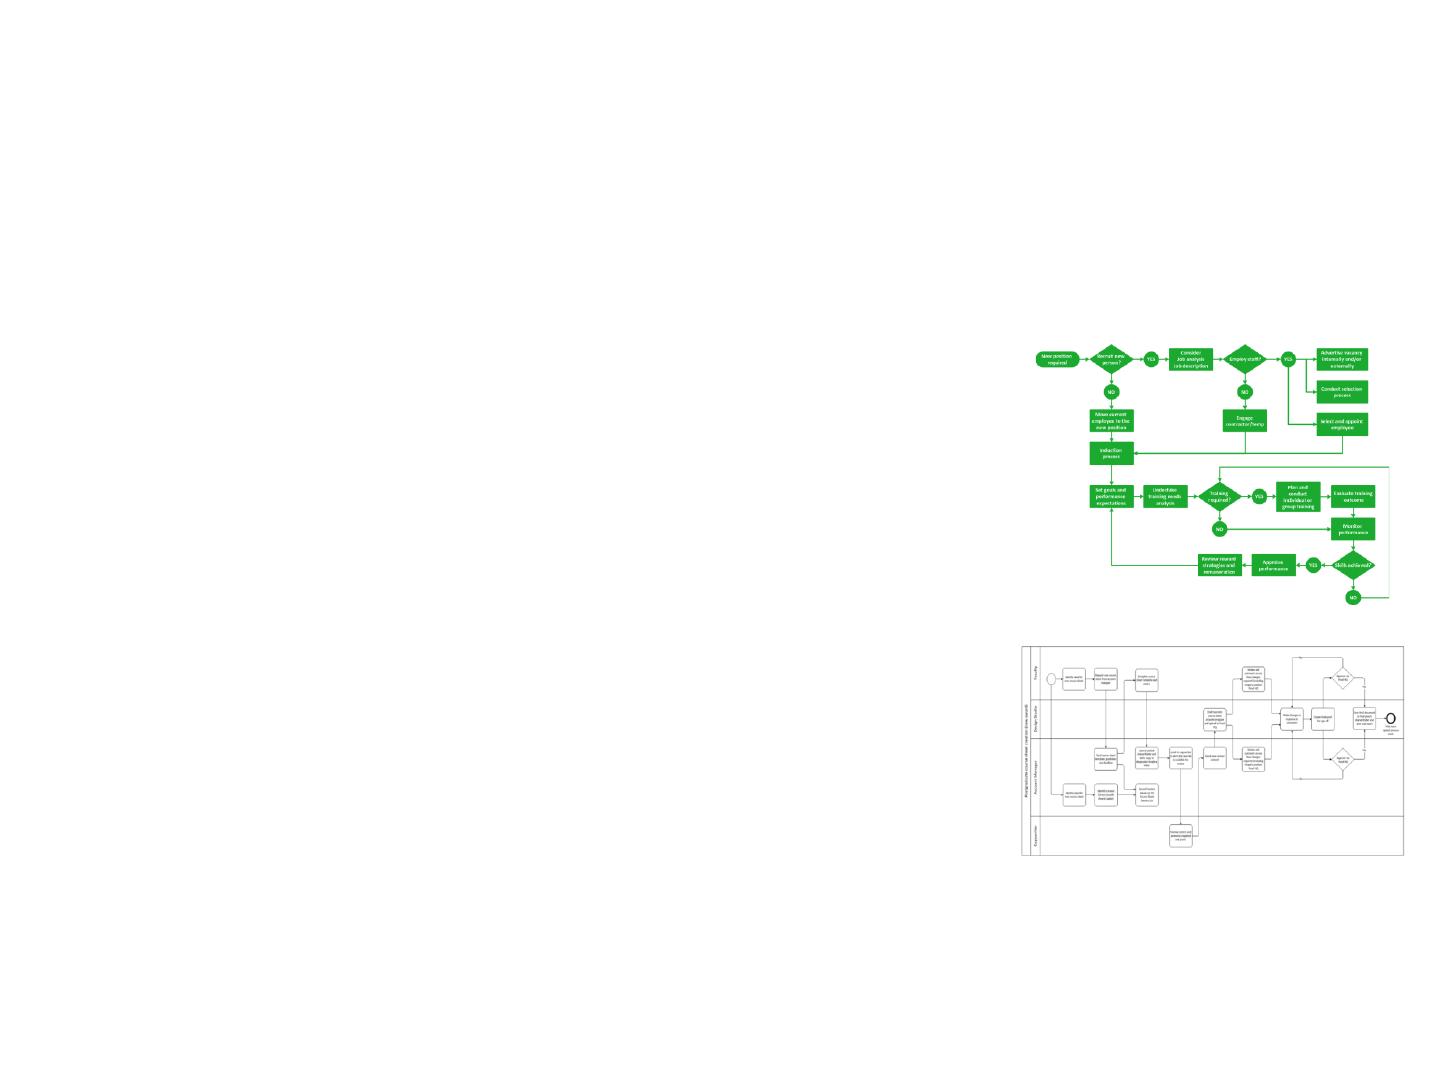
•SwimLane Process Map
•Involves a well defined start and finish connected by a variety of
process steps. Parallel work flows can be clearly seen.
•Typically arranged left to right to describe a process from start to
finish. The SwimLane Process Map is arranged on a timeline. Tasks on
the left must occur prior to tasks on the right.
•The various functions/people/specialties each have a horizontal
“swimlane” within which all of their responsibilities are listed.
•Often used to describe processes that are managed by software.
Types of Process Mapping
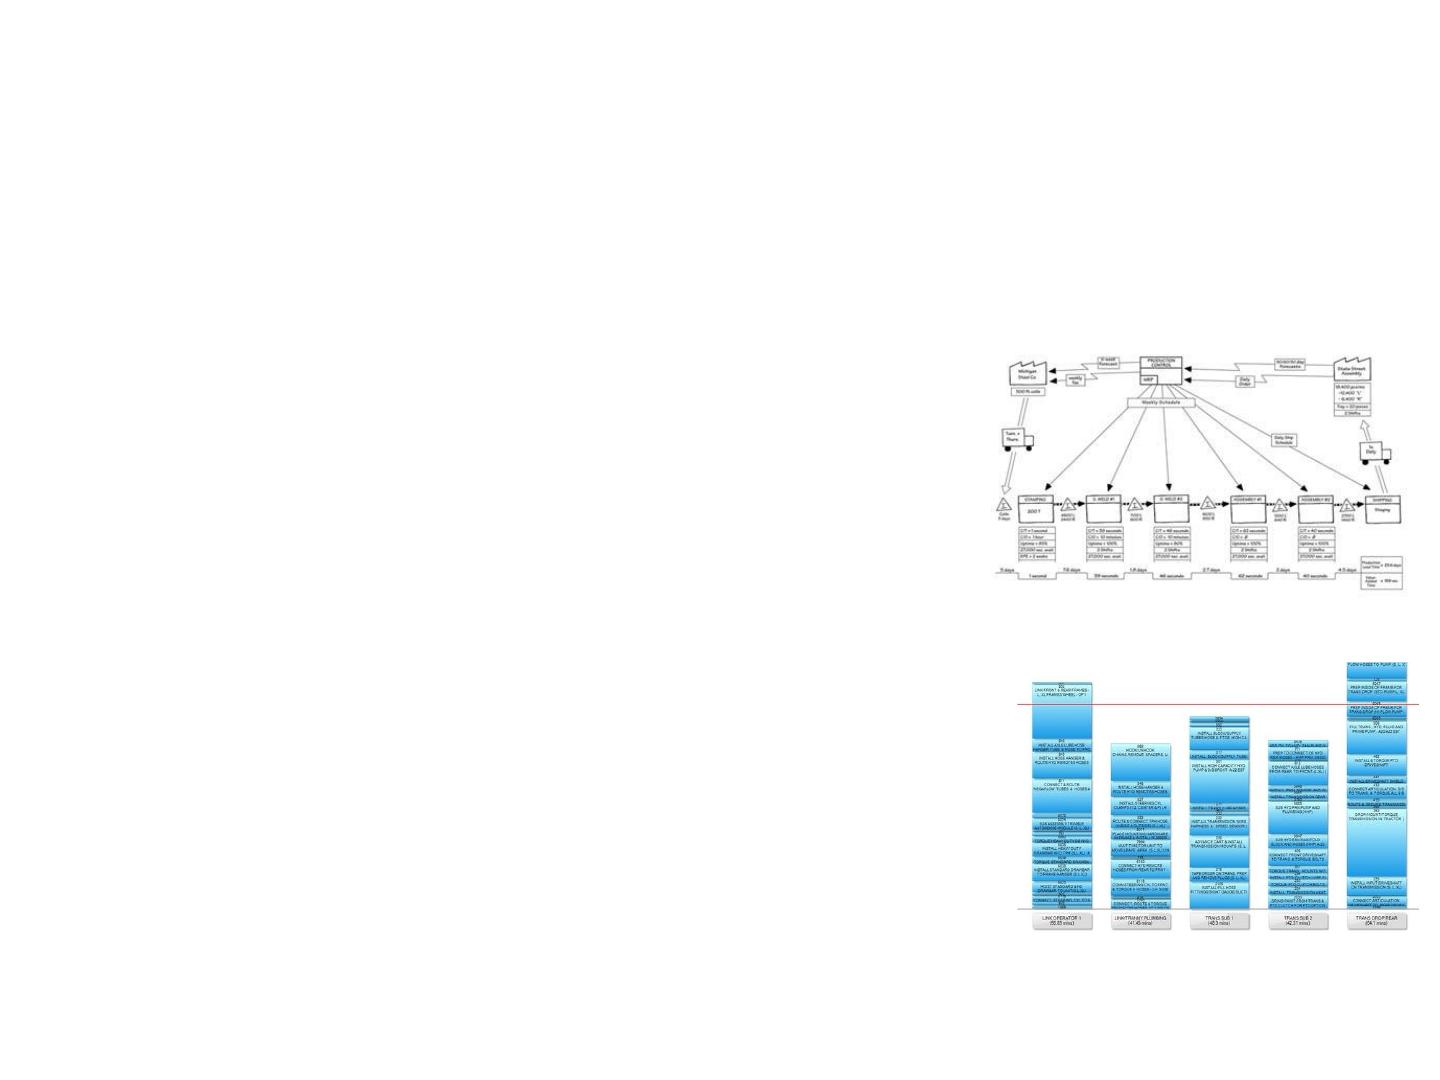
•Value Stream Process Map
•Diagrams the entire creation of value through a company. Each
product category is mapped separately.
•Arranged left to right, starting at raw materials and tracking the
creation of value through to the customer.
•Describes who does the work, in what quantities, the time it takes to
do the work, and delays encountered.
•The top of the Value Stream Map describes how information from the
customer influences the process.
•Used to decrease process delays and waste and to make sure the
process can meet the customer requirements.
•Line Balancing Process Map
•Lists all the individual tasks of all the functions/people involved in a
process.
•Graphically describes how long each function/person takes to
complete a process compared to a target rate for the process.
•Used to “rebalance” the process by changing the responsibilities of
individual functions/people: Allowing overworked functions/people to
transfer some of their responsibility to underutilized functions/people.
4-6
Managing, Measuring and Improving
Business Processes
•Measures of Process Performance –Related to Customer Needs & Desires
•Quality
•Performance, Features, Reliability, Conformance, Durability, Serviceability, Perceived Quality
•Cost
•Labor, Material, Quality-related costs
•Time
•Delivery speed, Delivery reliability