Analysis Report On Air Canada
I am writing an analysis report on Air Canada. I am going to study its audited financial
report for 2014 to decide whether or not to buy it stock.
Air Canada belongs to the airline industry, which seems to be a very stable industry
because the airplane is a critical transportation for travel. But since 2001 the 9/11 Attacks caused
a huge impact on the industry. Besides, in recent years, accidents like disappearance of Malaysia
Airline Flight 370, Germanwings plane crash, and the most recent Air Canada’s Halifax crash
landing would cause the stock price of airlines to drop. This has become a potential risk for the
investors. On top of that, the Canada Transportation Act limits foreign ownership of airlines in
Canada to 25%, which gives a certain limitation for foreign investors ①.
By demonstrating some of the ratio based on Air Canada’s financial report in 2014 and
compare to this year’s data to last year’s, we may know how well the company did in the past
year, and by comparing the ratio of Air Canada in 2014 to another big airline company WestJet,
we may have a better idea of whether the company is worth investing. First, I am presenting the
short term liquidity, which is used to determine a company‘s ability to pay off its short-terms
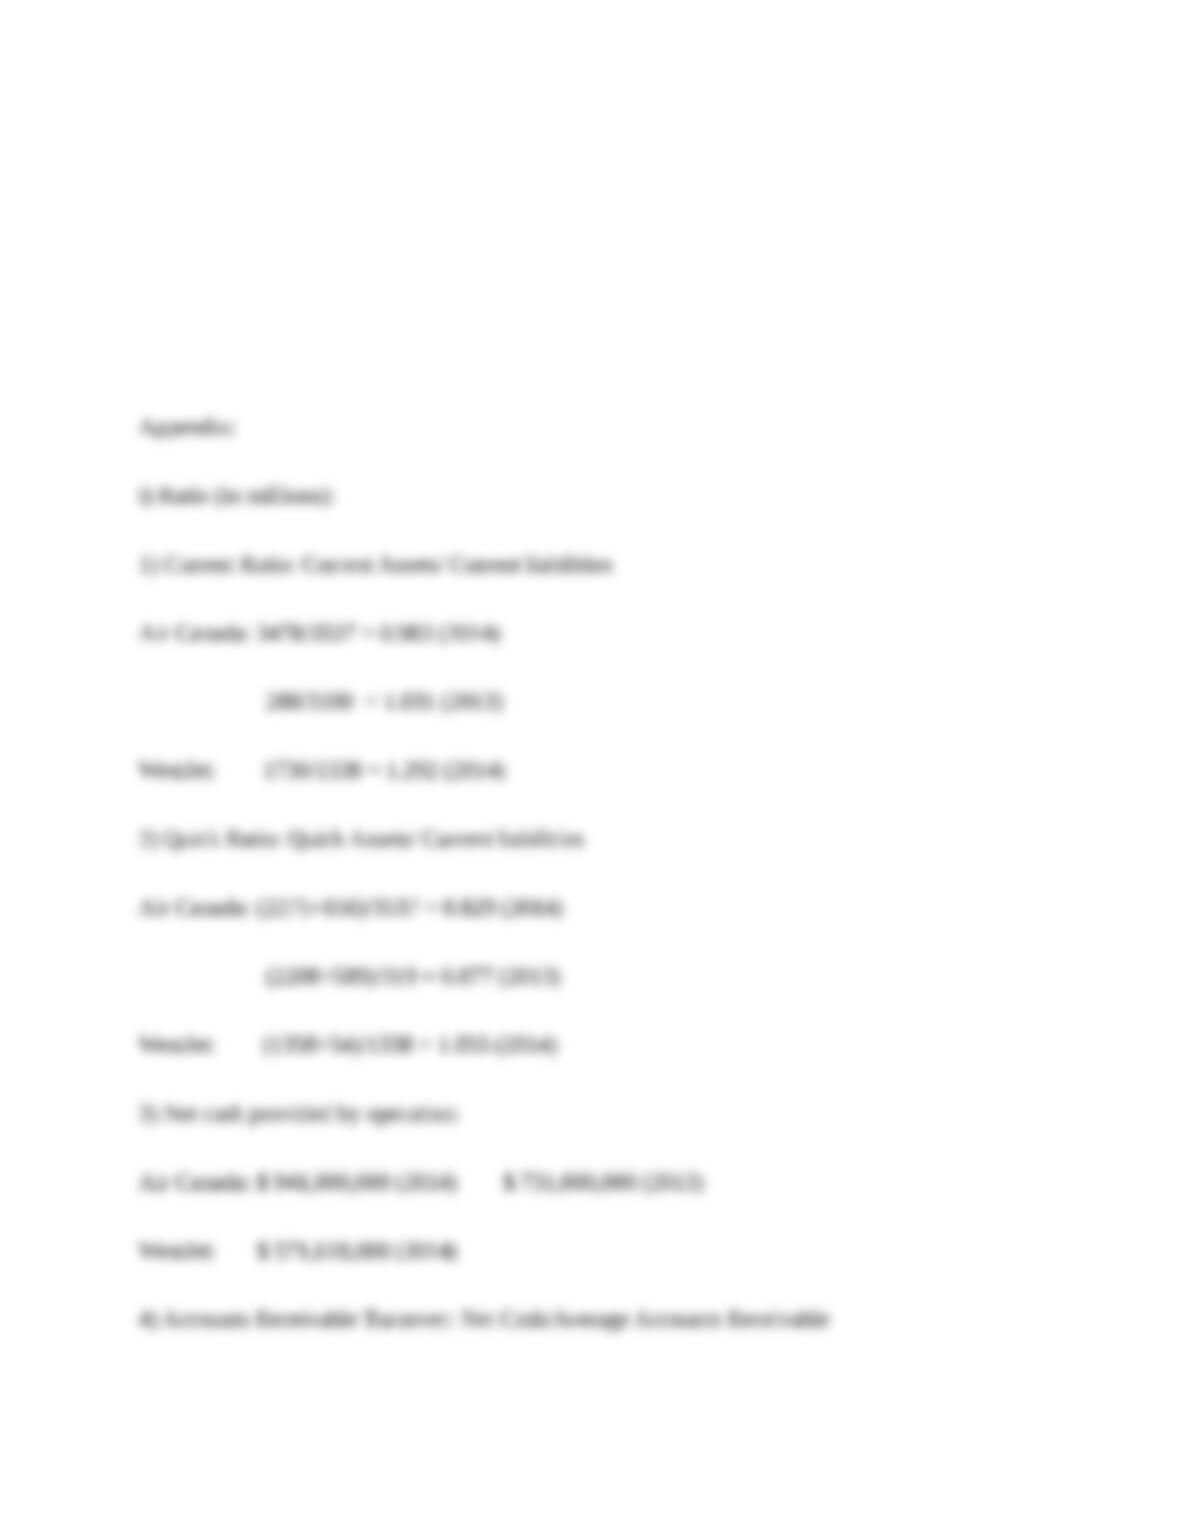
debts. The current ratio of Air Canada in 2014 was 0.983, and in 2013 it was 1.031, while
WestJet had 1.292 in 2014. The quick ratio of Air Canada in 2014 was 0.829, and in 2013 it was
0.877, while WestJet had 1.055. The net cash provided by operation of Air Canada in 2014 was
approximately 941 million, and in 2013 it was 731 million, while WestJet had 571 million in
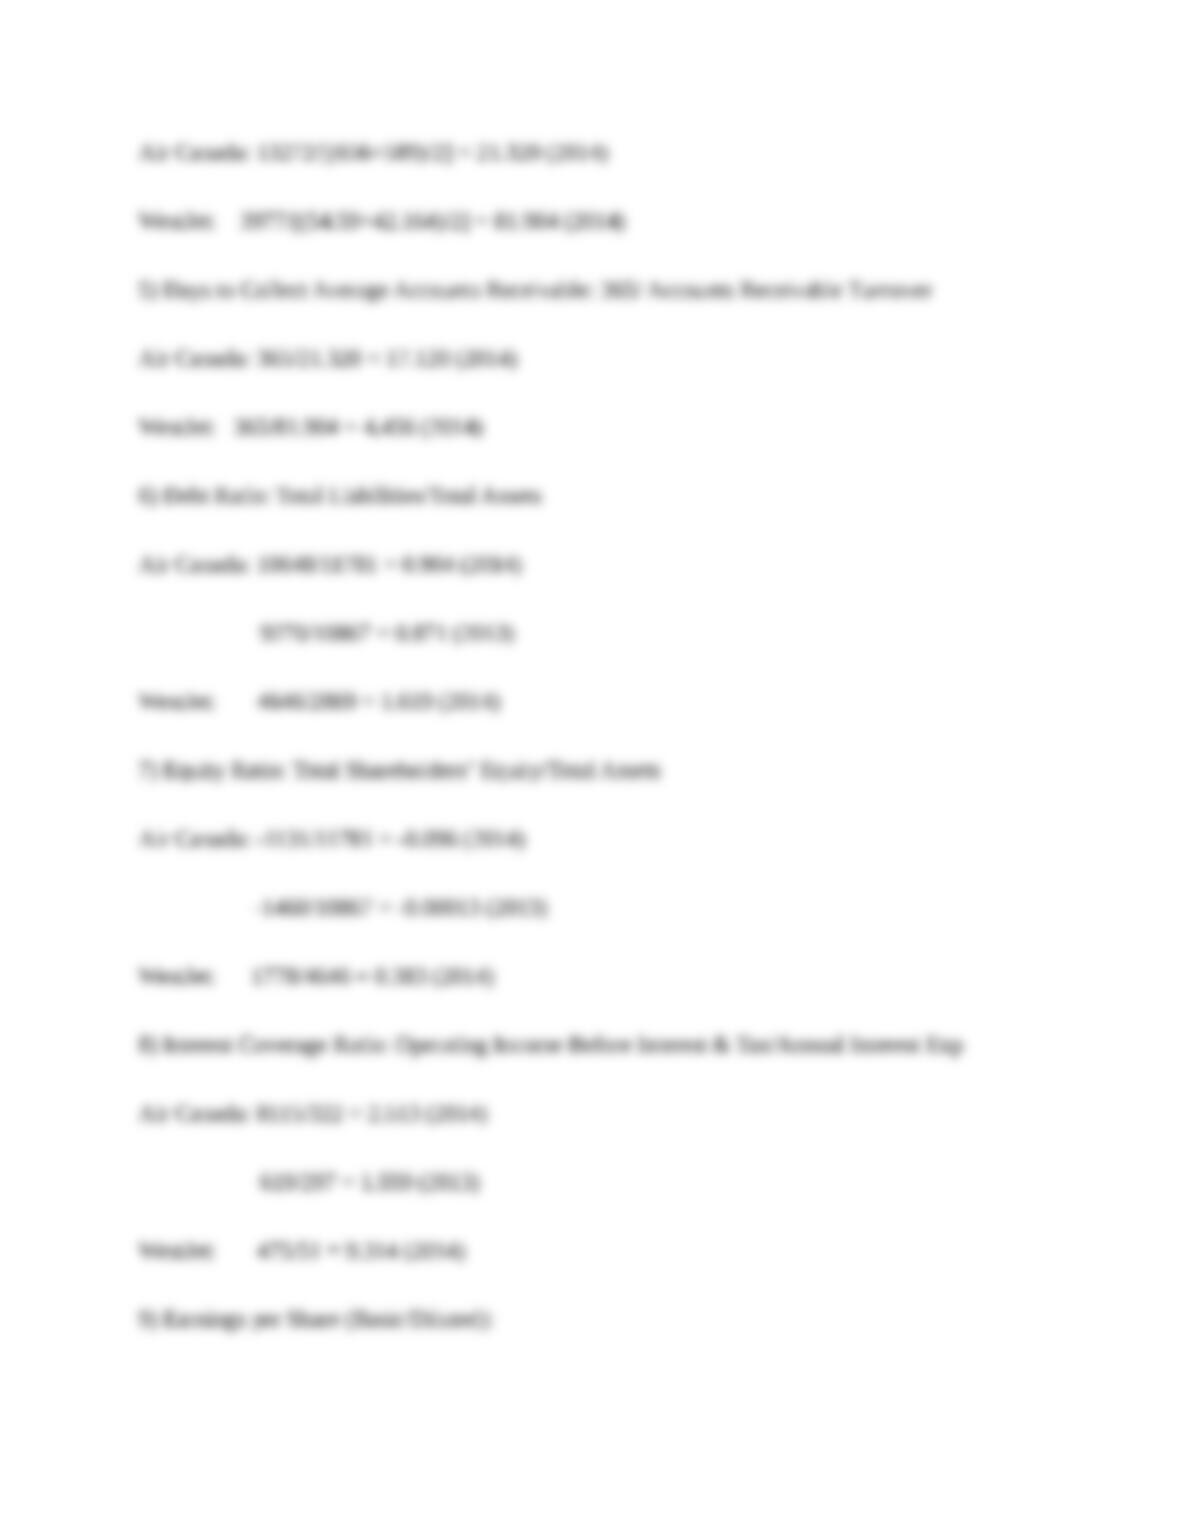
2014. Besides, the accounts receivable turnover of Air Canada in 2014 was 21.32, while it was
81.904 for WestJet. And the days to collect average accounts receivable was 17.12 in 2014, while
it was 4.456 for WestJet. Because we should use the last year’s data in calculating the last two
ratio, we are able to comparing those ratio to it in 2013, which would require data in 2012. The
first two ratios measure a company’s ability to pay off its short-terms debts and obligation, the
third shows how much cash inflow regarding the company’s operating activity, and the last two
measure how efficiently a firm uses its assets. Obviously Air Canada didn’t do very well in the
short term liquidity when comparing the ratio to both the last year’s and the firm’s competitor’s
(except for the net cash provided by operation). So we may say that Air Canada didn’t have a
strong ability in paying its short term debts and obligations. In terms of measures of long term
credit risk, I am comparing the ratio in 2014 to the one in 2013 and the ratio of both Air Canada
and WestJet in 2014. The debt ratio of Air Canada in 2014 was 0.904, comparing to 0.871 in
2013, while it was 1.619 for WestJet in 2014. The equity ratio of Air Canada in both 2014 and
2013 were negative, while it was 0.383 for WestJet in 2014. The interest coverage ratio of Air
Canada in 2014 was 2.531, comparing to 1.559 in 2013, while it was 9.314 for WestJet in 2014.