Analysis of Scientific Data and Information
Introduction
In this assignment, I prepare to use some software to list and analyze
these data. These data will include some common indicators like normal
distribution and make the normal distribution graph. Normal distribution
is very important in mathematics, physics and engineering and other
fields, in many ways, has a statistically significant influence. In addition,
some common and significant feature of these samples(mean, mode,
standard error, standard deviation, confidence-interval(95%) etc. ).At last,
I will use hypothesis to find a relationship between these given samples.
Sample description
Usually people think that adult leg length and height have significant
contact with different height is proportional to the legs. Perhaps this ratio
is not absolute, but there is an appropriate ratio. Here I chose 10 adult
female legs height data for analysis, in order to prove the existence of
such a link.
Here is the data, because lists of words in text mode is not easy to read,
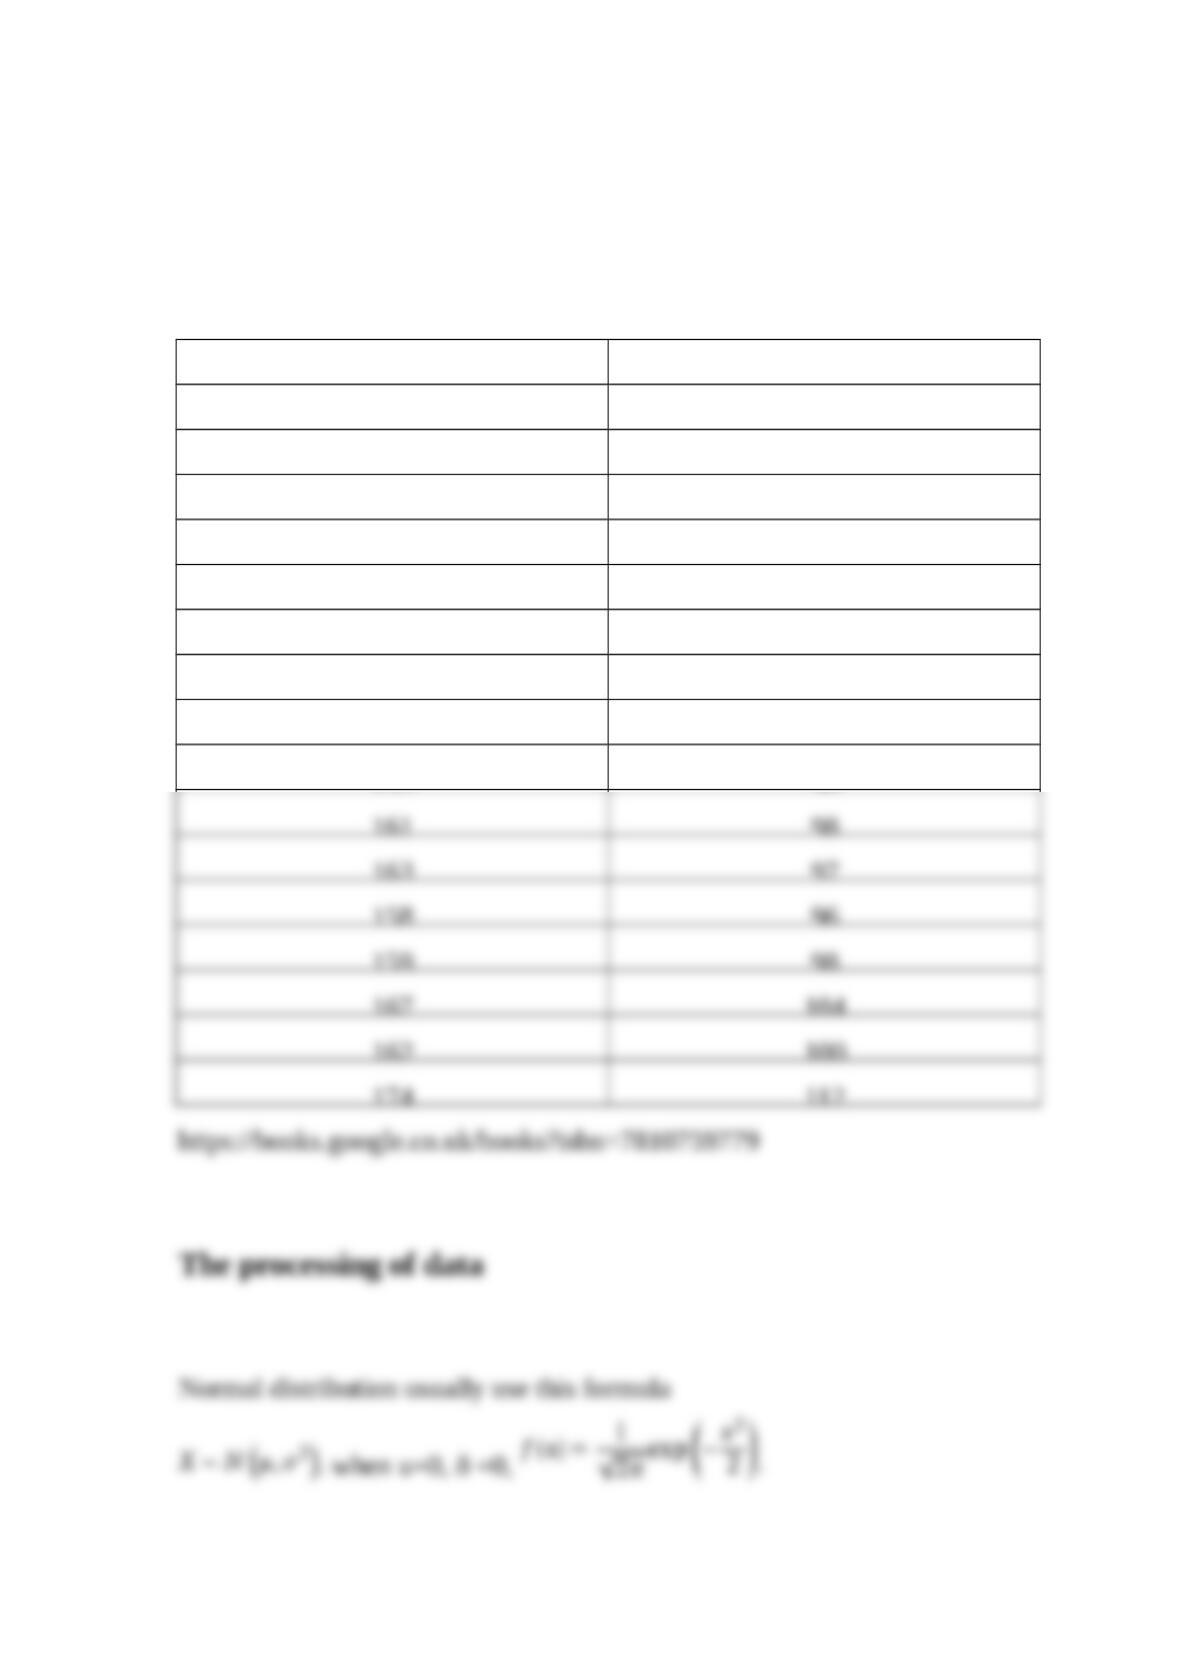
and not easy to establish the corresponding links, so I use EXCEL table
lists these two sets of data.
Adult female height(CM)
Length of their legs(CM)
143
88
149
85
146
88
167
111
159
102
170
117
166
103
157
95
155
96
161
98
163
97
158
96
159
98
167
104
162
100
174
112