Analysis of Beta for Boston Scientific
12/02/2013
Introduction
A stock’s performance has a connection with the market performance. Beta is a number
measuring systematic risks based on how a specific stock’s return co-moves with the
overall market and describing how the return of an asset is predicted by a benchmark. The
company we chose here is Boston Scientific (BSX), in order to measure the performance
of the stock, we used CAPM model to evaluate the beta of the company through regression
analysis in Excel. This report mainly contains three parts, regression analysis for beta and
alpha, determination of cost of equity and beta estimation.
Determination of Beta
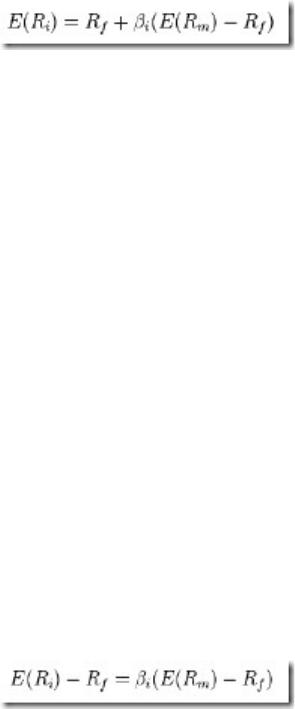
The capital asset pricing model (CAPM) is defined as below,
Where is the expected return, I found 251 weeks of the company’s last price and dividend
from Bloomberg, from 1/9/2009 to 10/25/2013. Because Boston Scientific does not pay
any dividend during that time, simply using the last price for each week, we could compute
the expected return of BSX for each week from 1/16/2009 to 10/25/2013.
E(Rm) is the expected return of market, which also represents the benchmark. Here we
chose S&P 500 index from the same time point. Using the last price and dividend
information found in Bloomberg, we could compute the expected return of the market.
As for Rf, the risk-free rate, we got 4-weeks weekly Treasure-Bill of the same time period
from FRED.
To analyze the beta by regression, we changed the formula by following
E(Rm) – Rf, the excess return of S&P, which is also known as risk premium on the market,
represents independent variable X. , the excess return of the BSX stock, which is also
called risk premium of the stock, represents dependent variable Y. The β, the coefficient, is
the slope of this model.

Then we used the simple regression model to find the slope. And the beta for BSX we
computed with Excel is 1.114.
According to the result, β>1, which indicates that, to some degree, the movements of BSX
stock is in the same direction , and slightly more than the movements of the market, we
could generally conclude that the performance the BSX is correlated with the market and
the health of the whole economy.
We also found the beta index directly from Bloomberg and Value Line. The beta from
Value Line is 1.00, the reason of the difference between the beta from Value Line and the
beta we computed is more likely due to the different time point. We only used 250 weeks