An Assessment of Competition and Consumer
Choice in Today’s U.S. Airline Industry
Daniel M. Kasper and Darin Lee, Ph.D.
June 26, 2017

2
Assignment
We have been asked by Airlines for America (“A4A”) to provide an
independent economic assessment of the current state of airline
industry competition and consumer choice for U.S. air travelers.
Our analysis relies on a variety of publicly available data and
information sources, including:
Data from various U.S. Department of Transportation (“DOT”) databases,
including the Origin & Destination Survey (“DB1B”), Form 41, On-Time
Performance and T-100 databases.
OAG schedule data.
SEC filings, news releases and other publicly available airline industry
information sources.
Published academic research.

3
Summary of Findings
An analysis using established criteria for assessing airline industry
competition demonstrates that there is robust competition in the U.S.
airline industry. In particular:*
U.S. consumers currently enjoy a wide array of choices among competing
airlines and products.
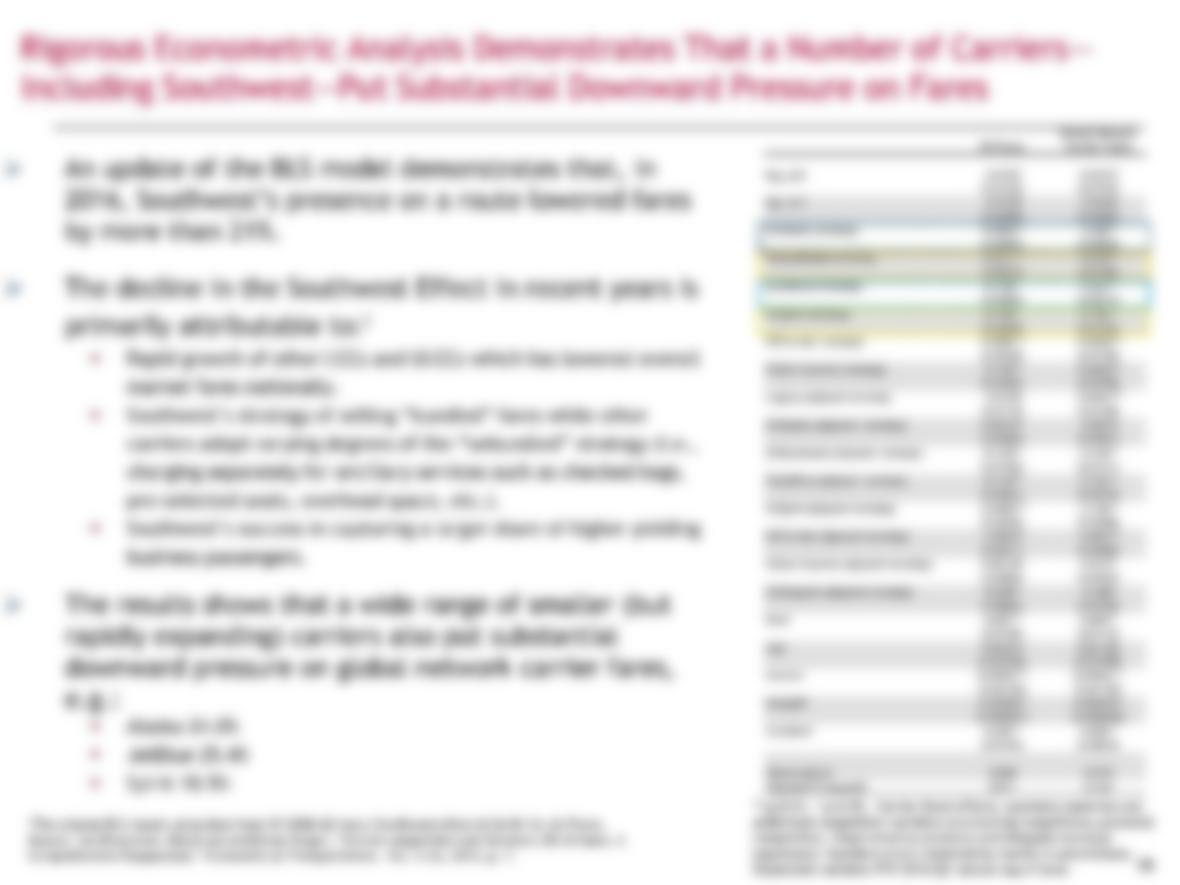
The “Southwest Effect” is alive and well and there are now several rapidly
growing carriers that substantially lower fares in the markets in which they
compete.
Robust competition spurred by both the continued growth of lower cost
carriers and the expansion by all carriers at competitors’ hubs has resulted in
fare levels among the lowest in U.S. aviation history.
Following external shocks that severely impeded the economics of serving
small communities, service at small airports has been growing.
Improved financial health has enabled U.S. carriers to invest heavily in their
products and services, create thousands of well-paying airline jobs, and
substantially increase compensation levels for airline employees.
The U.S. airline industry’s operational performance and customer
satisfaction levels are at all-time highs.
*The opinions expressed in this presentation reflect the views of the authors and do not necessarily reflect the views of Compass Lexecon or its
other experts. This study was commissioned by Airlines for America.

4
1. U.S. Consumers Currently Enjoy an Abundance of
Choices for Air Travel at Some of the Lowest
Prices in History
5
Overall, the Average Number of Competitive Choices for Air Travel Has
Increased Over the Past Two Decades
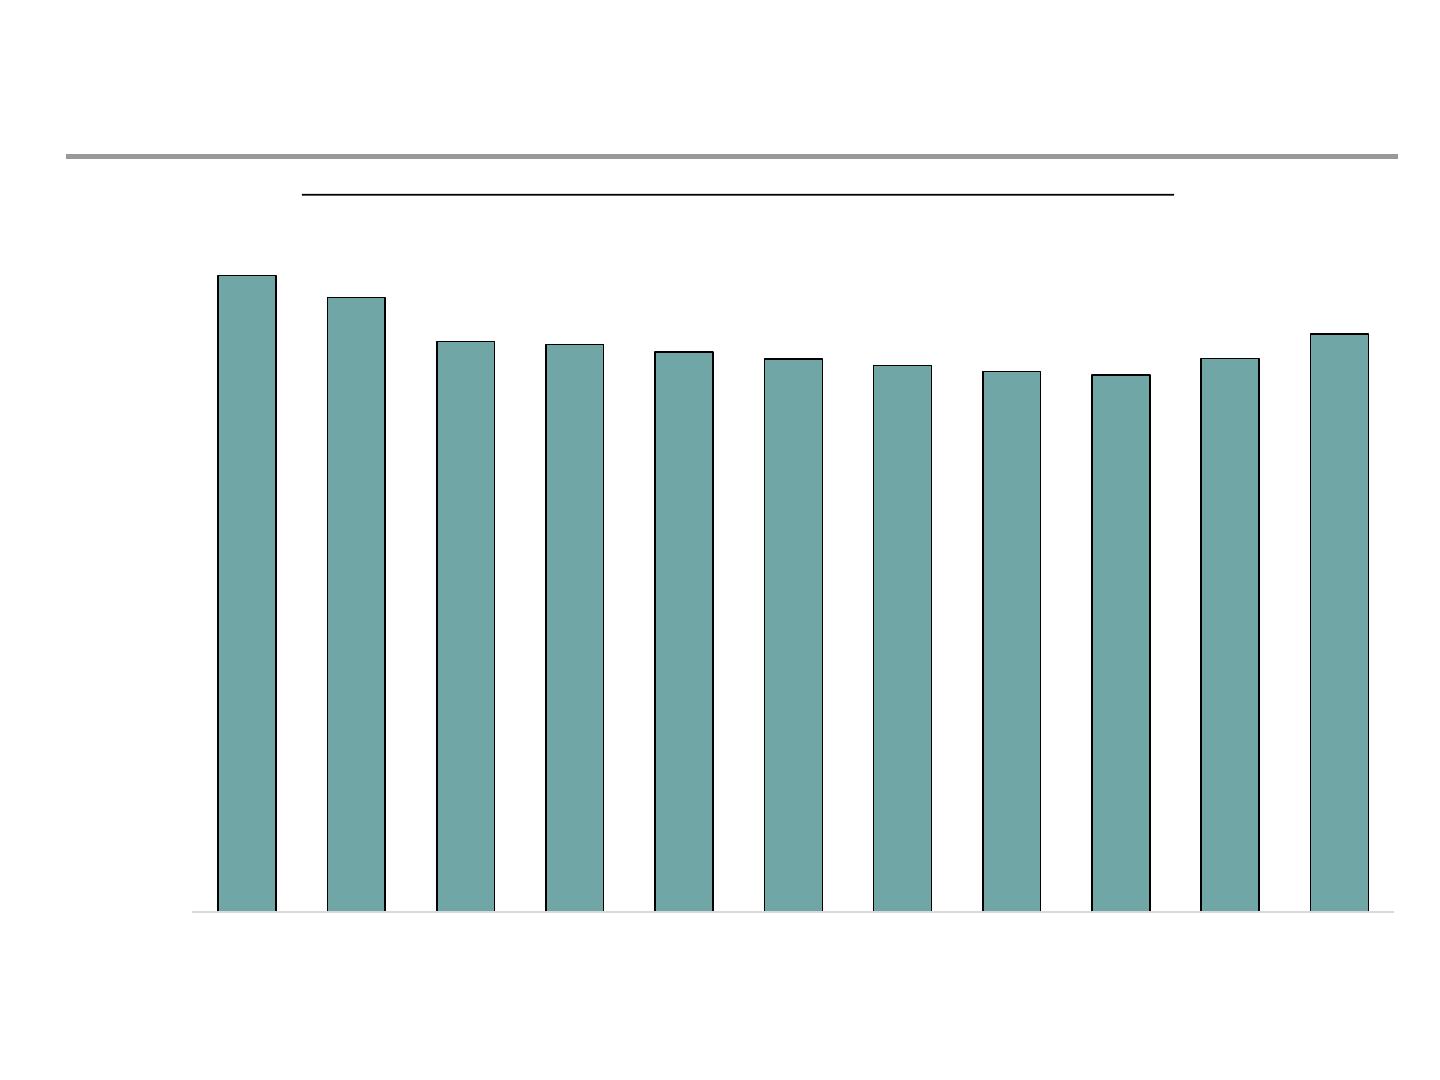
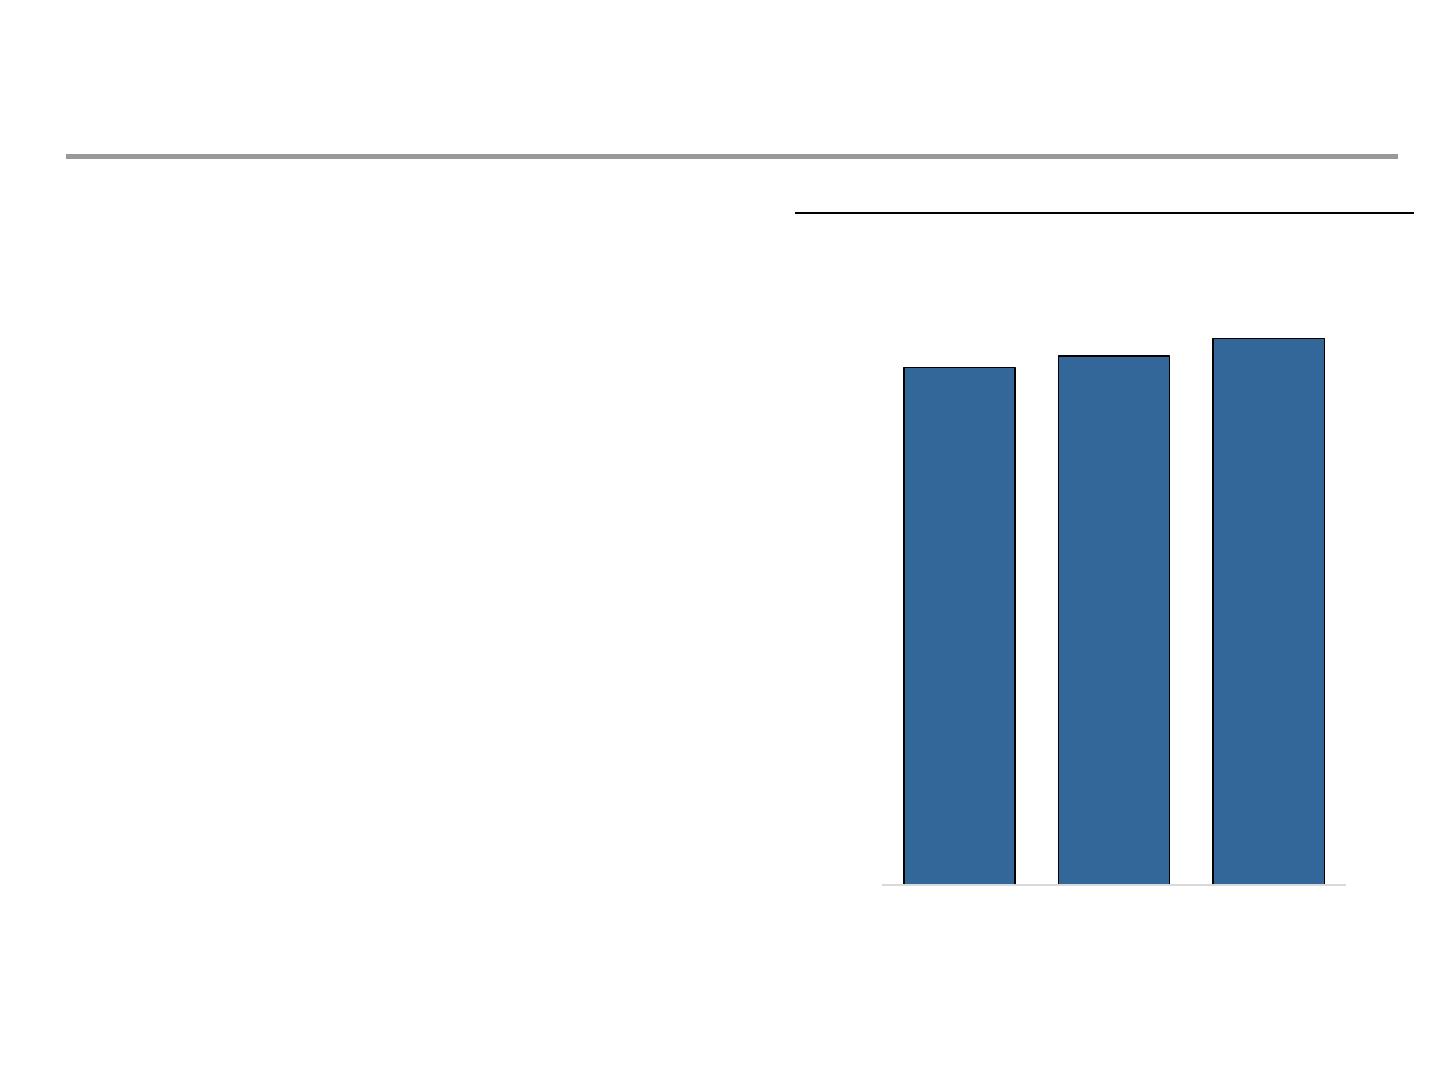
The average number of competitors per
city-pair has increased consistently for
almost two decades.
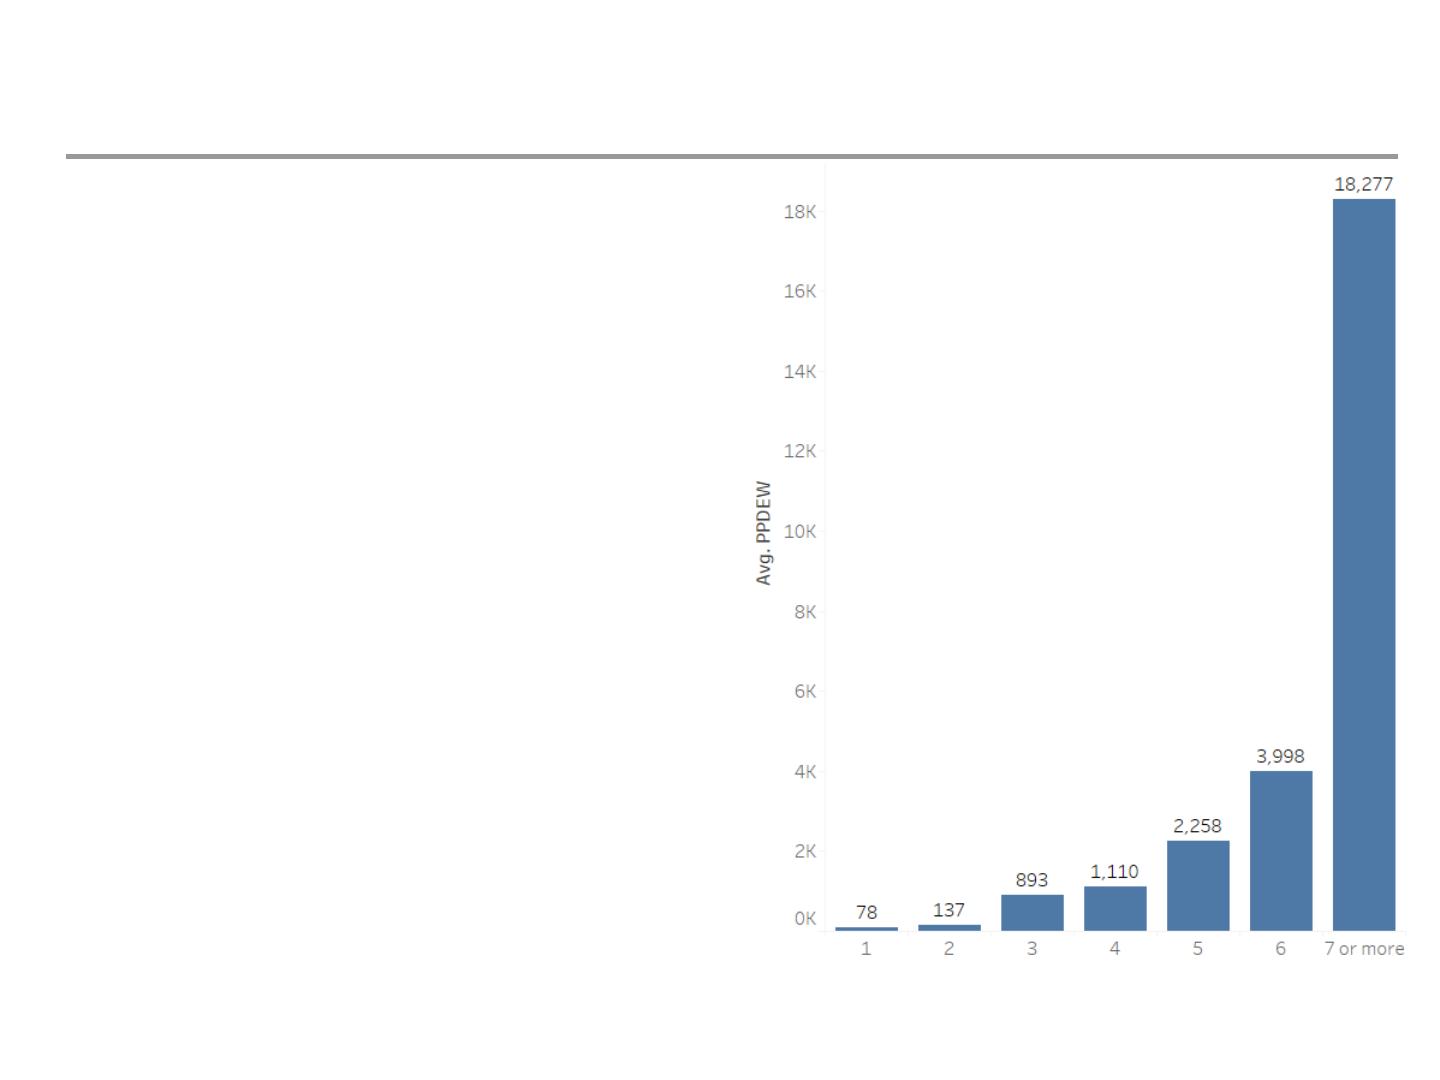
For example, between Dallas and New York, a
market with close to 3,000 passengers per day
each way (“ppdew”), the number of
competitors increased from two to five
including the addition of two low cost carriers.
Similarly, between Austin and Los Angeles (over
800 ppdew), the number of competitors
increased from three to five (including two low
cost carriers one of which is new).
Simply put, the lack of entry barriers has
made it easy for all carriers−including low
cost and ultra low cost carriers−to continue
entering and expanding into more city-
pairs.
Average Number of Competitors on U.S. Domestic City-Pairs
Sources: U.S. DOT DB1B Database.
Notes: A carrier is defined as a competitor on a city-pair if it has at least 5% of O&D passengers. Average number of competitors is weighted across city-pairs by
passengers. Airports in the following metropolitan areas are grouped: Chicago (ORD, MDW), Cincinnati (CVG, DAY), Cleveland (CLE, CAK), Dallas (DFW, DAL), Houston
(HOU, IAH), Los Angeles Basin (LAX, BUR, LGB), Miami (MIA, FLL), New York (LGA, JFK, EWR), San Francisco/Bay Area (SFO, OAK), Washington DC/Baltimore (DCA, IAD,
BWI), and Tampa (TPA, PIE).
3.3 3.4 3.5
0.0
0.5
1.0
1.5
2.0
2.5
3.0
3.5
4.0
2000 2007 2016
Avg. Number of Competitors
6
The Number of Competitive Choices per City-Pair Remains
Robust Across Cities of All Sizes
Sources: U.S. DOT DB1B Database; T100; FAA (https://www.faa.gov/airports/planning_capacity/passenger_allcargo_stats/categories/).
Notes: Bars show average number of competitors per city-pair where one end of each city-pair includes cities in that size category (based on 2007 enplanements). A carrier is defined as a
competitor on a city-pair if it has at least 5% of O&D passengers. Average number of competitors at each city is computed as the passenger-weighted average of competitors on all city-pairs
from that city. Average number of competitors for each city size is calculated as the simple average across cities in a size category. City categories are based on 2007 enplanements with:
Large Cities greater than 1% of U.S. enplanements, Medium Cities greater 0.25% of U.S. enplanements, Small/Nonhub less than 0.25% of U.S. enplanements and more than 10,000 annual
enplanements. Size cutoffs based on FAA airport size definitions. The following airports are grouped into cities: Chicago (ORD, MDW), Cincinnati (CVG, DAY), Cleveland (CLE, CAK), Dallas
(DFW, DAL), Houston (HOU, IAH), Los Angeles Basin (LAX, BUR, LGB), Miami (MIA, FLL), New York (LGA, JFK, EWR), San Francisco/Bay Area (SFO, OAK), Washington DC/Baltimore (DCA, IAD,
BWI), and Tampa (TPA, PIE). All other cities are individual airports.
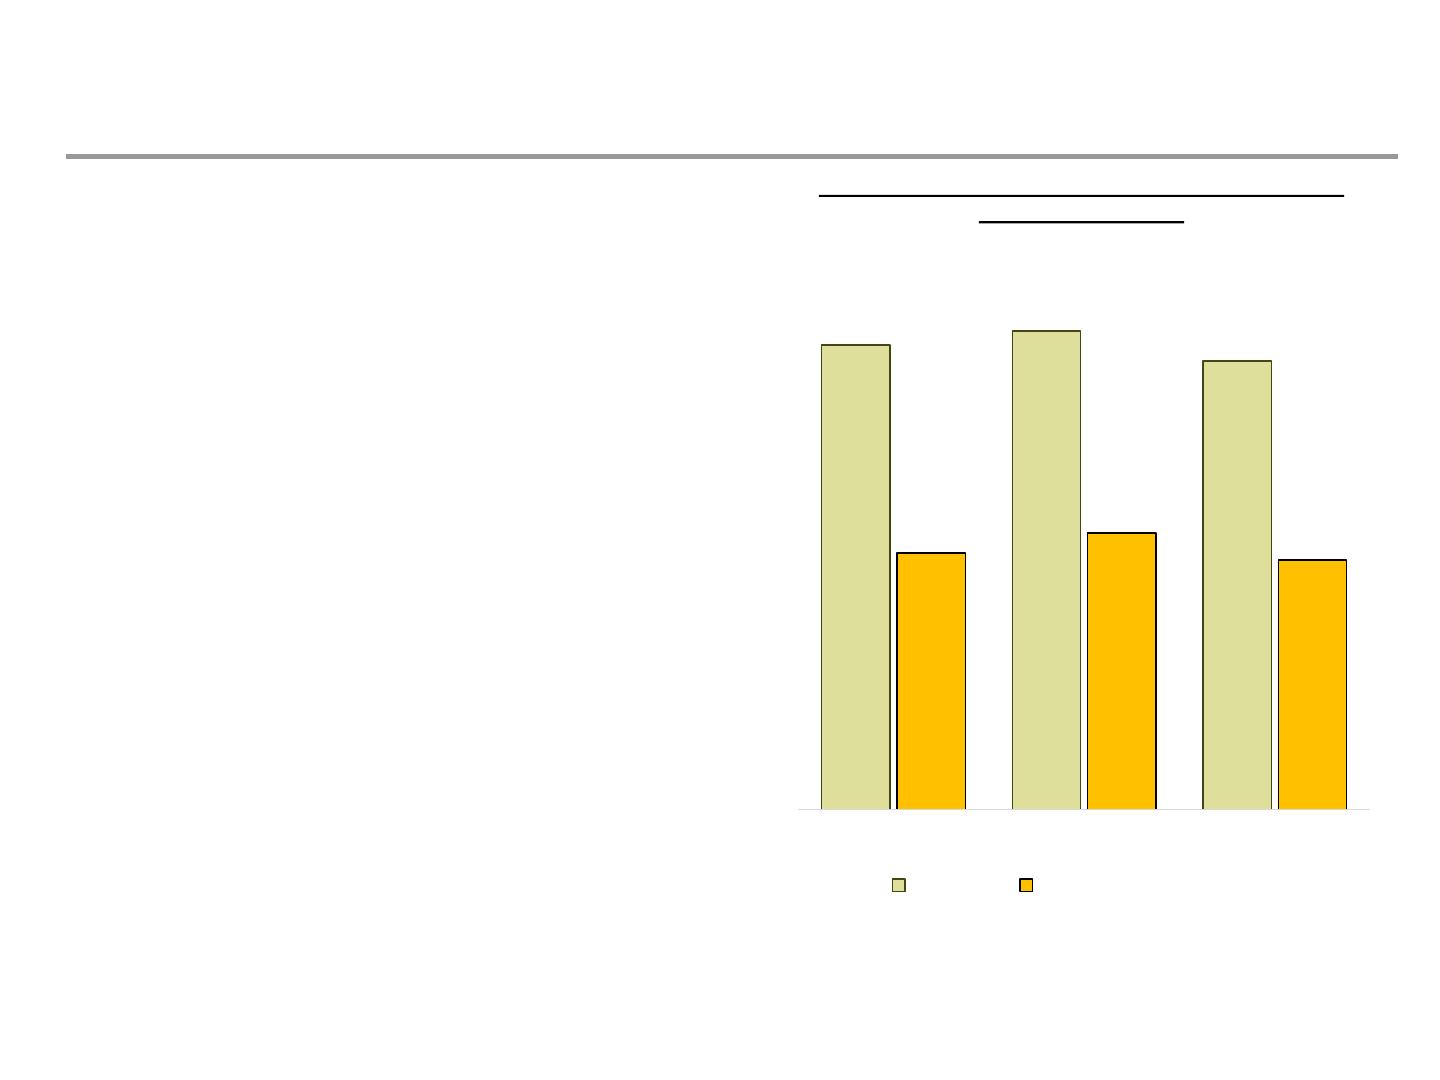
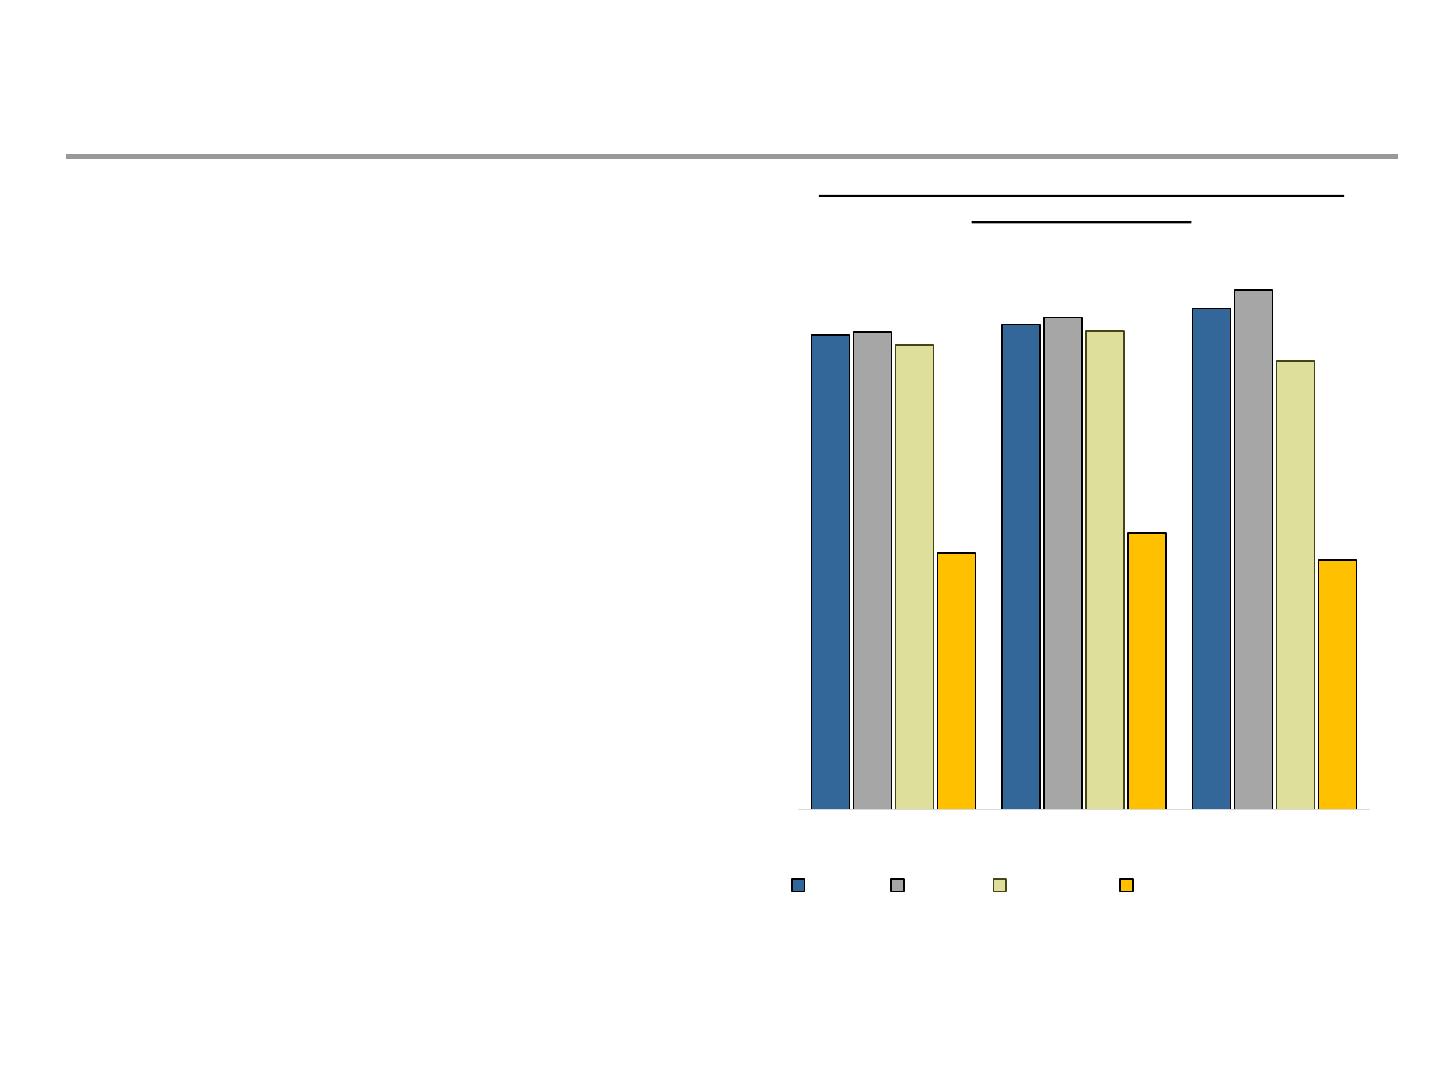
Overall and at large cities, there has been
an increase in the average number of
competitors per city-pair since 2007.
There was a slight decrease in the number
of competitors per city-pair from medium
and small cities, but the average city-pair
to/from small cities still has close to two
competitors while medium cities average
over three competitors.
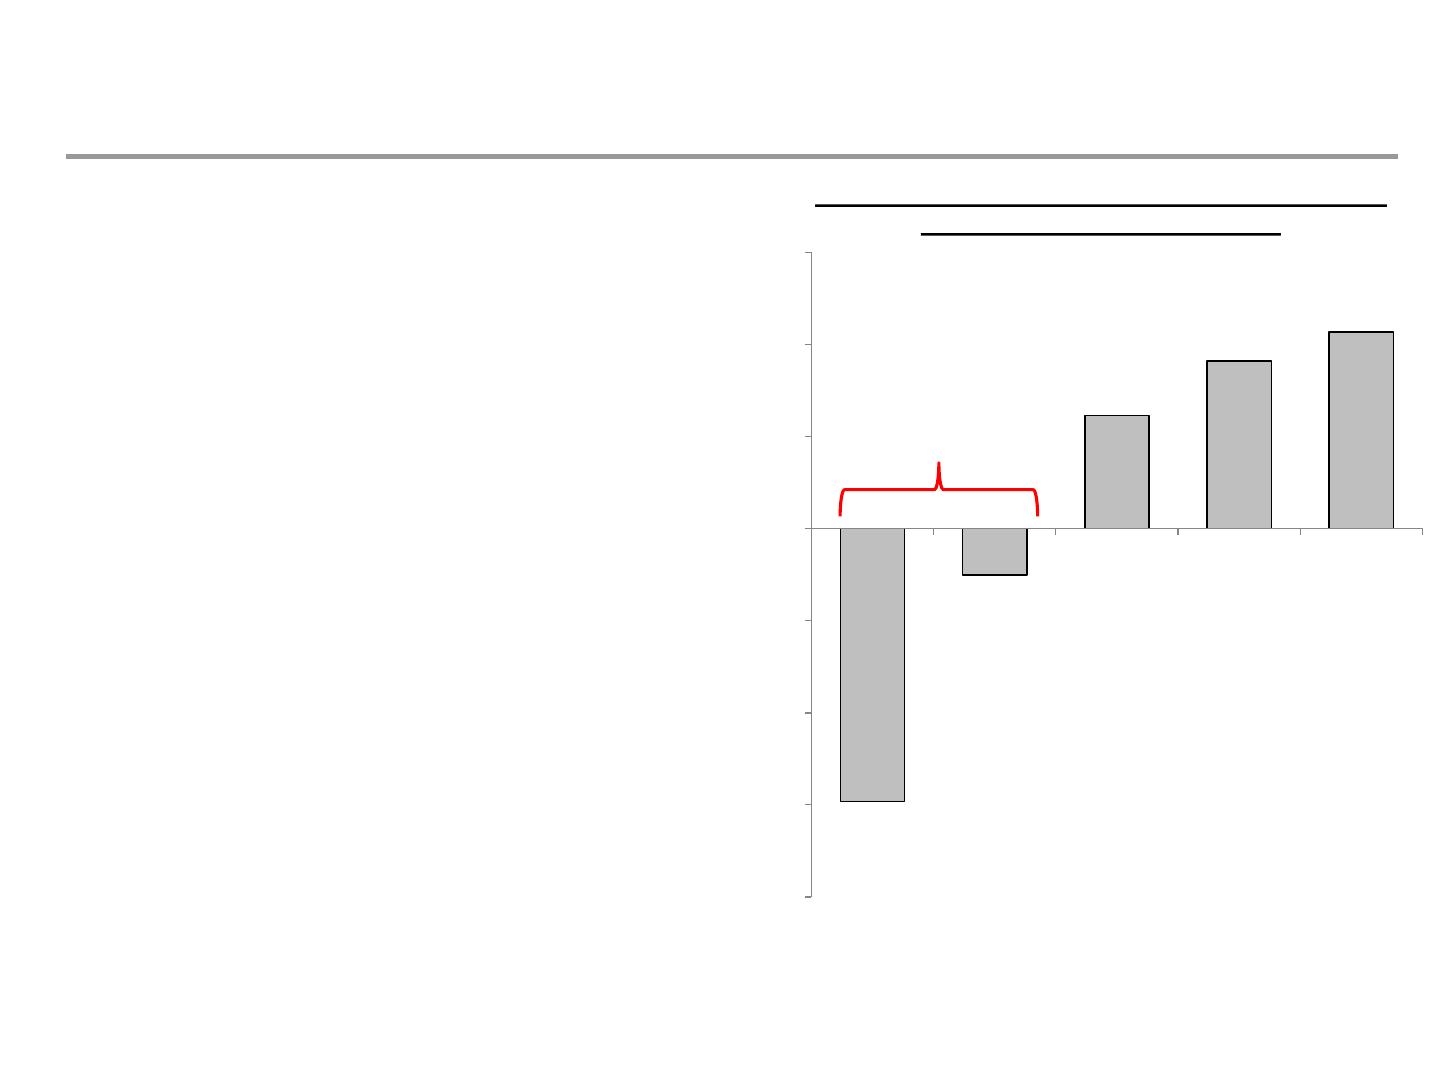
The worsening economics of 50-seat (and
smaller) regional jets and sharp declines in
short-haul travel due to the post-9/11
“hassle factor” have been the primary
causes of the decrease in service at smaller
cities.
3.3 3.4 3.5
3.4 3.5
3.6
3.3 3.4
3.2
1.8 1.9
1.8
0.0
0.5
1.0
1.5
2.0
2.5
3.0
3.5
4.0
2000 2007 2016
Avg. Number of Competitors
Total Large Medium Small/NonHub
Average Number of Competitors on City-Pairs from
Different Sized Cities
7
0
5
10
15
20
25
30
1990
1991
1992
1993
1994
1995
1996
1997
1998
1999
2000
2001
2002
2003
2004
2005
2006
2007
2008
2009
2010
2011
2012
2013
2014
2015
2016
Real Domestic Price Per Mile (Cents)
Real Domestic Yield Real Domestic Yield w/ Bag and Change Fees
Great
Recession
Real (Inflation Adjusted) Domestic Prices Per Mile, 1990-2016
Sources: A4A; U.S. Department of Labor Bureau of Labor Statistics; U.S. EIA.
Notes: 2016 Dollars. Prices are net of taxes and passenger facility charges. Real domestic price per mile is stage-length adjusted to 1,000 miles. Bag and change
fees are domestic unadjusted for distance.
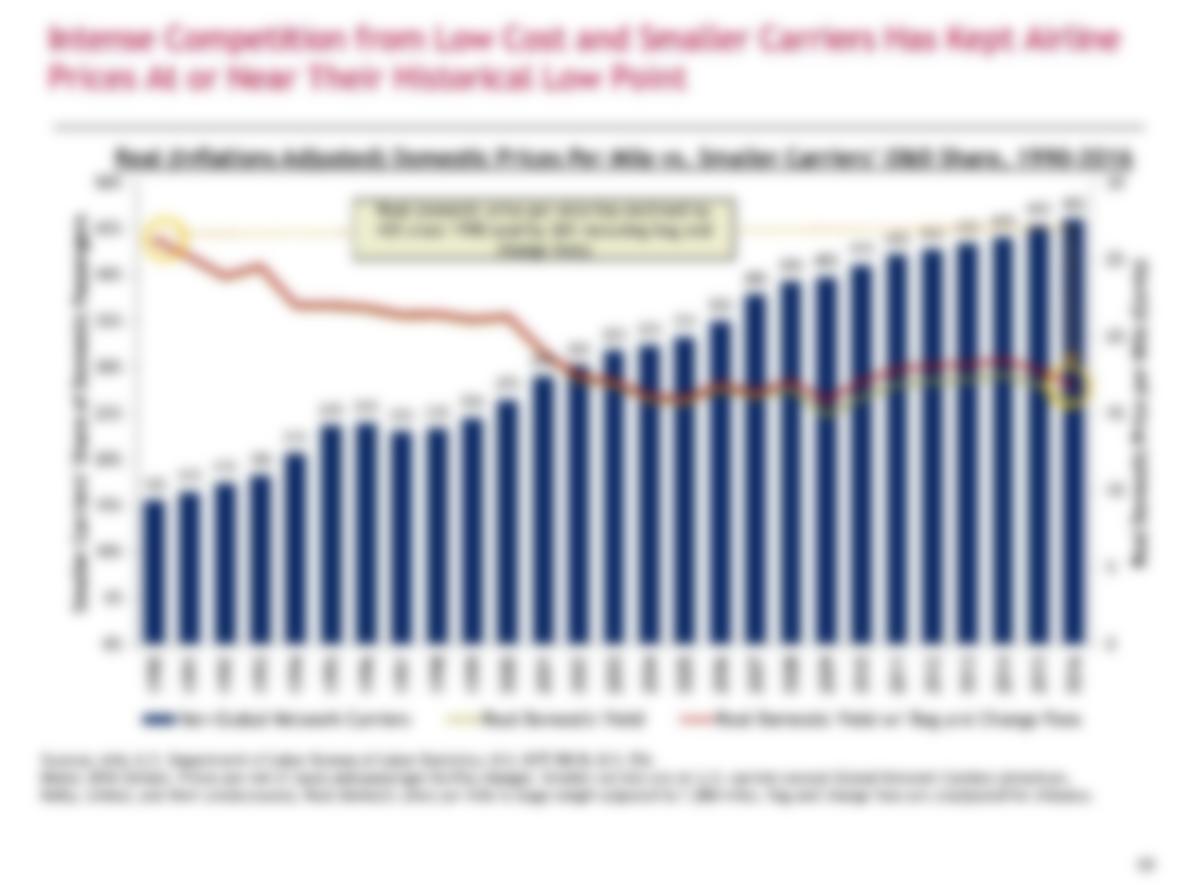
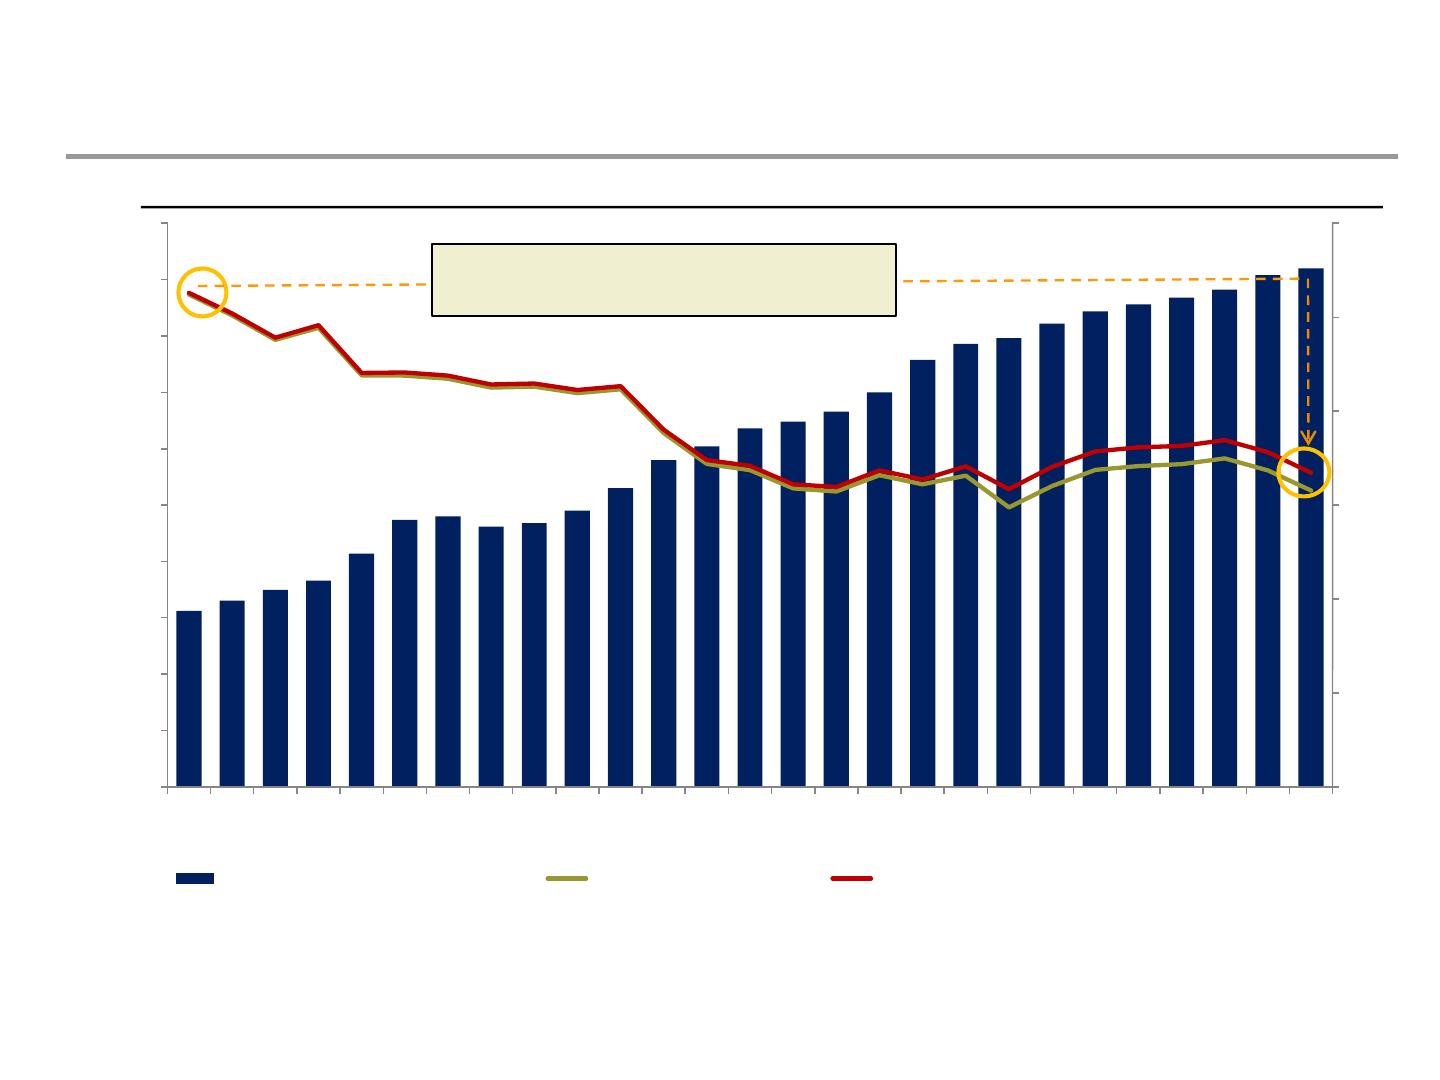
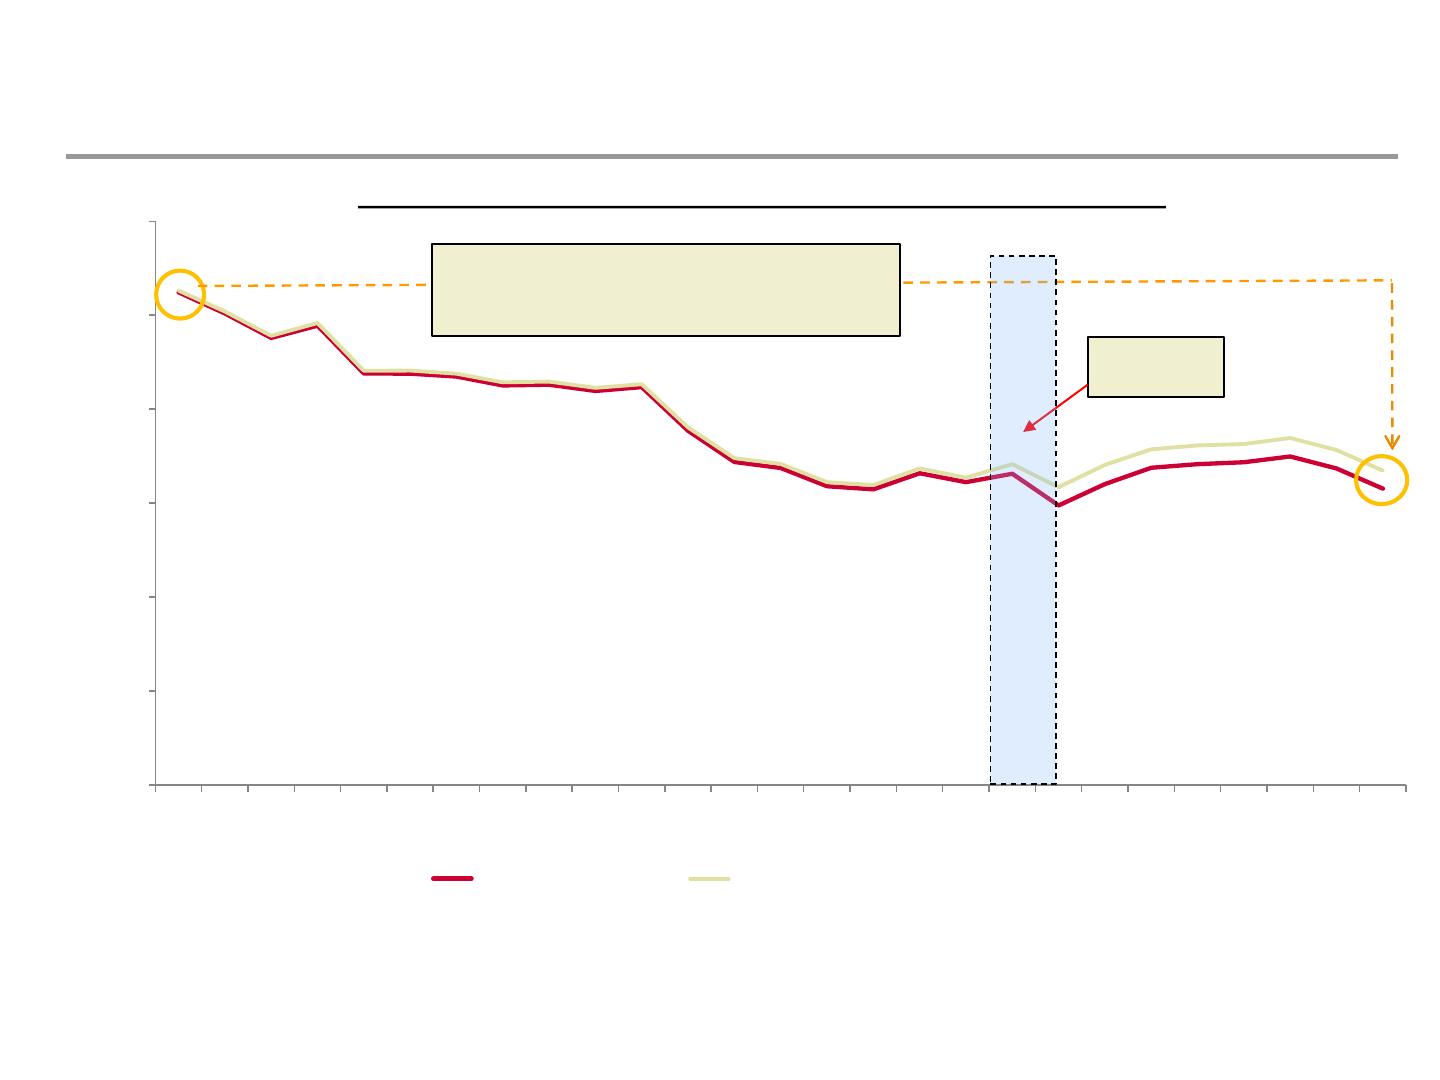
Real domestic price per mile has declined
by 40% since 1990 (and by 36% including bag
and change fees)
Ticket Prices Are At or Near Their Historical Lows Notwithstanding the 110%
Increase in Jet Fuel Prices Since 1998 and Several Mergers
8
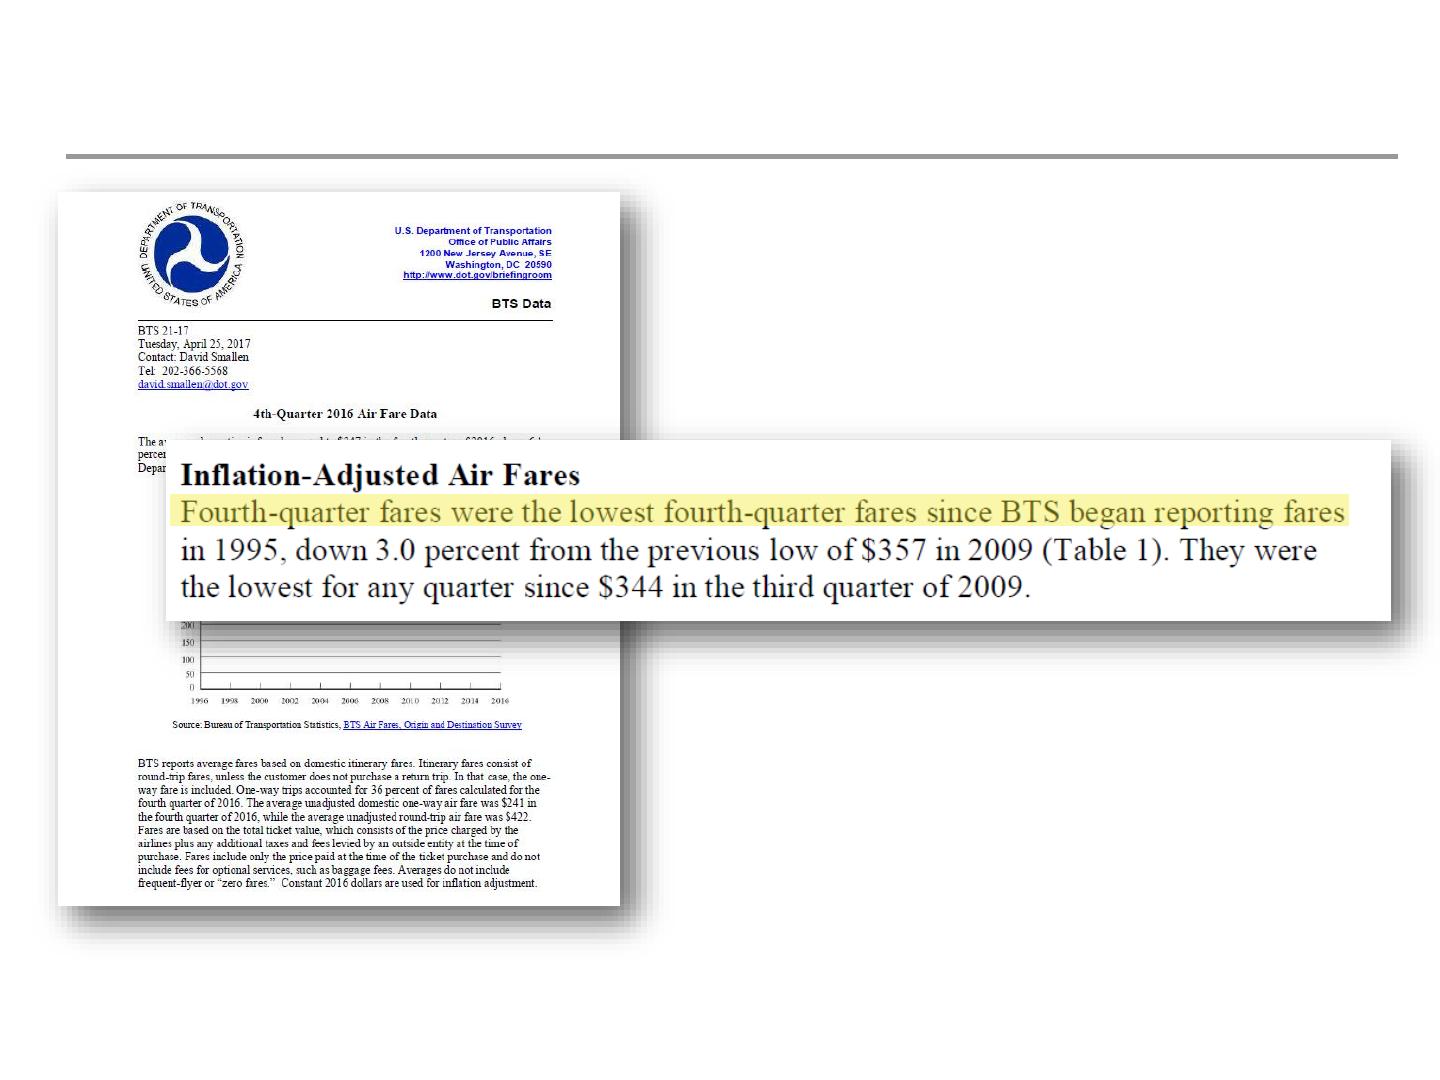
DOT’s Most Recent Quarterly Fare Report Finds Fares Are at
Historically Low Levels
Sources: U.S. DOT.
9
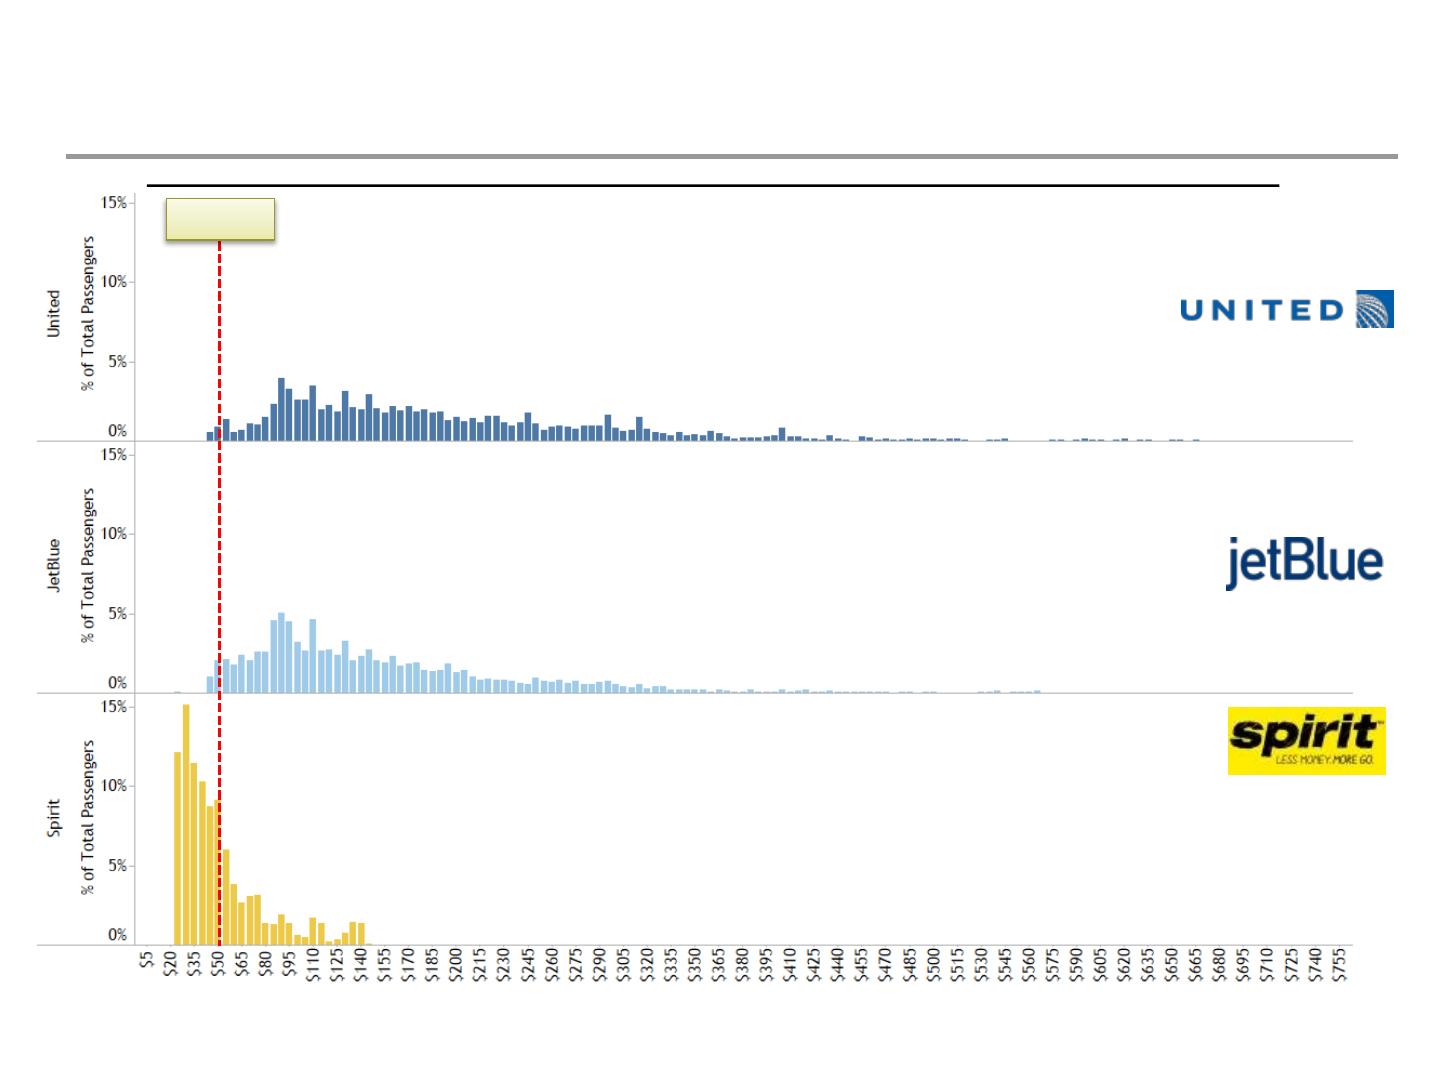
In an Increasing Number of City-Pairs, Consumers Can Choose from Full
Service Options on Global Network Carriers, Low Cost Options on Carriers
Such as JetBlue, and Even Lower Cost Options on ULCCs Such as Spirit
Source: U.S. DOT DB1B Database 2016.
Round-trip Non-Stop Base Fare (Excluding Ancillary Fees) Distribution Between Boston and Cleveland
$100 RT
10
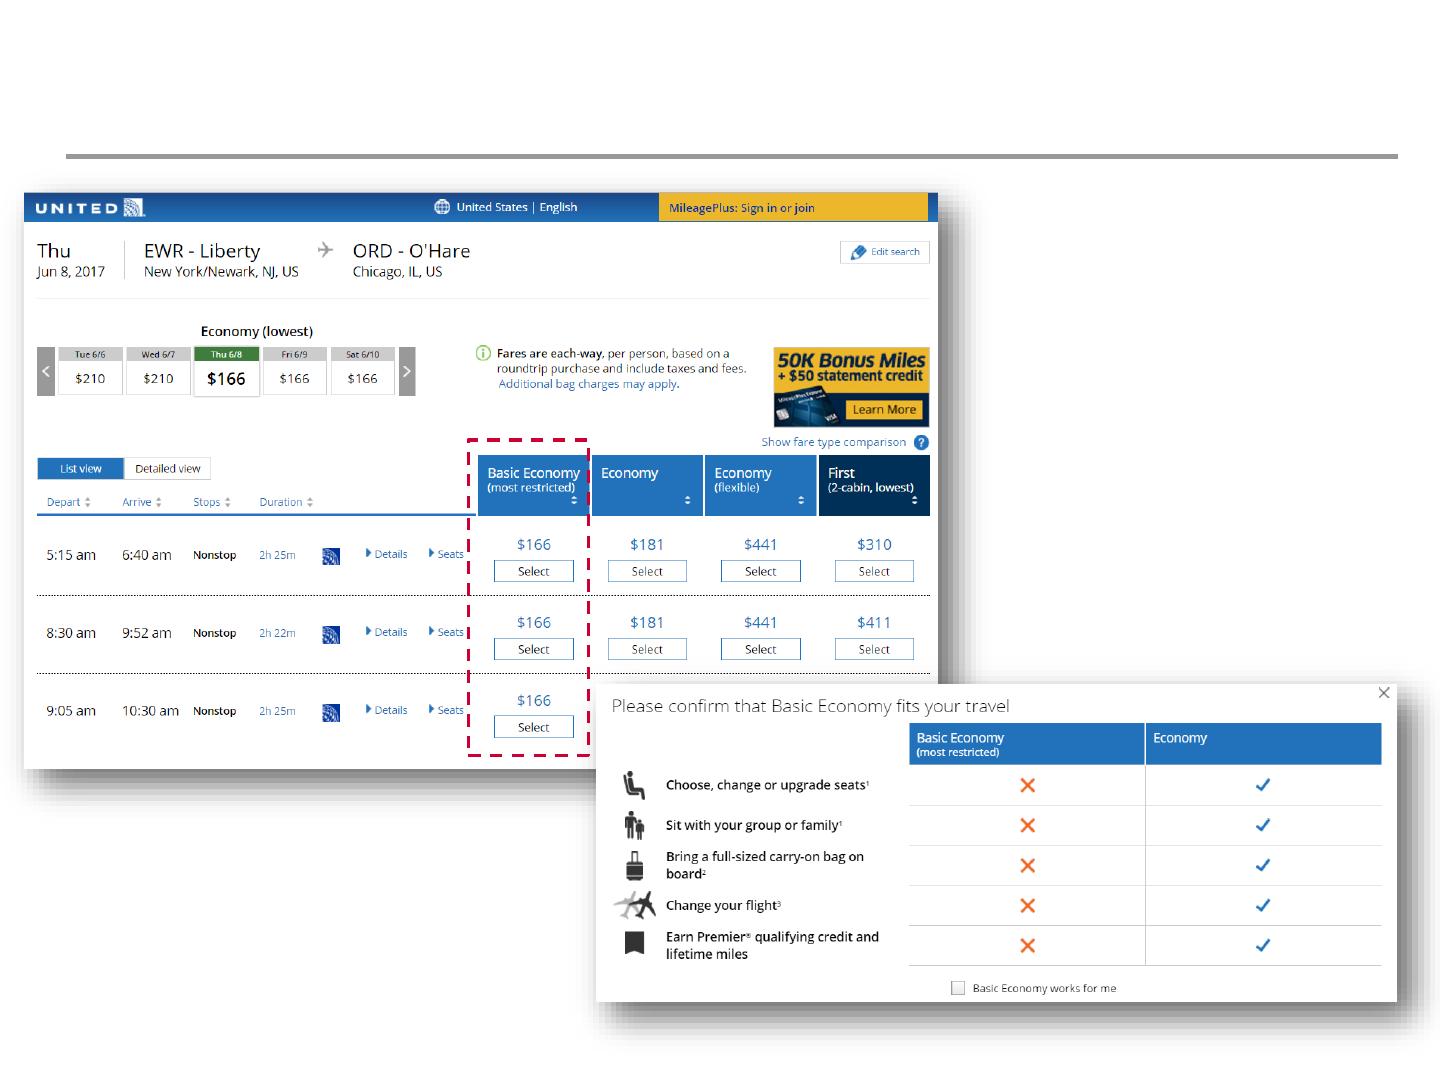
In Response to Strong Demand for “Unbundled” Fares Offered by ULCCs,
Global Network Carriers Have Introduced “Basic Economy” Fares
Source: United.com accessed on June 1, 2017 for outbound travel on June 8, returning on Tuesday June 12th. Lowest return fares priced at $166 (Basic Economy)
on 5:34 PM, 7:35 PM and 9:20 PM departures.

11
2. Rapid Expansion by LCCs and Other
Smaller Carriers Has Spurred Robust
Competition Putting Substantial
Downward Pressure on Airfares
12
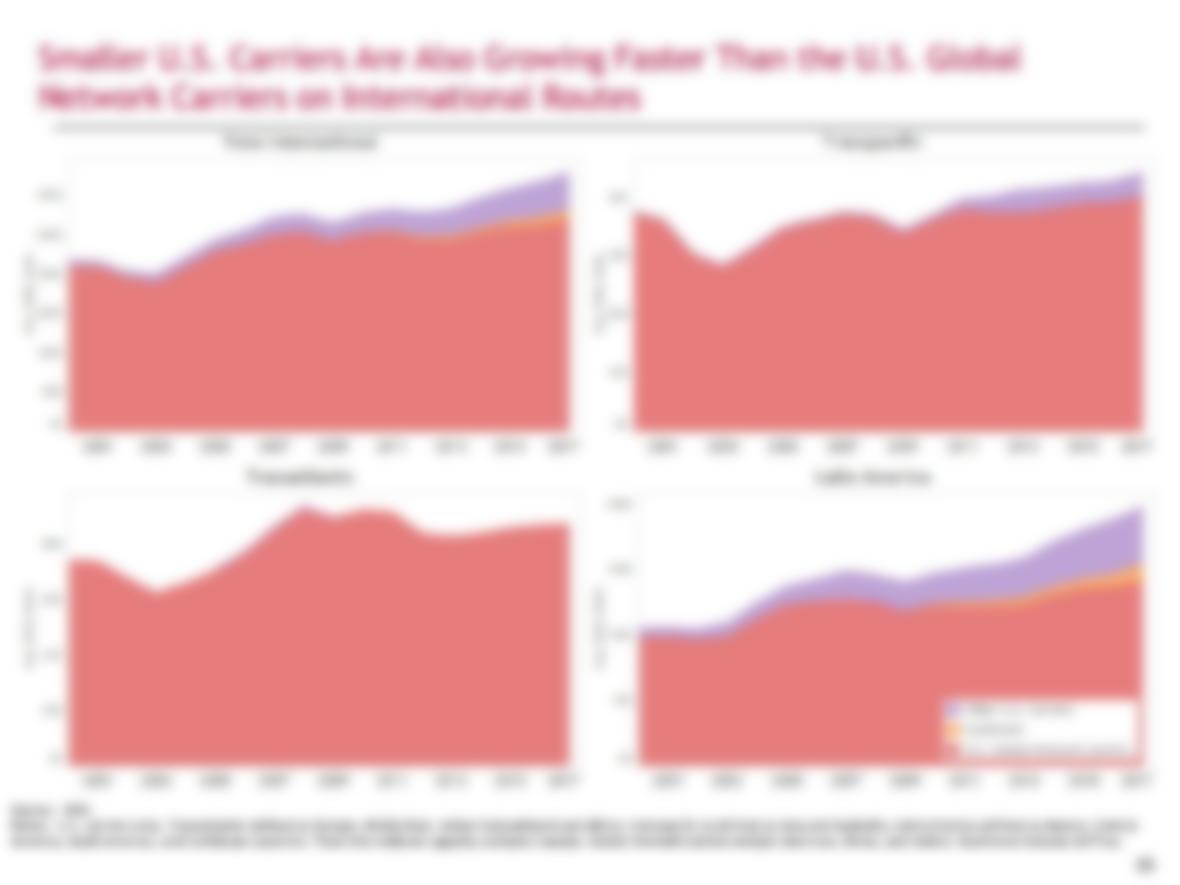
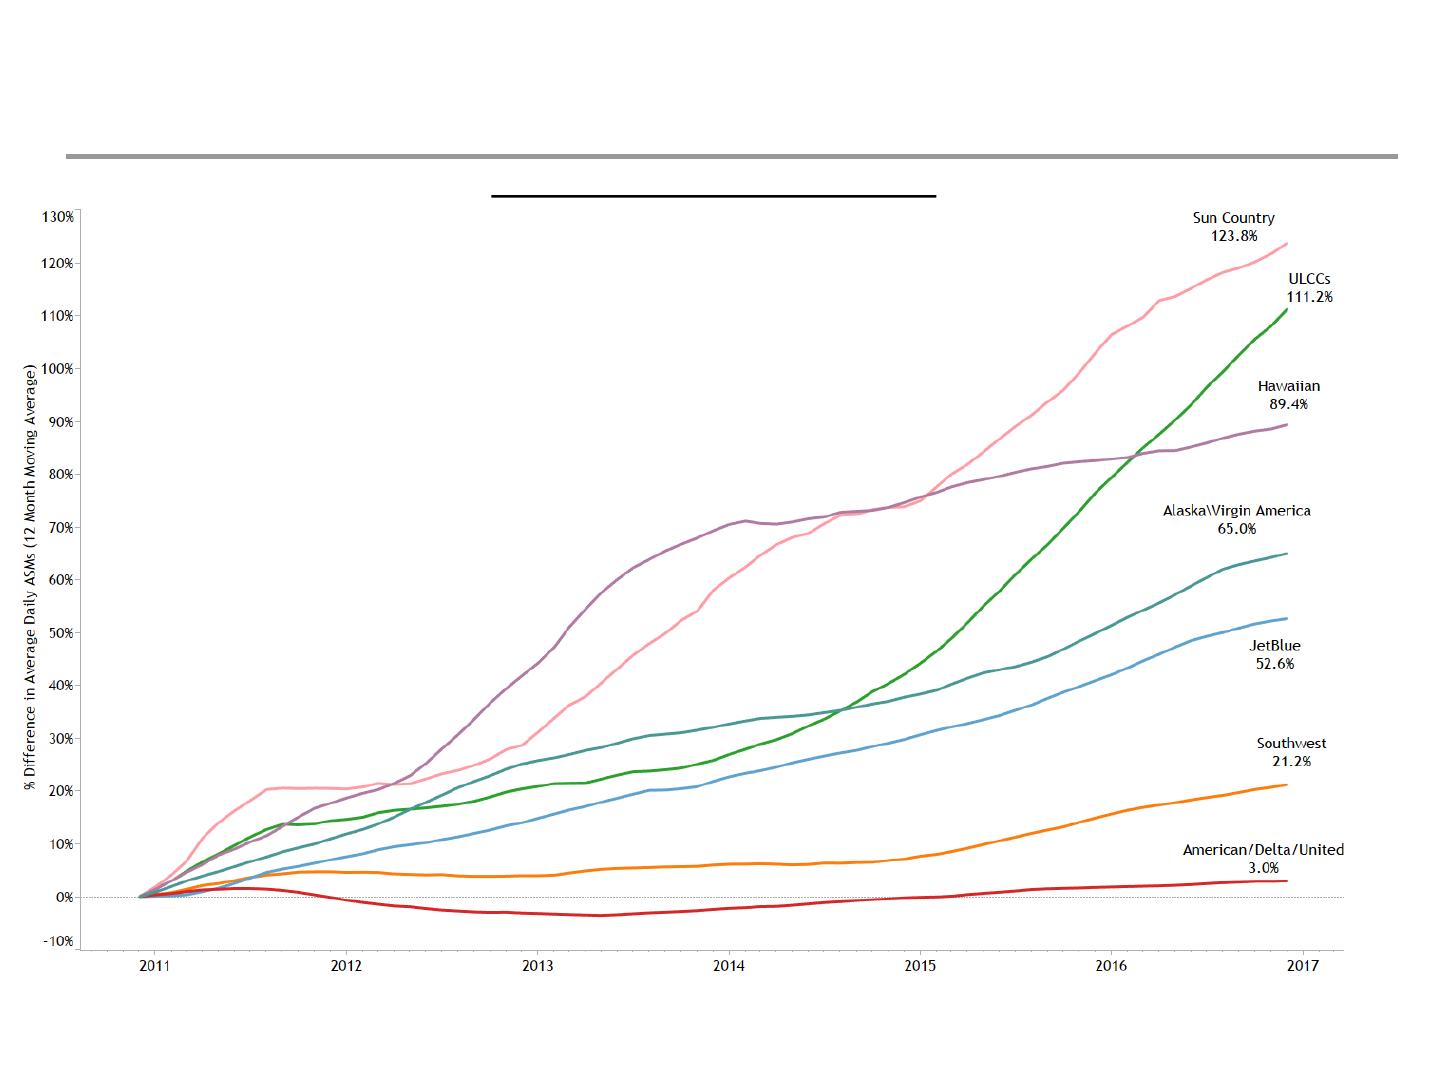
Smaller Carriers Have Been Growing Far Faster Than the Four
Largest Carriers
Growth in Systemwide ASMs Since 2010
Source: OAG.
Notes: ULCCs include Allegiant, Spirit and Frontier. Carriers include predecessor airlines.
13
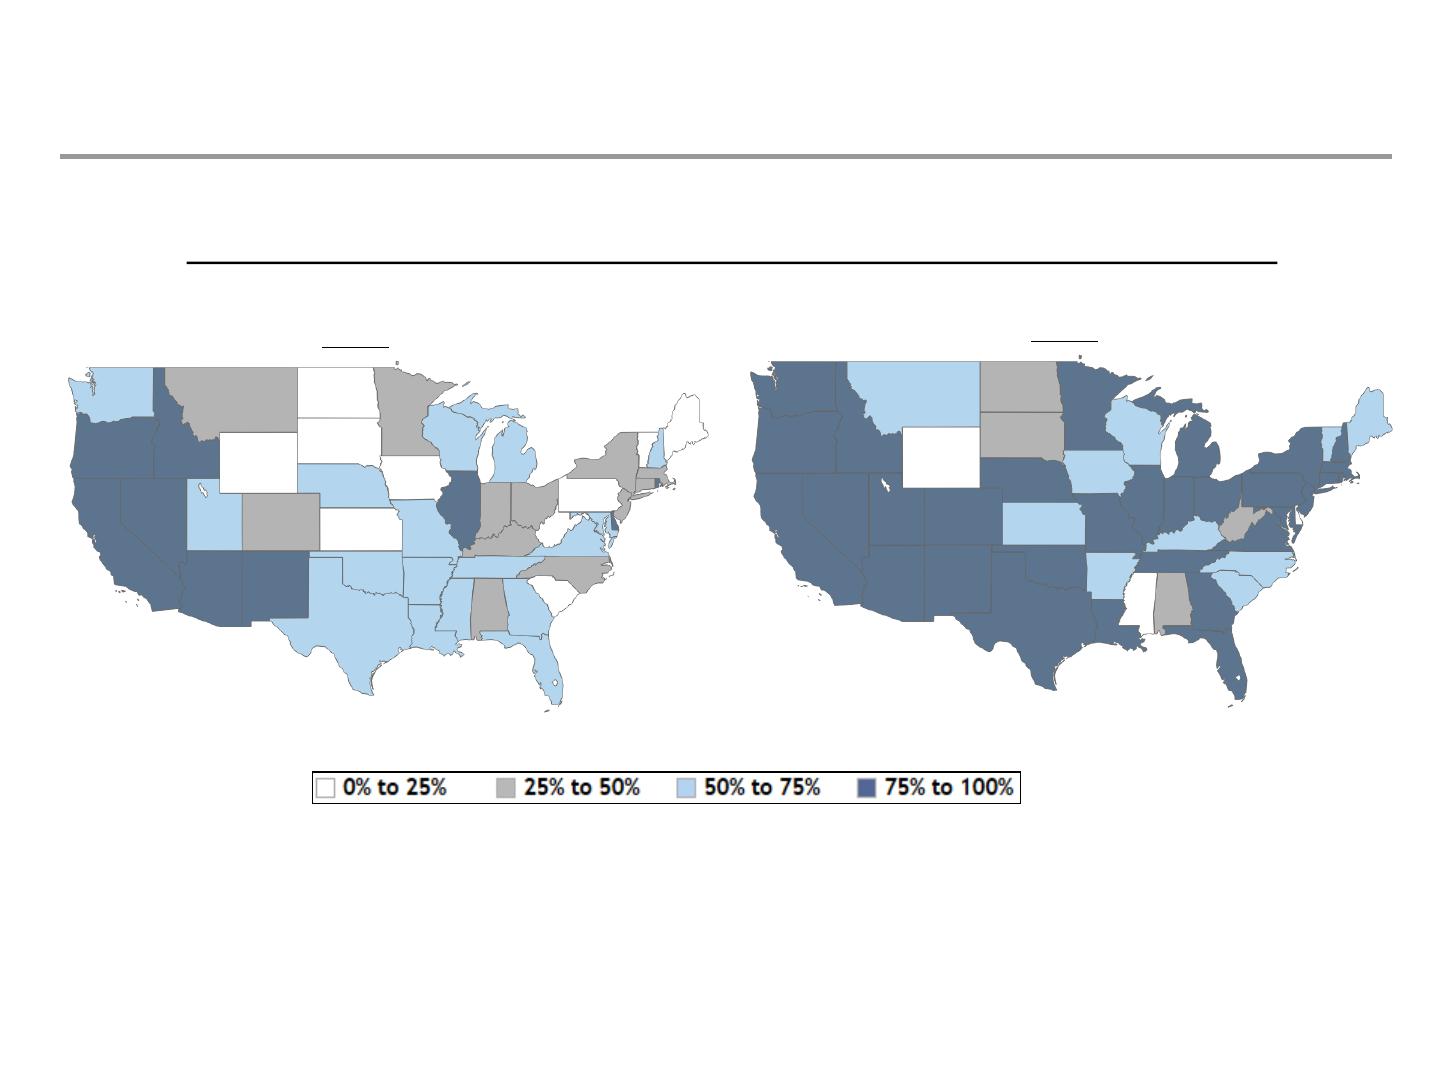
Percentage of Domestic O&D Passengers with non-Global Network Carrier Options, 1998 vs. 2016
Sources: U.S. DOT DB1B and DB1A.
Notes: Domestic Passengers with non-Global Network Carrier Options defined as passengers traveling in city-pairs where at least one non-Global
Network Carrier has at least a 5% O&D share. New York and New Jersey are grouped. District of Columbia, Virginia, and Maryland are grouped.
1998 2016
The Geographic Penetration of LCCs/ULCCs/Smaller Carriers is Now Pervasive
14
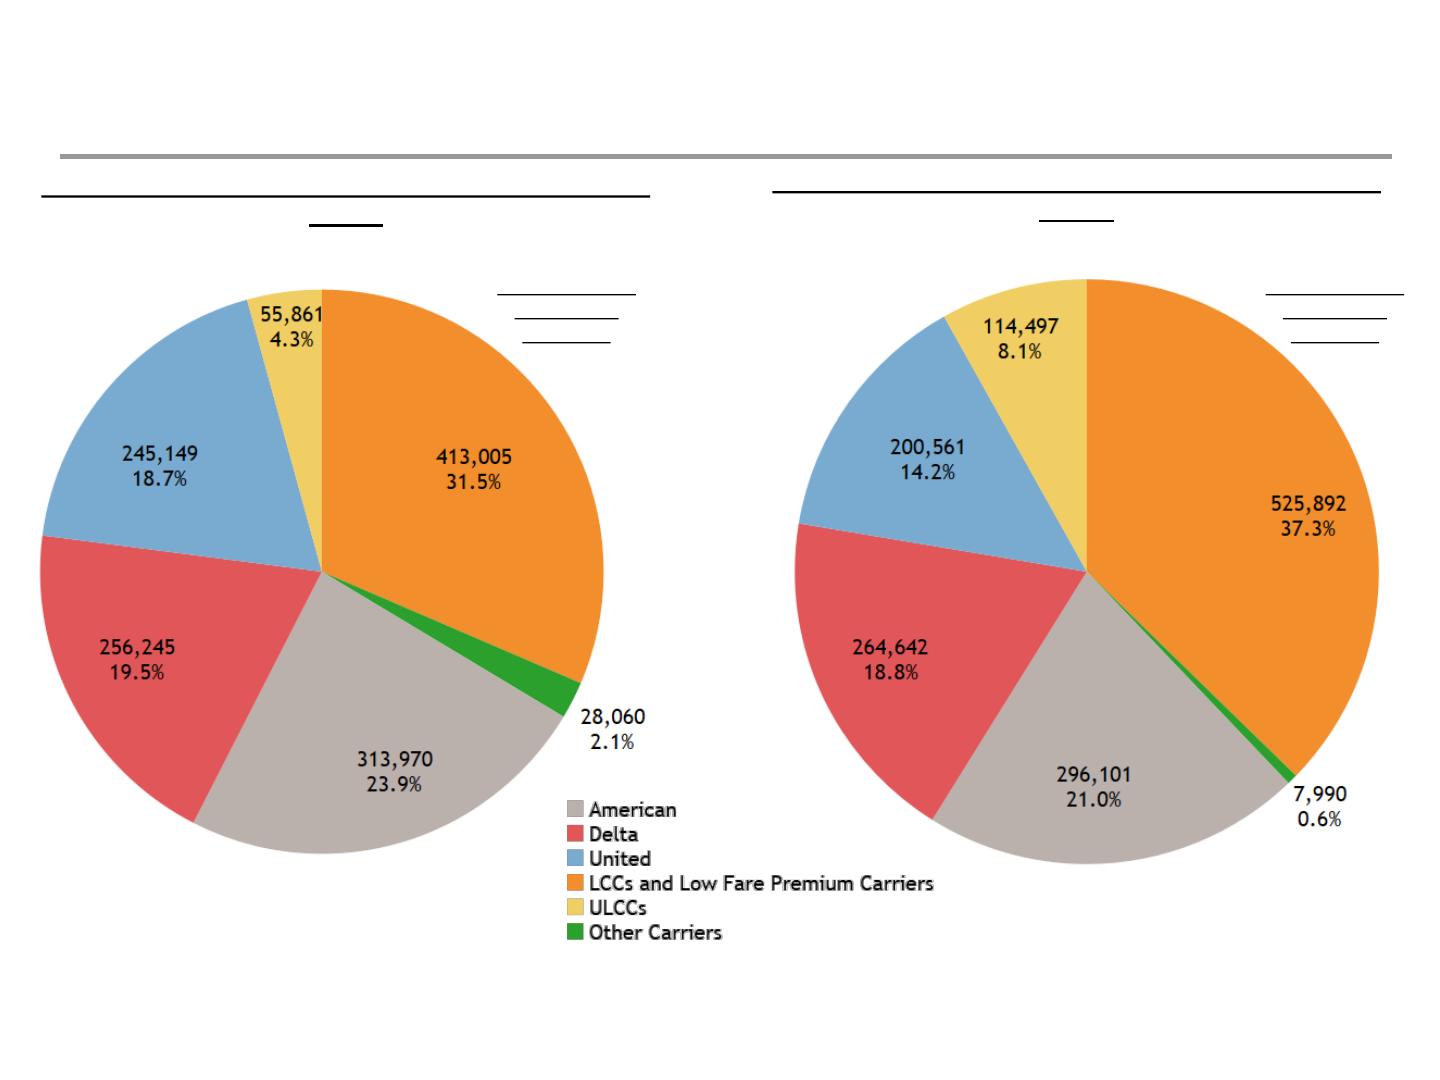
Small Carriers with Low Cost Structures Have Captured Nearly All of the
Growth in Domestic Demand Since 2007 (Approx. 100,000 Passenger/Day)
Source: U.S. DOT DB1B Database.
Notes: Numbers indicate average daily O&D passengers for each carrier and their share of total O&D passengers. United includes Continental, Delta includes
Northwest, American includes US Airways. LCCs and Low Fare Premium Carriers include Southwest, JetBlue, Alaska, Hawaiian, Virgin America, Sun Country and
AirTran. ULCCs include Spirit, Allegiant and Frontier.
Avg. Daily Domestic O&D Passengers and Market Share
(2007)
Avg. Daily Domestic O&D Passengers and Market Share
(2016)
2007 Avg. Daily
Passengers:
1,312,290
2016 Avg. Daily
Passengers:
1,409,682
15
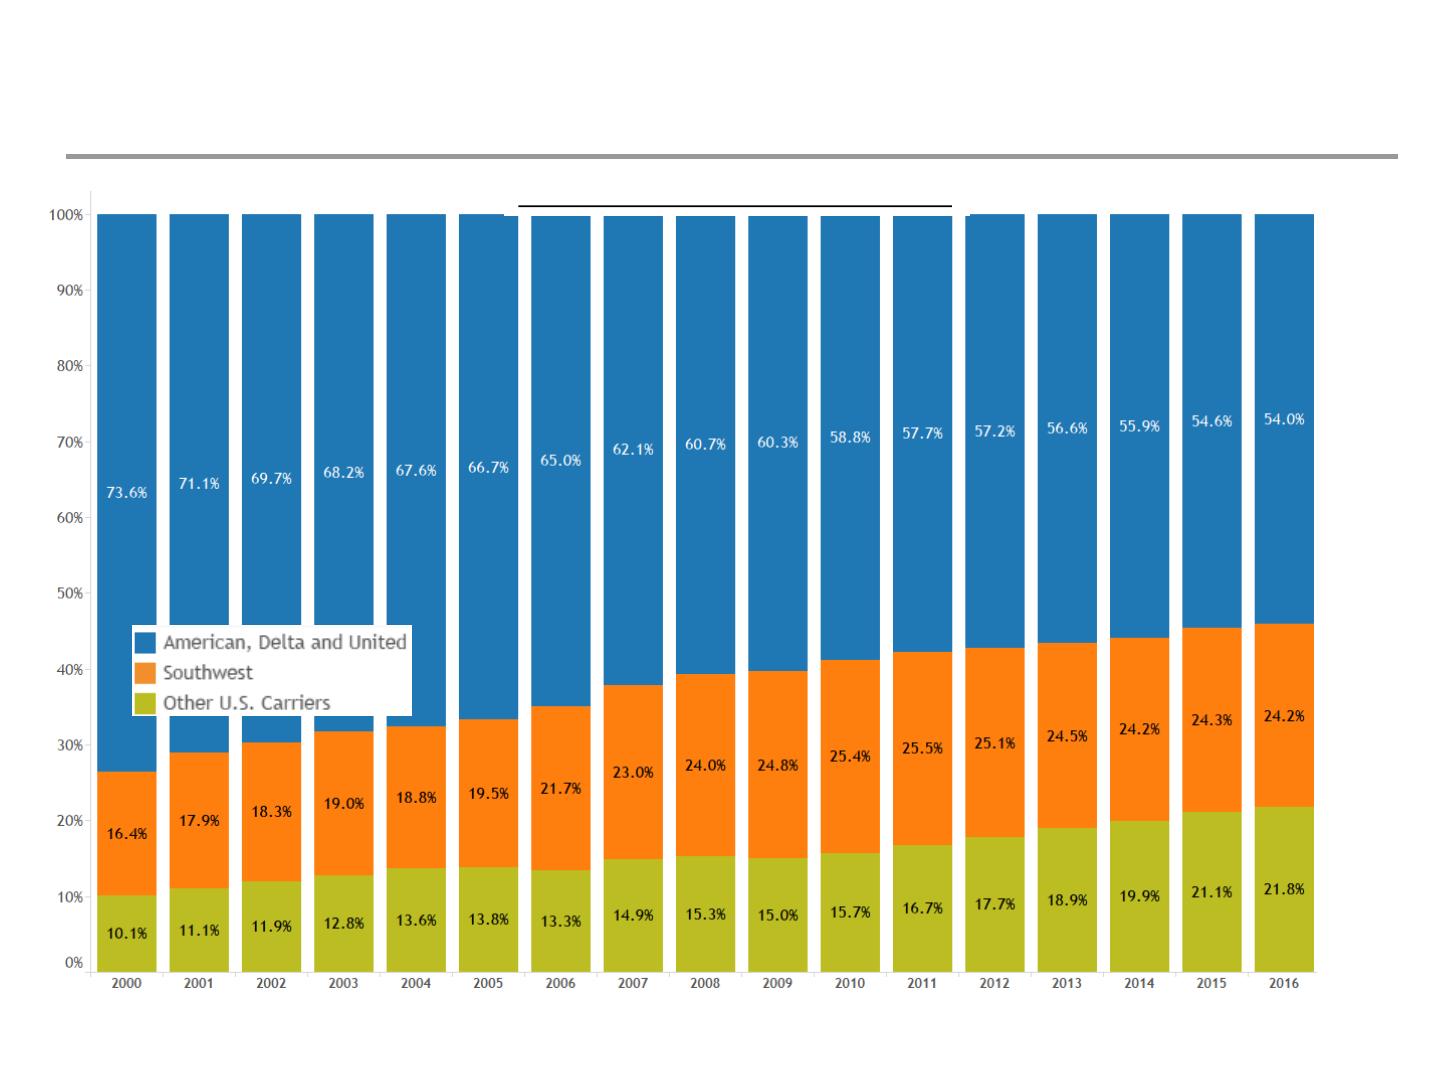
Sources: U.S. DOT DB1B.
Notes: American, Delta, United and Southwest reflect merged carriers in all years.
Share of Domestic O&D Passengers
Smaller Carriers (Alaska, Spirit, JetBlue, etc.) Have Been Growing Rapidly
16
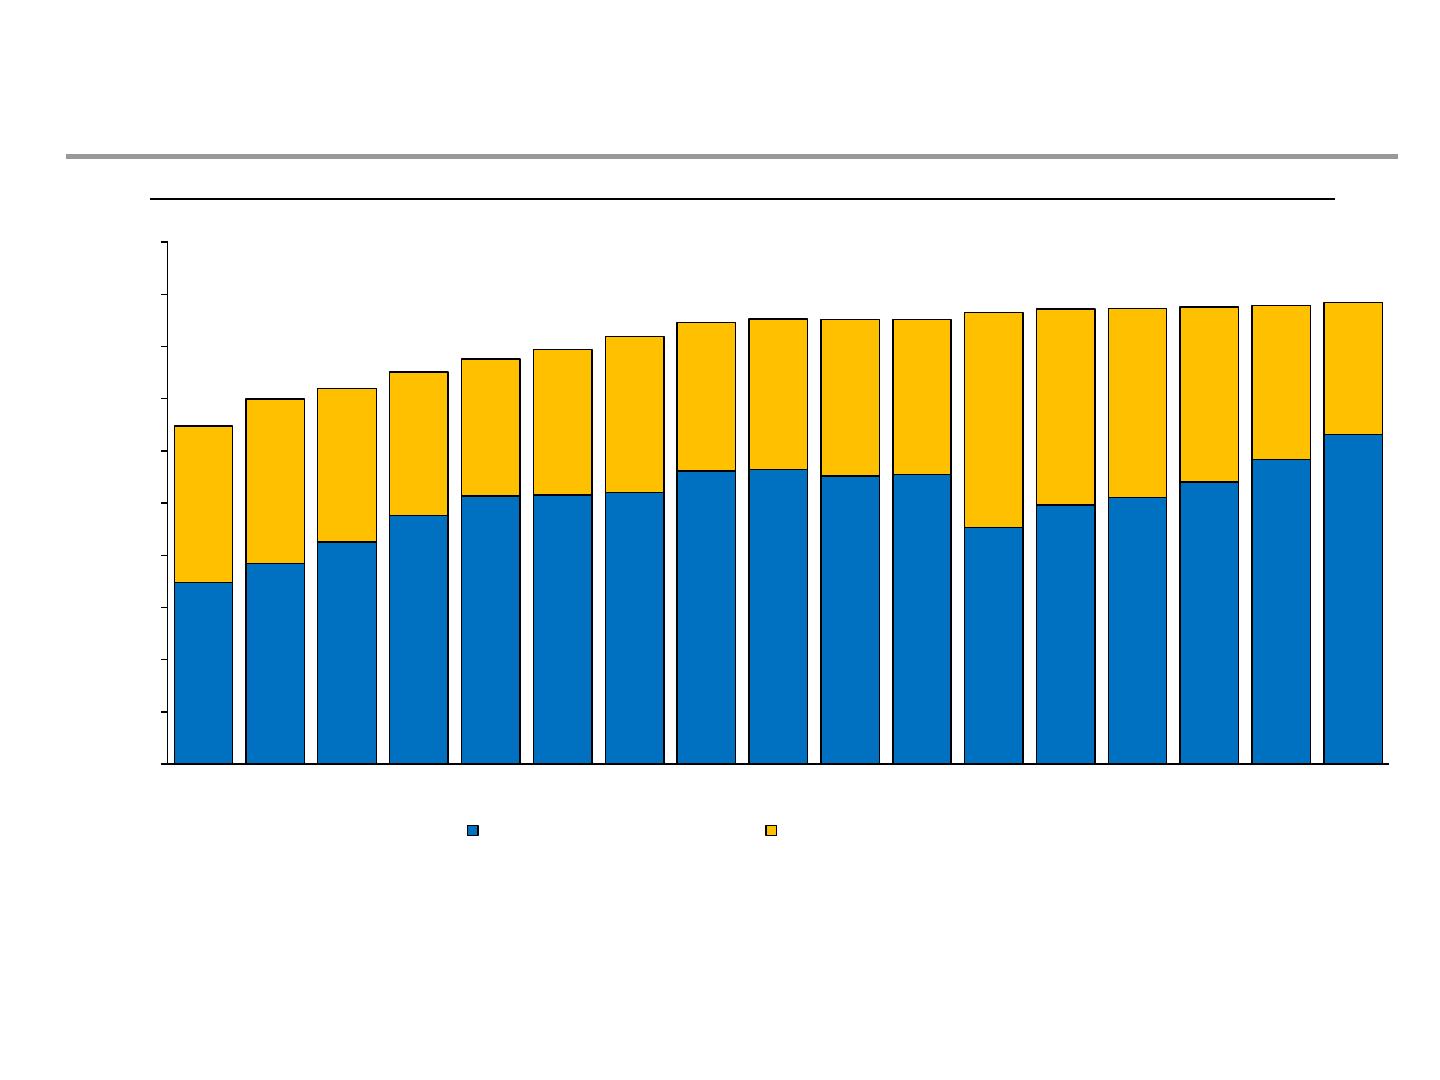
Consumers’ Options to Choose from Carriers Other Than the Global
Network Carriers Have Increased Significantly Over the Past Two Decades
Sources: U.S. DOT DB1B.
Notes: Domestic passengers. Global Network Carriers includes American, Delta, United, and their predecessors. Passengers with non-Global Network Carrier options are
passengers on city-pairs where at least one non-Global Network Carrier has at least a 5% O&D passenger share. Airports in the following metropolitan areas are
grouped: Chicago (ORD, MDW), Cincinnati (CVG, DAY), Cleveland (CLE, CAK), Dallas (DFW, DAL), Houston (HOU, IAH), Los Angeles Basin (LAX, BUR, LGB), Miami (MIA,
FLL), New York (LGA, JFK, EWR), San Francisco/Bay Area (SFO, OAK), Washington DC/Baltimore (DCA, IAD, BWI), and Tampa (TPA, PIE).
65%
70% 72% 75% 78% 79% 82% 85% 85% 85% 85% 86% 87% 87% 88% 88% 88%
0%
10%
20%
30%
40%
50%
60%
70%
80%
90%
100%
2000 2001 2002 2003 2004 2005 2006 2007 2008 2009 2010 2011 2012 2013 2014 2015 2016
Percentage of Domestic Passengers with non–
Global Network Carrier Options
Options on Smaller Carriers Options on Southwest
Proportion of Domestic O&D Passengers Traveling in City-Pairs With Options Other Than American, Delta or United
The Assertion That “The ‘Southwest Effect’ is Long Gone” Has Been
Proven to Be Untrue
Some industry observers have
asserted that since its merger
with AirTran “The ‘Southwest
Effect’ is Long Gone.”*