1: DISTRIBUTION DESCRIPTION
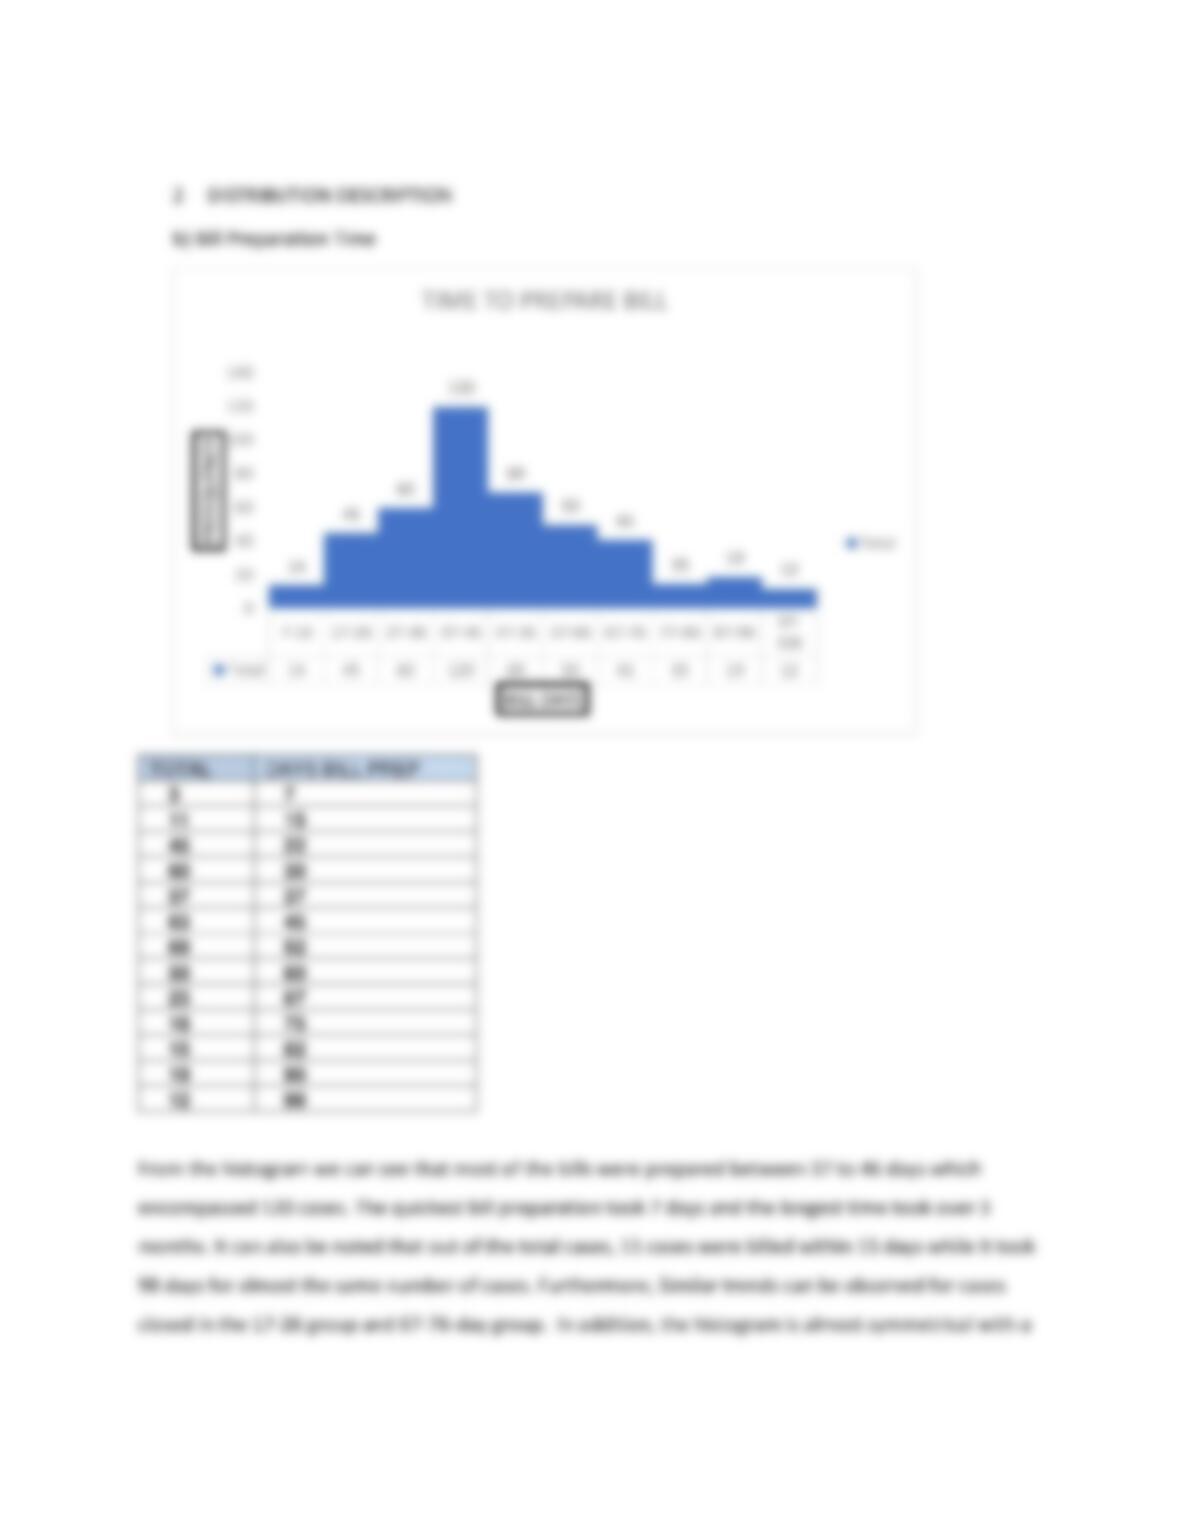
From the histogram depicted above, we can observe that the day range 37 to 46, has the highest
observations with 120 while 7 to 16 range has the lowest range with only 14 observations. The
histogram is non-symmetrical in nature. However, Since the observation covers a large range of data,
the spread if the graph is large. The graph is also bimodal as it has 2 peaks with height of 120 and 19.
There are no outliners present.
jjdbhgdhdsdff
0
20
40
60
80
100
120
140
7-16 17-26 27-36 37-46 47-56 57-66 67-76 77-86 87-96 97-106
FREEQUENCY
BILL DAYS
TIME TO PREPARE BILL
Total
0
50
100
150
200
250
CLIENT BILL
Total

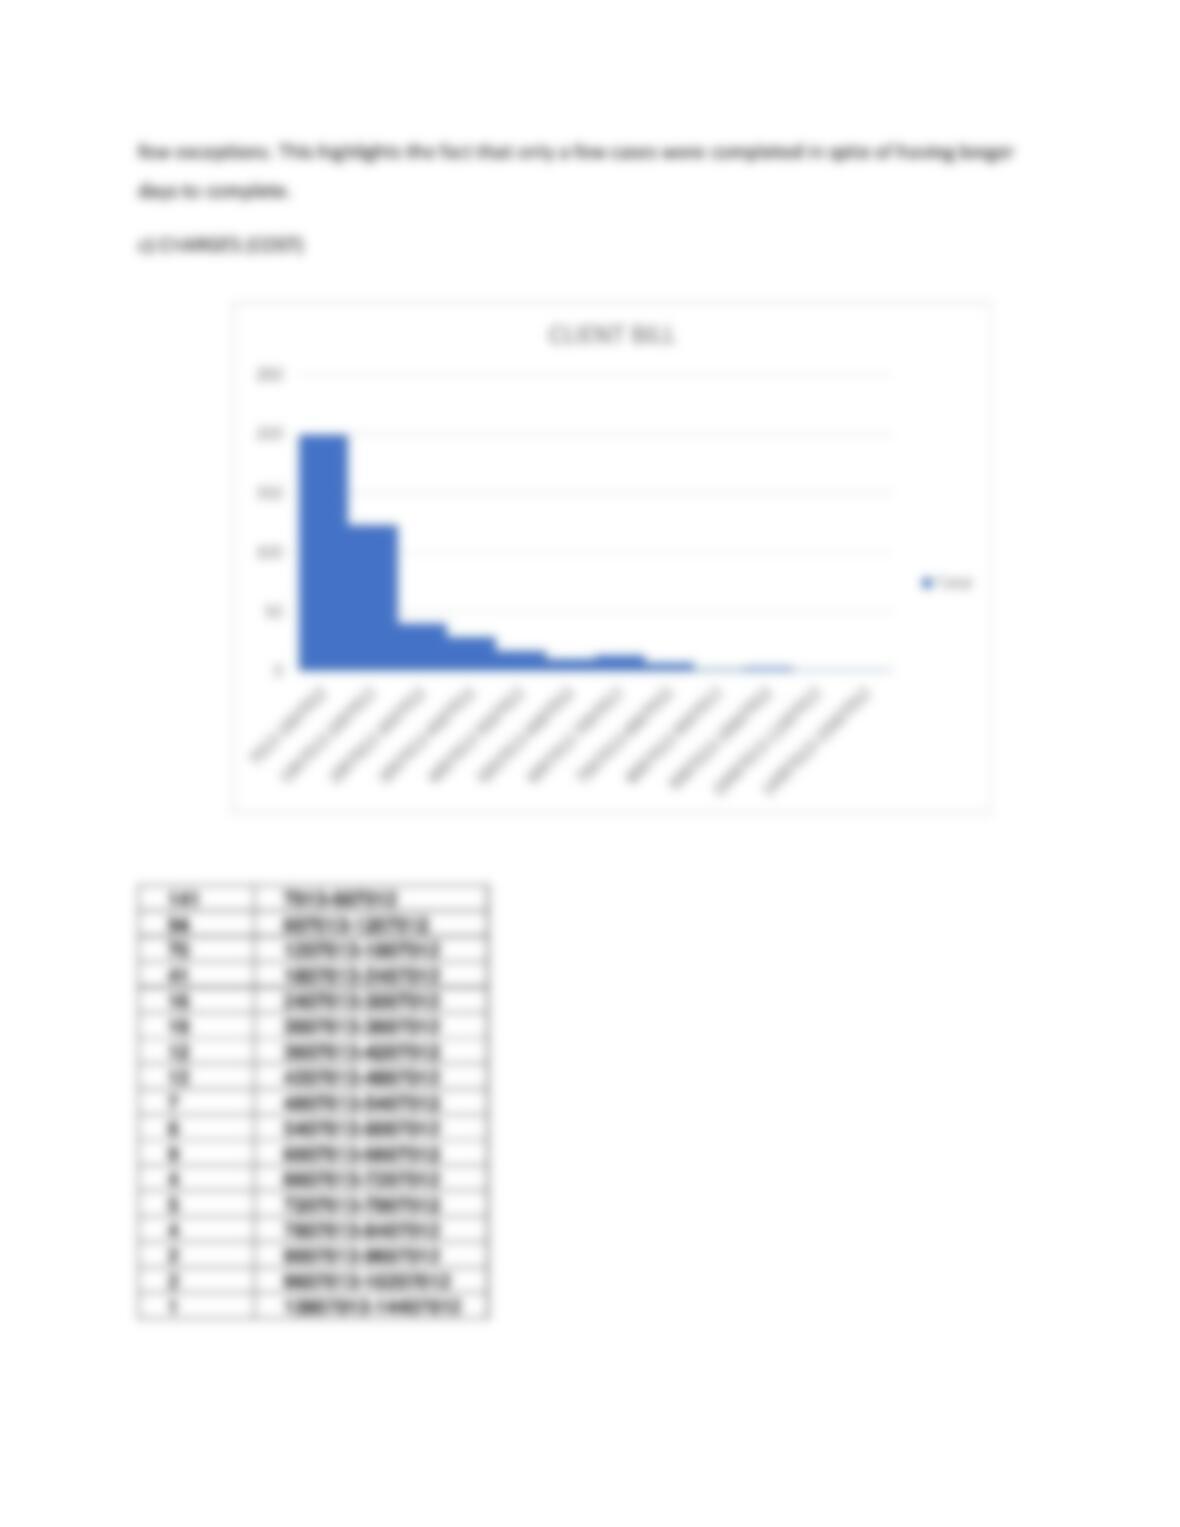
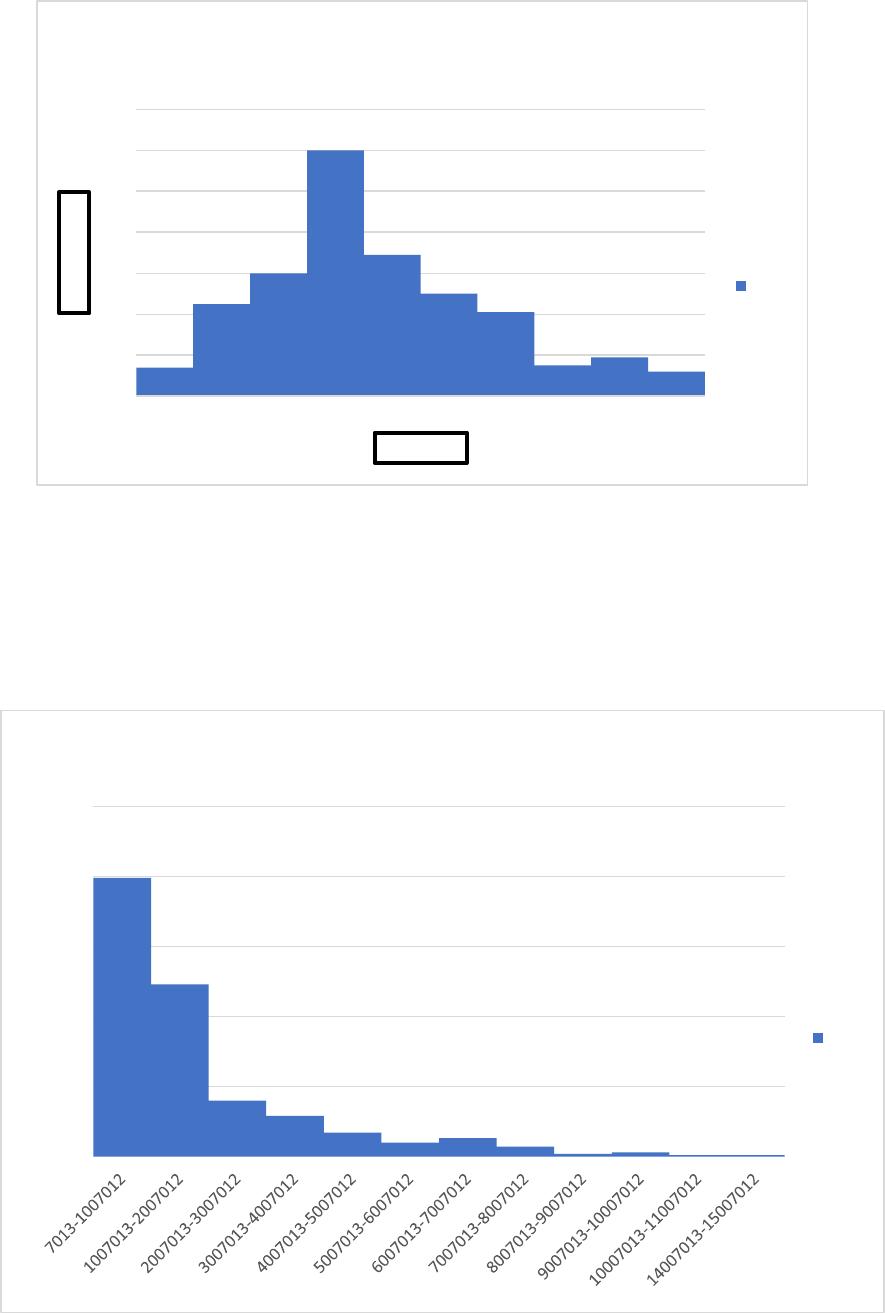
The histogram has the highest peak at 199. With most of the observations to the left we can say that the
graph is skewed to the right. This also means that the mean is greater than the median. The graph with