CHAPTER 5
Activity-Based Costing and Management
Answers to Review Questions
5-1 In a traditional, volume-based product-costing system, only a single predetermined
overhead rate is used. All manufacturing-overhead costs are combined into one cost
pool, and they are applied to products on the basis of a single cost driver that is
closely related to production volume. The most frequently used cost drivers in
traditional product-costing systems are direct-labor hours, direct-labor dollars,
machine hours, and units of production.
5-2 Management was being misled by the traditional product-costing system, because
the high-volume product lines were being overcosted and the low-volume product
line was being undercosted. The high-volume products essentially were subsidizing
the low-volume line. The traditional product-costing system failed to show that the
low-volume products were driving more than their share of overhead costs. As a
result of these misleading costs, the company’s management was mispricing its
products.
5-3 An activity-based costing system is a two-stage process of assigning costs to
products. In stage one, activity-cost pools are established. In stage two a cost driver
is identified for each activity-cost pool. Then the costs in each pool are assigned to
each product line in proportion to the amount of the cost driver consumed by each
product line.
5-4 A cost driver is a characteristic of an event or activity that results in the incurrence
of costs by that event or activity. In activity-based costing systems, the most
significant cost drivers are identified. Then a database is created that shows how
these cost drivers are distributed across products. This database is used to assign
costs to the various products depending on the extent to which they use each cost
driver.
5-5 The four broad categories of activities identified in an activity-based costing system
are as follows:
(a) Unit-level activities: Must be done for each unit of production.
(b) Batch-level activities: Must be performed for each batch of products.
(c) Product-sustaining activities: Needed to support an entire product line.
McGraw-Hill/Irwin © 2009 The McGraw-Hill Companies, Inc.
Managerial Accounting, 8/e 5-1

(d) Facility-level (or general-operations-level) activities: Required for the entire
production process to occur.
5-6 An activity-based costing system alleviated the problems management was having
under its traditional, volume-based product-costing system by more accurately
assigning costs to products. Products were assigned costs based on the extent to
which they used various cost drivers that were determined to be closely related to
the incurrence of a variety of overhead costs.
5-7 Product-costing systems based on a single, volume-based cost driver tend to
overcost high-volume products, because all overhead costs are combined into one
pool and distributed across all products on the basis of only one cost driver. This
simple averaging process fails to recognize the fact that a disproportionate amount
of costs often is associated with low-volume or complex products. The result is that
low-volume products are assigned less than their share of manufacturing costs, and
high-volume products are assigned more than their share of the costs.
5-8 In traditional, volume-based costing systems, only direct material and direct labor
are considered direct costs. In contrast, under an activity-based costing system, an
effort is made to account for as many costs as possible as direct costs of
production. Any cost that can possibly be traced to a particular product line is
treated as a direct cost of that product.
5-9 The pool rate is calculated by dividing the budgeted amount of an activity cost pool
by the budgeted total quantity of the associated cost driver. The pool rate is the cost
of a particular activity that is expected per unit of the associated cost driver.
5-10 Two factors that tend to result in product cost distortion under traditional, volume-
based product-costing systems are as follows:
(a) Non-unit level overhead costs: Many overhead costs vary with cost drivers that
are not unit-level activities. Use of a unit-level cost driver to assign such costs
tends to result in cost distortion.
(b) Product diversity: When a manufacturer produces a diverse set of products,
which exhibit different consumption ratios for overhead activities, use of a single
cost driver to assign costs results in cost distortion.
5-11 Three important factors in selecting cost drivers for an ABC system are as follows:
(a) Degree of correlation between consumption of an activity and consumption of
the cost driver.
(b) Cost of measurement of the cost driver.
McGraw-Hill/Irwin © 2009 The McGraw-Hill Companies, Inc.
5-2 Solutions Manual

(c) Behavioral effects, that is, how the cost driver selected will affect the behavior of
the individuals involved in the activity related to the cost driver.
5-12 An activity dictionary lists all of the activities identified and used in an activity-based
costing analysis. The activity dictionary provides for consistency in the terminology
and level of complexity in the ABC analysis in the organization’s various subunits.
5-13 Line managers are close to the production process and may realize that a complex
product, which is difficult to manufacture, is undercosted by a traditional, volume-
based costing system. Because of the cost distortion that is common in such
systems, the undercosted product may appear to be profitable when it is really
losing money. Line managers may have a “gut feeling” for this situation, even if the
cost-accounting system suggests otherwise.
5-14 Diverse products typically consume support activities (such as purchasing, material
handling, engineering, and inspection) in differing degrees. When there are
significant differences among product lines in the ways that they consume support
services (and thereby cause overhead costs), a traditional, volume-based costing
system may distort product costs. Some products are overcosted; others are
undercosted. An ABC system can eliminate (or at least alleviate) such cost
distortion.
5-15 Activity-based costing is just as appropriate in the service industry as in the
manufacturing industry. Just as in manufacturing firms, diverse services typically
consume support activities in varying degrees. ABC systems are more accurate in
tracking the usage of these support activities to the services (products) that are
produced than are traditional, volume-based costing systems.
5-16 As indicated in the chapter, Pennsylvania Blue Shield, like many manufacturers,
classifies activities as unit level, batch level, product-sustaining level, or facility
level. Maintenance of the medical-services provider network (i.e., the physicians and
hospitals that provide medical care to claimants) is a product-sustaining-level
activity because it benefits an entire product line (service line, in this case) of
personal health insurance policies.
5-17 Management could use the ABC information about the cost of various types of
patient appointments for determining charges for appointments, making
appointment staffing decisions (e.g., physician versus nurse practitioner), and
justifying reimbursements from insurance companies or government agencies.
McGraw-Hill/Irwin © 2009 The McGraw-Hill Companies, Inc.
Managerial Accounting, 8/e 5-3

5-18 At Patio Grill Company, every unit of each product line manufactured requires all
eight of the support activities covered by the ABC system. In contrast, at Delaware
Medical Center, each patient sees a physician, or a nurse practitioner, or an intern, or
a resident. Moreover, each patient is either a new patient or a continuing patient, but
not both. Therefore, in determining the cost a patient appointment, the cost analyst
would include only the relevant activity costs in the cost of a patient appointment.
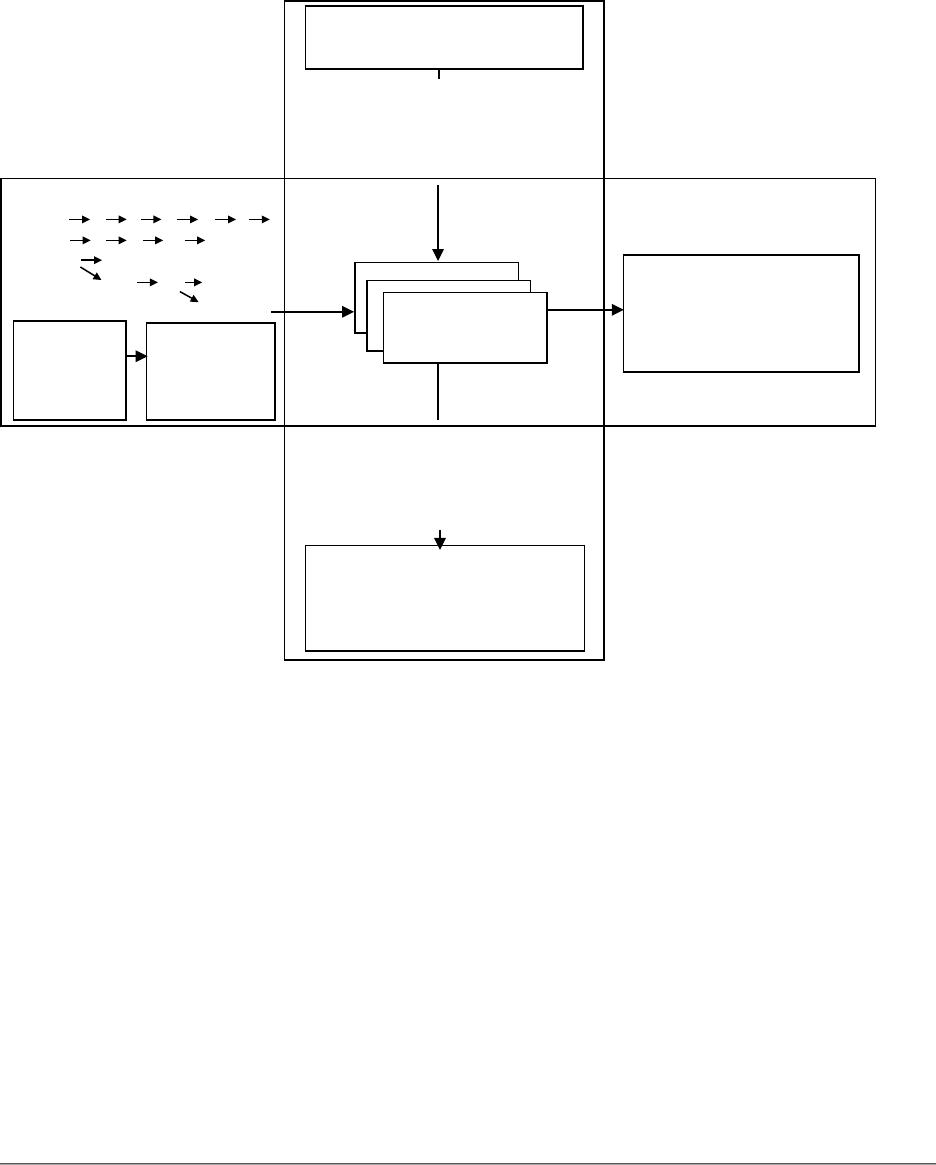
5-19 The two-dimensional activity-based costing model provides one way of picturing the
relationship between ABC and ABM. The vertical dimension of the model depicts the
cost assignment view of an ABC system. From the cost assignment viewpoint, the
ABC system uses two-stage cost allocation to assign the costs of resources to the
firm’s cost objects. These cost objects could be products manufactured, services
produced, or customers served.
Depicted in the horizontal dimension of the model that follows is the process
view of an ABC system. The emphasis now is on the activities themselves, the
processes by which work is accomplished in the organization. The left-hand side of
the model depicts activity analysis, which is the detailed identification and
description of the activities conducted in the enterprise. Activity analysis entails the
identification not only of the activities, but also of their root causes, the events that
trigger activities, and the linkages among activities. The right-hand side of the model
depicts the evaluation of activities through performance measures. These processes
of activity analysis and evaluation constitute activity-based management.
The two-dimensional ABC model is depicted in the diagram on the next page.
5-20 Activity analysis is the detailed identification and description of the activities
conducted in an enterprise. Activity analysis entails the identification not only of
activities, but also of their root causes, of the events that trigger them, and of the
linkages among them. Three criteria for determining whether an activity adds value
are as follows:
(a) Is the activity necessary?
(b) Is the activity efficiently performed?
(c) Is the activity sometimes value-added and sometimes non-value-added?
McGraw-Hill/Irwin © 2009 The McGraw-Hill Companies, Inc.
5-4 Solutions Manual
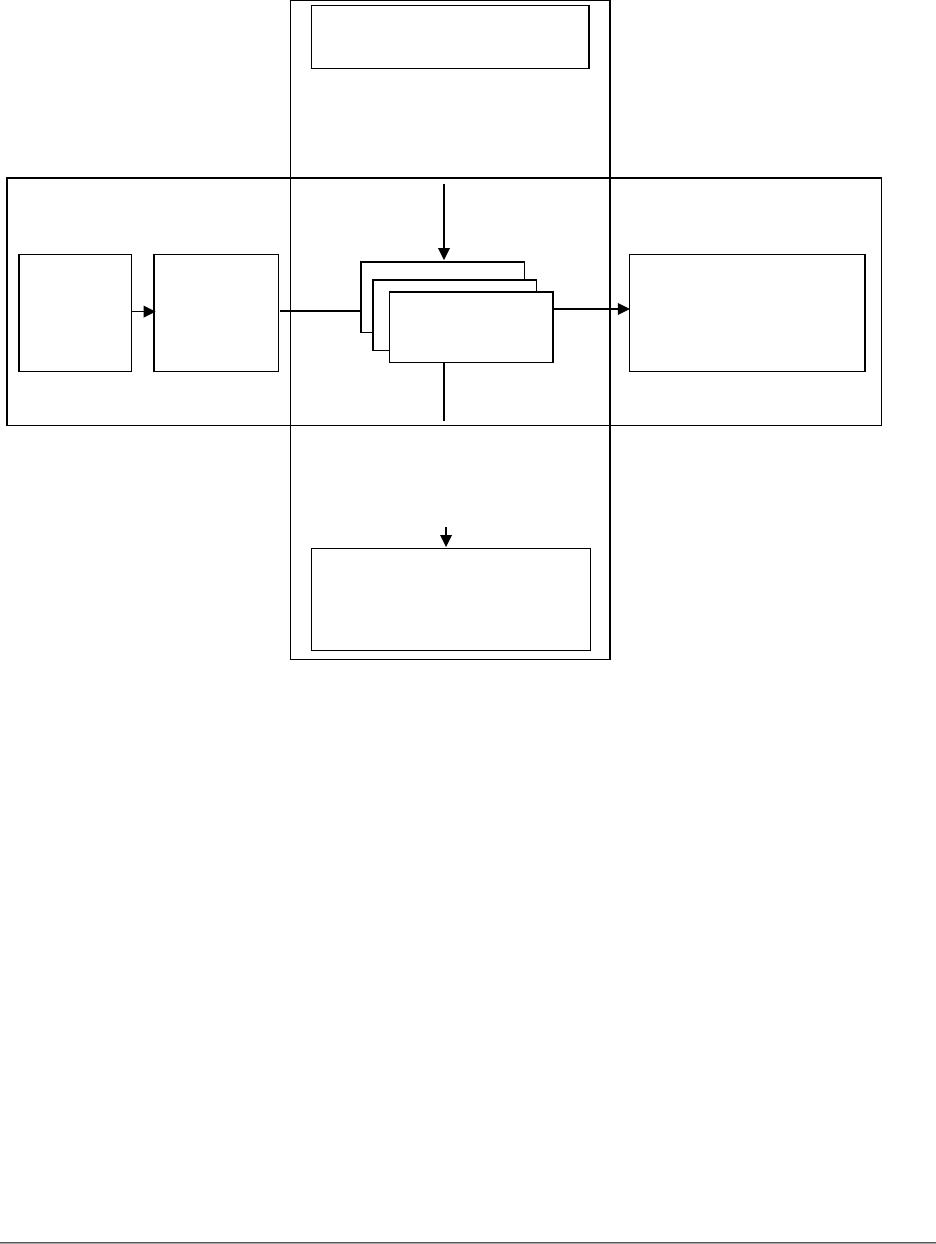
Diagram of two-dimensional ABC model (from review question 5-19 on preceding page):
McGraw-Hill/Irwin © 2009 The McGraw-Hill Companies, Inc.
Managerial Accounting, 8/e 5-5
Cost Assignment View
RESOURCE COSTS
Assignment of resource costs
to activity cost pools
associated with
significant activities
Process View
Activity analysis Activity evaluation
PERFORMANCE
MEASURES
ROOT
CAUSES ACTIVITY
TRIGGERS
Assignment of activity
costs to cost objects
using second-stage
cost drivers
COST OBJECTS
(products or services
produced; customers)
ACTIVITIES

5-21 An activity’s trigger is the preceding event that indicates that the activity should be
performed. The activity’s root cause is the event or activity that, if it had not
occurred, would have prevented the activity in question from happening. For
example, the event that triggers the activity of rework is the identification of a
defective part during inspection. However, the inspection is not the root cause of the
rework activity. The root cause of the defective part, and hence the need for rework,
could lie in erroneous part specifications, in an unreliable vendor, or in faulty
production.
5-22 Customer profitability analysis refers to using the concepts of activity-based costing
to determine how serving particular customers causes activities to be performed and
costs to be incurred. Examples of activities that can be differentially demanded by
customers include order frequency, order size, special packaging or handling,
customized parts or engineering, and special machine setups. Such activities can
make some customers more profitable than others.
5-23 Activity-based costing is used to analyze customer-related costs and determine the
cost drivers for these costs. This ABC data then forms the basis for the customer
profitability analysis by assigning the appropriate amount of customer-related costs
to each customer.
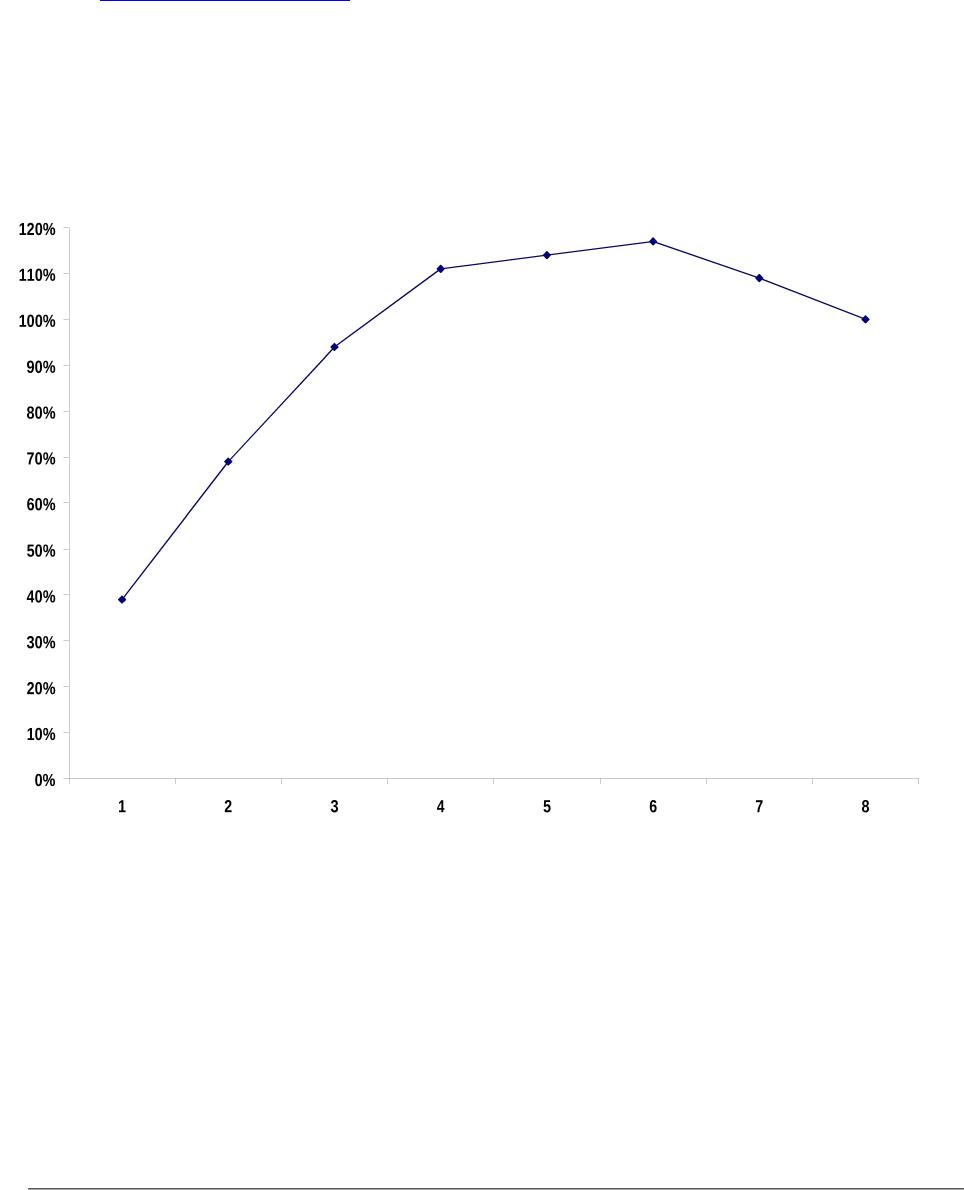
5-24 A customer profitability profile, usually expressed in graphical form, shows the
company’s cumulative operating income as a percentage of total operating income.
The customers included in the profile generally are ranked either by operating
income or by sales revenue.
5-25 In a just-in-time (JIT) production system, raw materials and parts are purchased or
produced just in time to be used at each stage of the production process. This
approach to inventory and production management brings considerable cost
savings from reduced inventory levels.
The key to the JIT system is the “pull” approach to controlling manufacturing.
The diagram on the next page displays a simple multistage production process. The
flow of manufacturing activity is depicted by the solid arrows running down the
diagram from one stage of production to the next. However, the signal that triggers
more production activity in each stage comes from the next stage of production.
These signals, depicted by the dashed-line arrows, run up the diagram. We begin
with sales at the bottom of the exhibit. When sales activity warrants more production
of finished goods, the goods are “pulled” from production stage III by a signal that
more goods are needed. Similarly, when production employees in stage III need more
inputs, they send a signal back to stage II. This signal triggers production activity in
McGraw-Hill/Irwin © 2009 The McGraw-Hill Companies, Inc.
5-6 Solutions Manual
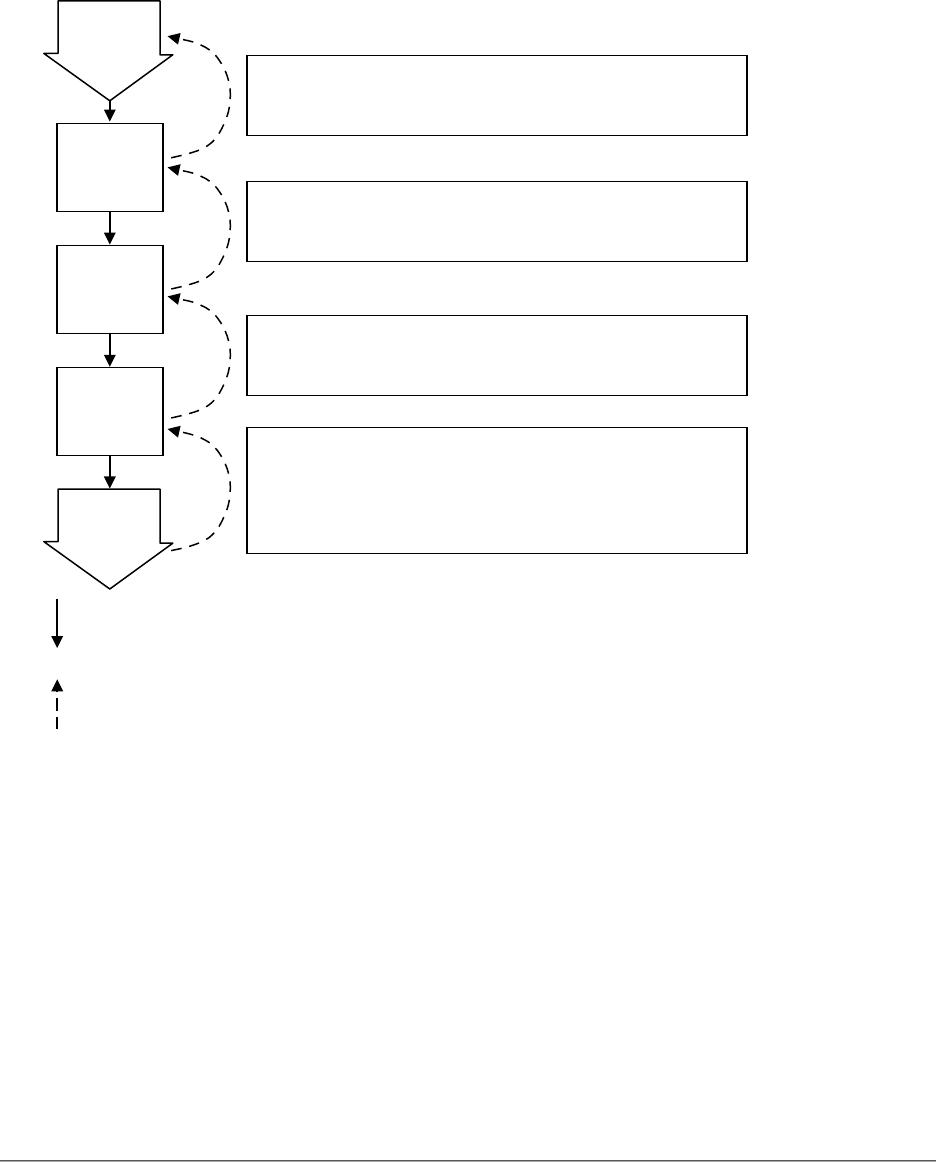
stage II. Working our way back up to the beginning of the process, purchases of raw
materials and parts are triggered by a signal that they are needed in stage I.
The “Pull” Method in a JIT System
This pull system of production management, which characterizes the JIT
approach, results in a smooth flow of production and significantly reduced inventory
levels.
McGraw-Hill/Irwin © 2009 The McGraw-Hill Companies, Inc.
Managerial Accounting, 8/e 5-7
Demand for raw materials and parts is signaled when
there is a need in stage I for more inputs.
Demand for production activity in stage I is signaled
when there is a need in stage II for more inputs.
Demand for production activity in stage II is signaled
when there is a need in stage III for more inputs.
Demand for finished goods is signaled when sales
activity warrants more finished units. This signal
triggers manufacturing activity in the final stage of
production (stage III).
Purchasing
Production
Stage I
Production
Stage II
Production
Stage III
Sales
Denotes flow of materials, parts, partially finished goods, and finished goods.
Denotes a signal that more goods are needed at the next stage of production.

Solutions to exercises
EXERCISE 5-26 (15 MINUTES)
1. Material-handling cost per mirror:
$1,500 250
*(30)(250)] [(30)(250)
$90,000
*The total number of direct-labor hours.
An alternative calculation, since both types of product use the same amount of the
cost driver, is the following:
$1,500
*60
$90,000
*The total number of units (of both types) produced.
2. Material-handling cost per lens = $1,500. The analysis is identical to that given for
requirement (1).
3. Material-handling cost per mirror:
$600
30
†
4
*16)(4
$90,000
*The total number of material moves.
†The number of material moves for the mirror product line.
4. Material-handling cost per lens:
$2,400
30
*16
16)(4
$90,000
*The number of material moves for the lens product line.
McGraw-Hill/Irwin © 2009 The McGraw-Hill Companies, Inc.
5-8 Solutions Manual

EXERCISE 5-27 (20 MINUTES)
There is no single correct answer to this exercise. There are many reasonable solutions.
Cost pool 1:
Raw materials and components…….………..………..………..….…..…..…....…..…. 3,835,000 yen
Inspection …………………………………………………………………………………………… 39,000 yen
Total……………………………………………………………………………..…….………………. 3,874,000 yen
Cost driver: raw-material cost
Cost pool 2:
Depreciation, machinery……………………………………………………………….……… 1,820,000 yen
Electricity, machinery………………………………………………………….……….………. 156,000 yen
Equipment maintenance, wages……………………………………………………….…… 195,000 yen
Equipment maintenance, parts……………………………………………………..………. 39,000 yen
Total……………………………………………………………………………..…….………………. 2,210,000 yen
Cost driver: number of units produced.
Cost pool 3:
Setup wages………………………………………………………………………………….…….. 52,000 yen
Total……………………………………………………………………………..…….………………. 52,000 yen
Cost driver: number of production runs.
Cost pool 4:
Engineering design………………………………………………………………………………. 793,000 yen
Total……………………………………………………………………………..…….………………. 793,000 yen
Cost driver: number of parts in a product.
McGraw-Hill/Irwin © 2009 The McGraw-Hill Companies, Inc.
Managerial Accounting, 8/e 5-9

EXERCISE 5-27 (CONTINUED)
Cost pool 5:
Depreciation, plant……………………………………………………………………………….. 910,000 yen
Insurance, plant…………………………………………………………….….…………………. 780,000 yen
Electricity, light…………………………………………………………………………………….. 78,000 yen
Custodial wages, plant…………………………………………………………..….…………. 52,000 yen
Property taxes…………………………………………………………………………..…………. 156,000 yen
Natural gas, heating………………………………………………………………………….….. 39,000 yen
Total……………………………………………………………………………..…….………………. 2,015,000 yen
Cost driver: for costs allocated to support departments, square footage; for costs
assigned to products, number of units produced.
EXERCISE 5-28 (5 MINUTES)
Cost pool 1: unit-level
Cost pool 2: unit-level
Cost pool 3: batch-level
Cost pool 4: product-sustaining-level
Cost pool 5: facility-level
EXERCISE 5-29 (15 MINUTES)
1. a. Quality-control costs assigned to the enamel paint line under the traditional
system:
Quality-control costs = 16% direct-labor cost
Quality-control
costs assigned to
enamel paint line = 16% $98,000
= $15,680
McGraw-Hill/Irwin © 2009 The McGraw-Hill Companies, Inc.
5-10 Solutions Manual

EXERCISE 5-29 (CONTINUED)
b. Quality-control costs assigned to the enamel paint line under activity-based
costing:
Quantity for Assigned
Activity Pool Rate Enamel Paint Cost
Incoming material inspection....... $23.00 per type..... 24 types…...... $ 552
In-process inspection..….............. .28 per unit...... 35,000 units... 9,800
Product certification……………....… 144.00 per order... 50 orders....... 7,200
Total quality-control costs assigned………………………………………………..… $17,552
2. The traditional product-costing system undercosts the enamel paint product line, with
respect to quality-control costs, by $1,872 ($17,552– $15,680).
EXERCISE 5-30 (20 MINUTES)
Wheelco’s product-costing system probably is providing misleading cost information to
management. A common problem in a traditional, volume-based costing system is that
high-volume products are overcosted and low-volume products are undercosted. There is
evidence of this in the exercise, since Wheelco’s competitors are selling the high-volume
DC16 wheel at a price lower than Wheelco’s reported manufacturing cost. In contrast,
Wheelco is selling its specialty JY16 wheel at a huge markup above the product’s reported
cost. An activity-based costing system probably would report a lower product cost for
wheel DC16 and a substantially higher cost for wheel JY16.
The president’s strategy of pushing the firm’s specialty products probably will
aggravate Wheelco’s problem even further. These products probably are not as profitable as
the firm’s traditional product-costing system makes them appear.
Recommendation: Install an activity-based costing system. If the new reported
product costs shift as suggested in the preceding comments, then lower the price on the
high-volume products, such as wheel DC16. The prices of the specialty wheels probably will
need to be raised. It is possible that Wheelco should discontinue low-volume products.
McGraw-Hill/Irwin © 2009 The McGraw-Hill Companies, Inc.
Managerial Accounting, 8/e 5-11

EXERCISE 5-31 (15 MINUTES)
1. Key features of an activity-based costing system:
(a) Two-stage procedure for cost assignment.
(b) Stage one: Establish activity cost pools.
(c) Stage two: Select cost drivers for each activity-cost pool. Then assign the costs
in each cost pool to the company’s product lines in proportion to the amount of
the related cost driver used by each product line.
2. As described in the answer to the preceding exercise, the new system probably will
reveal distortion in the firm’s reported product costs. In all likelihood, the high-volume
products are overcosted and the low-volume specialty products are undercosted.
3. Strategic options:
(a) Lower the prices on the firm’s high-volume products to compete more effectively.
(b) Increase the prices on low-volume specialty products.
(c) Consider eliminating the specialty product lines. This option may not be desirable
if there is a marketing need to produce a full product line. Also, the specialty
wheels may give Wheelco prestige.
EXERCISE 5-32 (20 MINUTES)
The activities of the Seneca Falls Winery may be classified as follows:
U: Unit-level
B: Batch-level
P: Product-sustaining-level
F: Facility-level
McGraw-Hill/Irwin © 2009 The McGraw-Hill Companies, Inc.
5-12 Solutions Manual

EXERCISE 5-32 (CONTINUED)
Activity Classification Activity Classification
(1) P (11) B
(2) P (12) B
(3) P (13) U
(4) P (14) U
(5) P (15) U
(6) P (16) U
(7) P (17) B
(8) B (18) F
(9) B (19) F
(10) B
McGraw-Hill/Irwin © 2009 The McGraw-Hill Companies, Inc.
Managerial Accounting, 8/e 5-13

EXERCISE 5-33 (30 MINUTES)
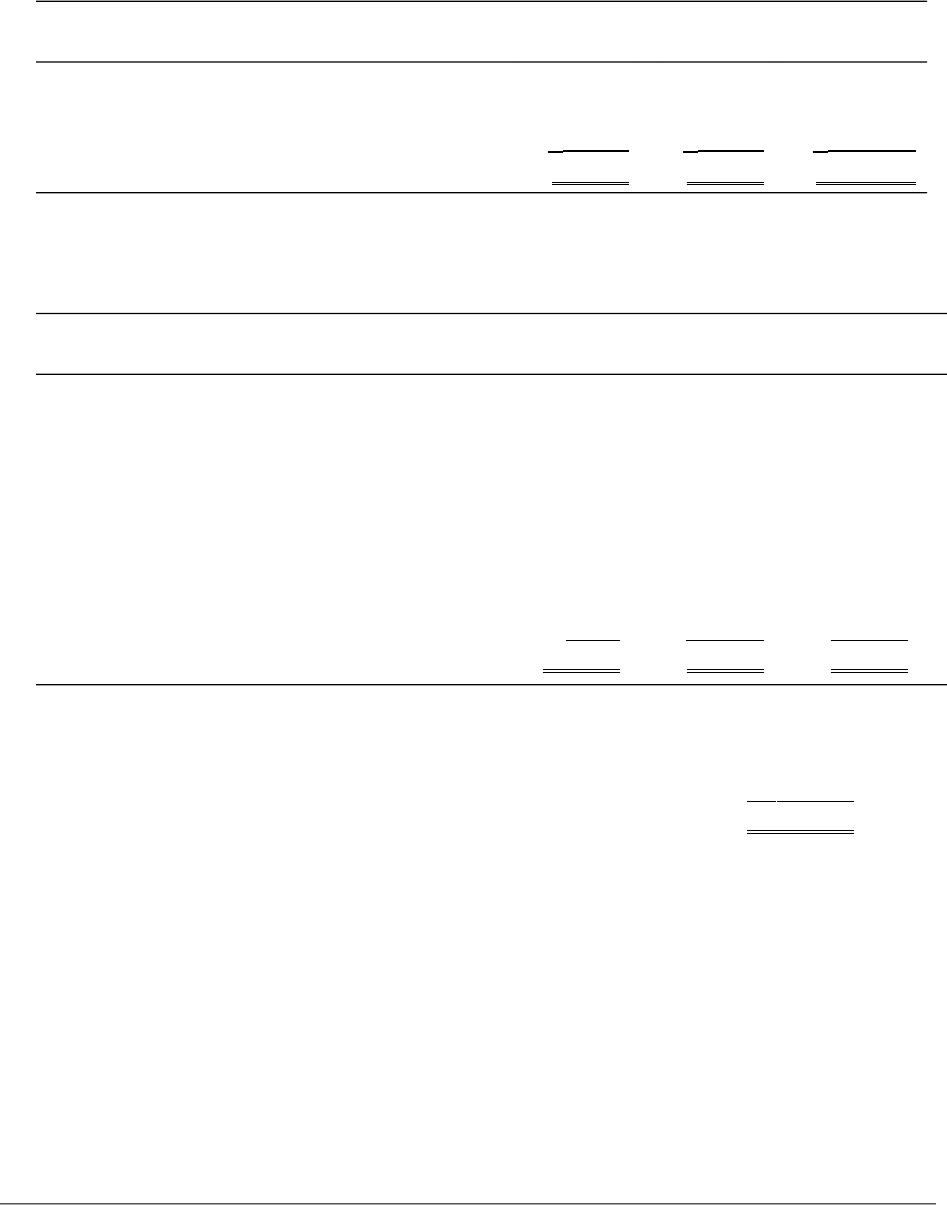
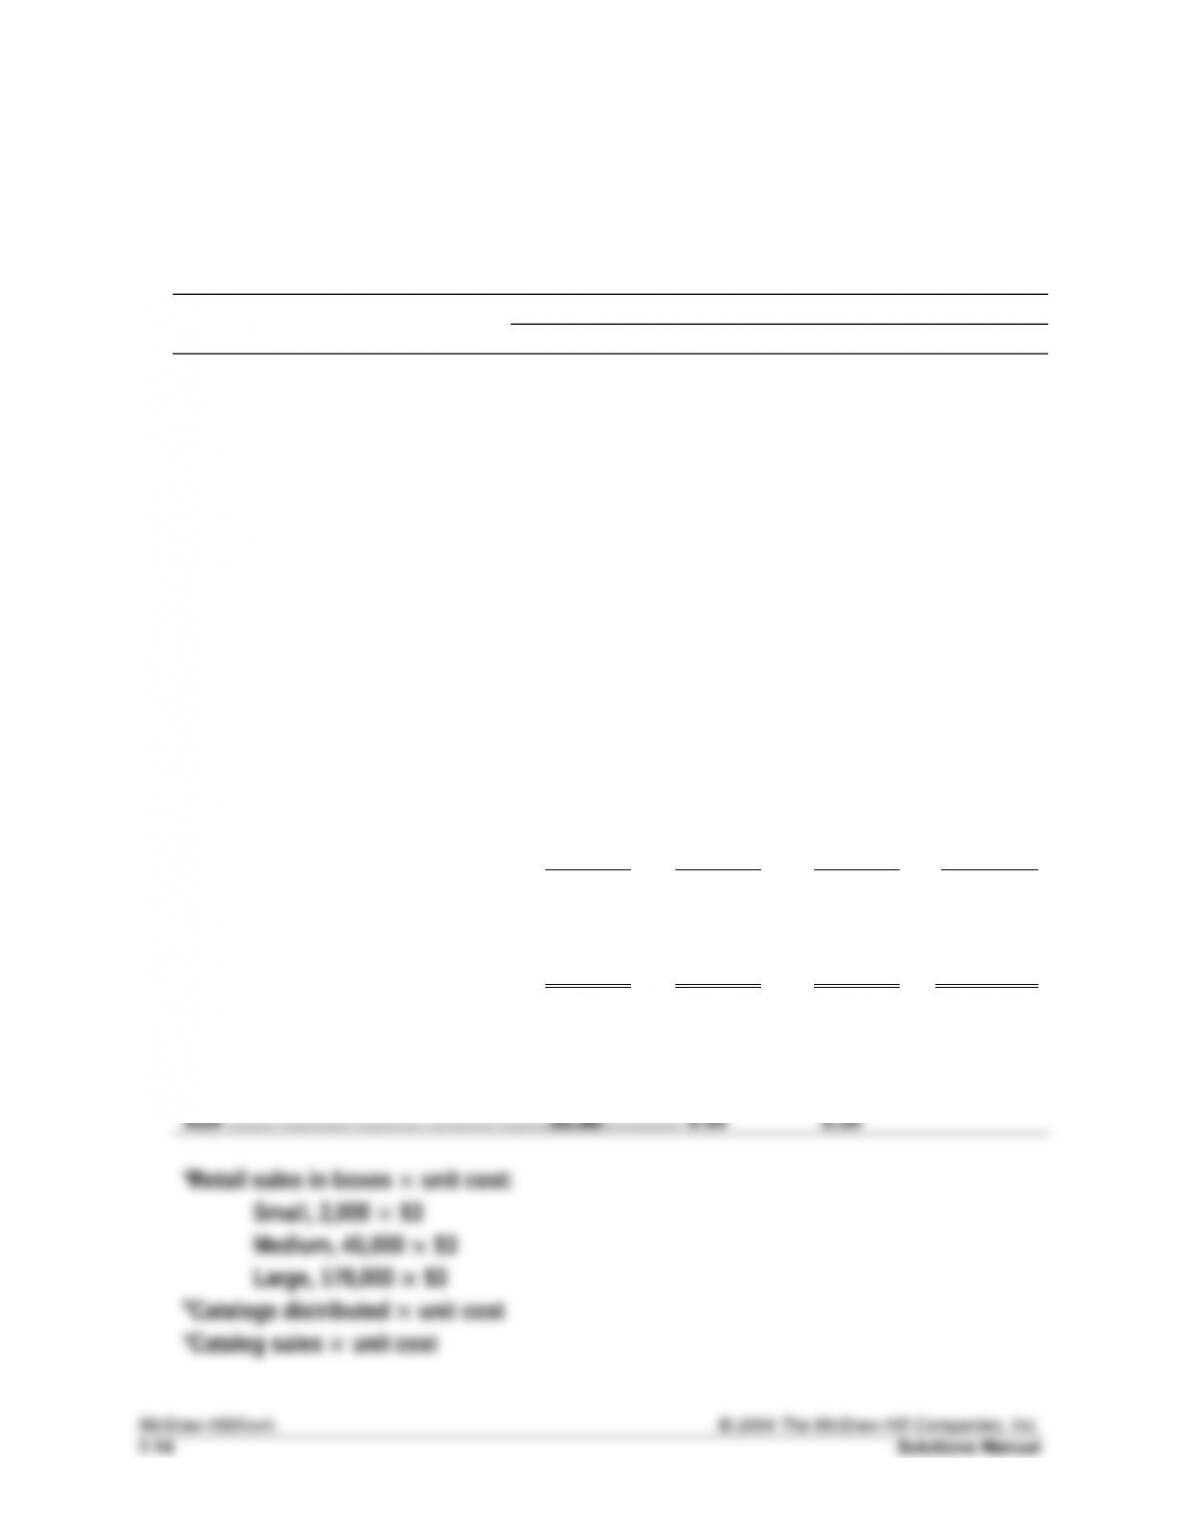
1. ZODIAC MODEL ROCKETRY COMPANY
COMPUTATION OF SELLING COSTS
BY ORDER SIZE AND PER MOTOR WITHIN EACH ORDER SIZE
Order Size
Small Medium Large Total
Sales commissionsa
(Unit cost: $675,000/225,000
= $3.00 per box)………………………………….…………
box)…………………………………………………………………
$ 6,000 $135,000 $534,000 $ 675,000
Catalogsb
(Unit cost: $295,400/590,800
= $.50 per catalog)……………………………….………..
catalog)………………………………………..………………...
127,150 105,650 62,600 295,400
Costs of catalog salesc
(Unit cost: $105,000/175,000
= $.60 per motor)………..………..……..…..…..…....…
skein)……………………………………………………………...
47,400 31,200 26,400 105,000
Credit and collectiond
(Unit cost: $60,000/6,000
= $10.00 per order)………..………..…..…..…....…..…
order)………………………………………………………………
4,850 24,150 31,000 60,000
Total cost for all orders of a
given size………..………..………..………..….…..…..…..…...$185,400 $296,000 $654,000 $1,135,400
Units (motors) solde……………..……..…..…..…..…....…..103,000 592,000 2,180,000
Unit cost per order of a given