Skittles Statistics
A Chi Square Analysis
Have you ever wondered why the package of Skittles you just bought never seems to
have enough of your favorite color? Or, why is it that you always seem to get the
package of mostly yellow Skittles? What’s going on at the Mars Company? Is the
number of the different colors of Skittles in a package really different from one package
to the next, or does the Mars Company do something to insure that each package gets the
correct number of each color of Skittles? You’ve probably stayed up nights pondering
this!
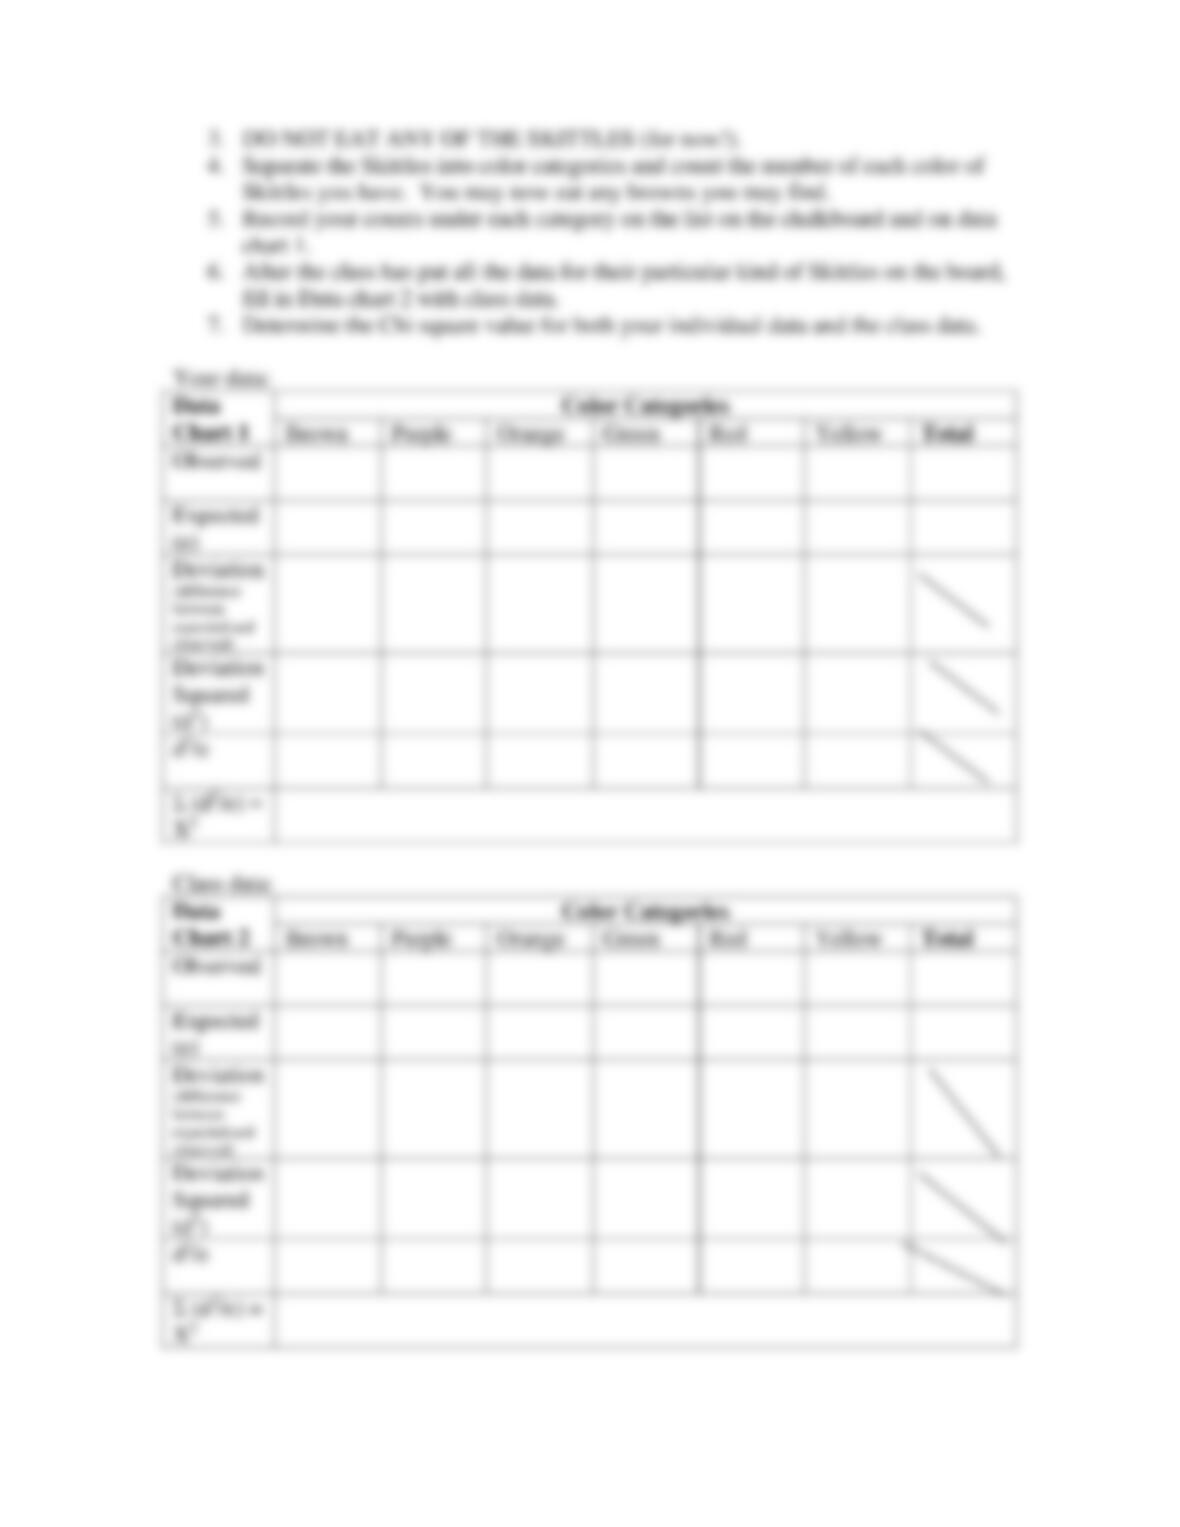
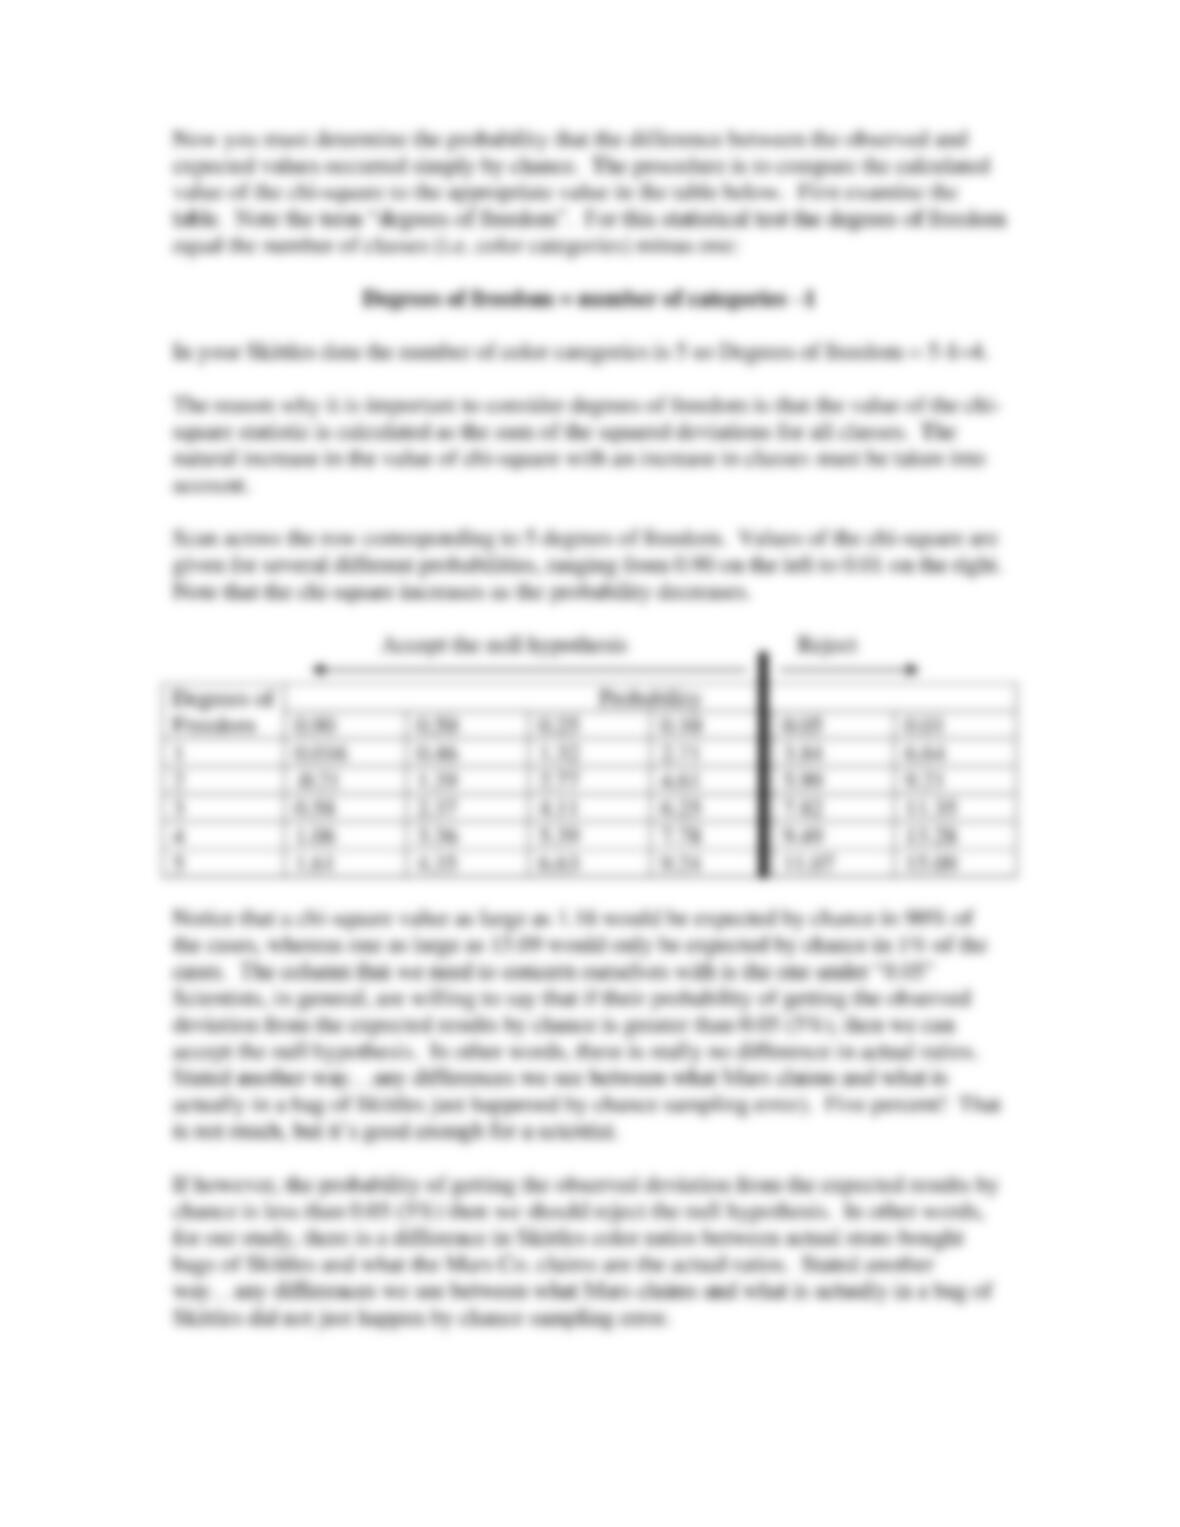
According to the Skittles website, there is an equal distribution of five different colors:
20% yellow, 20% Red, 20% purple, 20% green, and 20% orange.
One way that we could determine if the Mars Co. is true to its word is to sample a
package of Skittles and do a type of statistical test known as a “goodness of fit” test.
These type of statistical tests allow us to determine if any differences between our
observed measurements (counts of colors from our Skittles sample) and our expected
(what the Mars Co. claims) are simply due to chance sample error or some other reason
(i.e. the Mars Co.’s sorters aren’t really doing a very good job of putting the correct
number of Skittles in each package). The goodness of fit test we will be doing today is
called a Chi Square Analysis. This test is generally used when we are dealing with