1)
Refer to Figure 6-11. Which of the following statements is not correct?
a. A government-imposed price of $9 would be a binding price floor if market demand is Demand A and a binding price ceiling if market demand is Demand B.
b. A government-imposed price of $15 would be a binding price ceiling if market demand is either Demand A or Demand B.
c. A government-imposed price of $3 would be a binding price ceiling if market demand is either Demand A or Demand B.
d. A government-imposed price of $12 would be a binding price floor if market demand is Demand A and a non-binding price ceiling if market demand is Demand B.
Answer:
2) Refer to Table 3-2. Aruba should specialize in the production of
a. coolers and Iceland should specialize in the production of radios.
b. radios and Iceland should specialize in the production of coolers.
c. both goods and Iceland should specialize in the production of neither good.
d. neither good and Iceland should specialize in the production of both goods.
Answer:
3) Table 5-5
The following table shows a portion of the demand schedule for a particular good at various levels of income.
Price Quantity Demanded (Income = $5,000) Quantity Demanded (Income = $7,500) Quantity Demanded (Income = $10,000)
$24 2 3 4
$20 4 6 8
$16 6 9 12
$12 8 12 16
$8 10 15 20
$4 12 18 24
Refer to Table 5-5. Using the midpoint method, at a price of $16, what is the income elasticity of demand when income rises from $5,000 to $10,000?
a. 0.00
b. 0.50
c. 1.00
d. 1.50
Answer:
4) When an economist is asked a question like why is unemployment higher for teenagers than for older workers? the economist
a. is asked to explain the cause of an economic event.
b. is asked to recommend a policy to improve economic outcomes.
c. is asked as a policy adviser.
d. does not have enough information to respond.
Answer:
5) High-school athletes who skip college to become professional athletes
a. obviously do not understand the value of a college education.
b. usually do so because they cannot get into college.
c. understand that the opportunity cost of attending college is very high.
d. are not making a rational decision since the marginal benefits of college outweigh the marginal costs of college for high-school athletes.
Answer:
6) Refer to Table 3-5. If England and Spain each spends all its time producing the good in which it has a comparative advantage and the countries agree to trade 2 units of bread for 6 units of cheese, then England will consume
a. 34 units of cheese and 2 units of bread and Spain will consume 6 units of cheese and 3 units of bread.
b. 34 units of cheese and 2 units of bread and Spain will consume 16 units of cheese and 3 units of bread.
c. 34 units of cheese and 12 units of bread and Spain will consume 6 units of cheese and 3 units of bread.
d. 34 units of cheese and 12 units of bread and Spain will consume 16 units of cheese and 3 units of bread.
Answer:
7) Table 3-11
Assume that Falda and Varick can switch between producing wheat and producing cloth at a constant rate.
Quantity Produced in 1 Hour
Bushels of Wheat Yards of Cloth
Falda 8 12
Varick 6 15
Refer to Table 3-11. Varick has an absolute advantage in the production of
a. wheat.
b. cloth.
c. both goods.
d. neither good.
Answer:
8) If, at the current price, there is a shortage of a good, then
a. sellers are producing more than buyers wish to buy.
b. the market must be in equilibrium.
c. the price is below the equilibrium price.
d. quantity demanded equals quantity supplied.
Answer:
9) A macroeconomist – as opposed to a microeconomist – would study
a. the effects of rent control on housing in New York City.
b. the effects of foreign competition on the US auto industry.
c. the effects of borrowing by the federal government.
d. the effects of raising the gasoline tax on transit ridership.
Answer:
10) Which of the following was not a result of the luxury tax imposed by Congress in 1990?
a. The larger part of the tax burden fell on sellers.
b. A larger part of the tax burden fell on the middle class than on the rich.
c. Even the wealthy demanded fewer luxury goods.
d. The tax was never repealed or even modified.
Answer:
11)
Refer to Figure 4-19. All else equal, the premature deaths of thousands of turkeys would cause a move from
a. DA to DB.
b. DB to DA.
c. x to y.
d. y to x.
Answer:
12) In a particular country in 2000, the average worker needed to work 40 hours to produce 55 units of output. In that same country in 2008, the average worker needed to work 30 hours to produce 45 units of output. In that country, the productivity of the average worker
a. decreased by about 6 percent between 2000 and 2008.
b. remained unchanged between 2000 and 2008.
c. increased by about 9 percent between 2000 and 2008.
d. increased by about 18 percent between 2000 and 2008.
Answer:
13) Holding all other forces constant, if increasing the price of a good leads to a decrease in total revenue, then the demand for the good must be
a. unit elastic.
b. inelastic.
c. elastic.
d. None of the above is correct because a price increase always leads to an increase in total revenue.
Answer:
14) Efficiency is illustrated by
a. both the production possibilities frontier and the circular-flow diagram.
b. neither the production possibilities frontier nor the circular-flow diagram.
c. the production possibilities frontier only.
d. the circular-flow diagram only.
Answer:
15) Suppose that in Ireland total annual output is worth $600 million and people work 30 million hours. In Canada total annual output is worth $800 million and people work 50 million hours. Productivity is higher
a. in Ireland. Most variation in the standard of living across countries is due to differences in productivity.
b. in Ireland. Differences in productivity explain very little of the variation in the standard of living across countries.
c. in Canada. Most variation in the standard of living across countries is due to differences in productivity.
d. in Canada. Differences in productivity explain very little of the variation in the standard of living across countries.
Answer:
16) If the price of natural gas rises, when is the price elasticity of demand likely to be the highest?
a. immediately after the price increase
b. one month after the price increase
c. three months after the price increase
d. one year after the price increase
Answer:
17) The Economic Report of the President
a. discusses recent developments in the economy and presents analysis of current policy issues.
b. is written by the Council of Economic Advisers.
c. is the responsibility of the economists at the Office of Management and Budget.
d. Both a and b are correct.
Answer:
18) The price elasticity of supply measures how much
a. the quantity supplied responds to changes in input prices.
b. the quantity supplied responds to changes in the price of the good.
c. the price of the good responds to changes in supply.
d. sellers respond to changes in technology.
Answer:
19) Communist countries worked under the premise that
a. markets were the best way to organize economic activity.
b. central planners were in the best position to determine the allocation of scarce resources in the economy.
c. households and firms, guided by an invisible hand, could achieve the most efficient allocation of scarce resources.
d. allowing the market forces of supply and demand to operate with no government intervention would achieve the most efficient allocation of scarce resources.
Answer:
20) 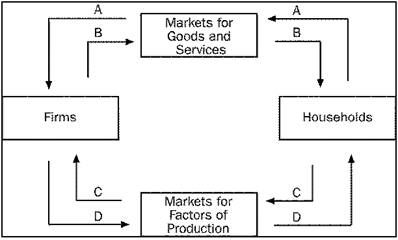
Refer to Figure 2-1. Which arrow represents the flow of goods and services?
a. A
b. B
c. C
d. D
Answer:
21) If sellers expect higher basket prices in the near future, the current
a. supply of baskets will increase.
b. supply of baskets will decrease.
c. supply of baskets will be unaffected.
d. demand for baskets will decrease.
Answer:
22) Refer to Table 3-5. Assume that England and Spain each has 40 labor hours available. Originally, each country divided its time equally between the production of cheese and bread. Now, each country spends all its time producing the good in which it has a comparative advantage. As a result, the total output of cheese increased by
a. 15.
b. 20.
c. 25.
d. 40.
Answer:
23) Factors of production are
a. used to produce goods and services.
b. also called output.
c. abundant in most economies.
d. assumed to be owned by firms in the circular-flow diagram.
Answer:
24) Refer to Table 2-5. Table 2-5 shows one set of production possibilities. What is the opportunity cost of increasing the production of cookies from 200 dozen to 400 dozen?
a. 100 pounds of coffee
b. 200 pounds of coffee
c. 300 pounds of coffee
d. 400 pounds of coffee
Answer:
25) The ordered pair that represents the origin on a graph is
a. (1, 1).
b. (0, 0).
c. (-1, -1).
d. (![]() ).
).
Answer:
26) 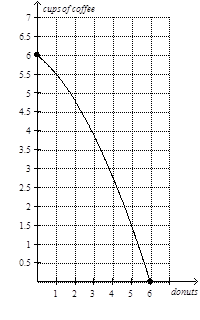
Refer to Figure 2-8, Panel (a). In order to gain 2 donuts by moving from point L to point M, society must sacrifice
a. efficiency.
b. employment.
c. 4 cups of coffee.
d. More than one of the above is correct.
Answer:
27) An assumption an economist might make while studying international trade is
a. there are only two countries.
b. countries only produce two goods.
c. technology does not change.
d. All of the above are possible assumptions.
Answer:
28) The primary determinant of a country’s standard of living is
a. the countrys ability to prevail over foreign competition.
b. the countrys ability to produce goods and services.
c. the total supply of money in the economy.
d. the average age of the country’s labor force.
Answer:
29) Penny is piano teacher and Dan is a tile layer. If Penny teaches Dans daughter to play the piano in exchange for Dan tiling her kitchen floor,
a. only Penny is made better off by trade.
b. only Dan is made better off by trade.
c. both Penny and Dan are made better off by trade.
d. neither Penny nor Dan are made better off by trade.
Answer:
30)
Refer to Figure 6-2. The price ceiling
a. is binding.
b. causes a shortage.
c. causes the quantity demanded to exceed the quantity supplied.
d. All of the above are correct.
Answer:
31) The following table contains a demand schedule for a good.
Price Quantity Demanded
$10 100
$20 Q1
If the law of demand applies to this good, then Q1 could be
a. 0.
b. 100.
c. 200.
d. 400.
Answer:
32) To increase living standards, public policy should
a. ensure that workers are well educated and have the necessary tools and technology.
b. make unemployment benefits more generous.
c. move workers into jobs directly from high school.
d. ensure a greater degree of equality, taking all income-earners into account.
Answer:
33) Assume for Namibia that the opportunity cost of each hut is 200 bowls. Which of these pairs of points could be on Namibia’s production possibilities frontier?
a. (200 huts, 30,000 bowls) and (150 huts, 35,000 bowls)
b. (200 huts, 40,000 bowls) and (150 huts, 30,000 bowls)
c. (300 huts, 50,000 bowl) and (200 huts, 60,000 bowls)
d. (300 huts, 60,000 bowls) and (200 huts, 80,000 bowls)
Answer:
34)
Refer to Figure 4-19. All else equal, a large number of people becoming vegetarians would cause a move from
a. DA to DB.
b. DB to DA.
c. x to y.
d. y to x.
Answer:
35) An example of a perfectly competitive market would be the
a. cable TV market.
b. soybean market.
c. breakfast cereal market.
d. shampoo market.
Answer:
36) A microeconomist as opposed to a macroeconomist might study
a. the effect of borrowing by the federal government on the inflation rate.
b. the effect of rising oil prices on employment in the airline industry.
c. changes in the nations unemployment rate over short periods of time.
d. alternative policies to promote higher living standards throughout the nation.
Answer:
37) Choosing not to attend a concert so that you can study for your exam is an example of a tradeoff.
Answer:
38) The production possibilities frontier is a graph that shows the various combinations of outputs that the economy can possibly produce given the available factors of production and the available production technology.
Answer:
39) In an unregulated labor market, the wage adjusts to balance labor supply and labor demand.
Answer:
40) In the markets for goods and services in the circular-flow diagram, households are buyers and firms are sellers.
Answer:
41) When a variable that is named on an axis of a graph changes, the curve shifts.
Answer:
42) Economists at the U.S. Department of the Treasury help design U.S. coins and paper money.
Answer:
43) A binding minimum wage raises the incomes of some workers, but it lowers the incomes of workers who cannot find jobs.
Answer: