Unlock document.
This document is partially blurred.
Unlock all pages and 1 million more documents.
Get Access
11 International Agreements: Trade, Labor, and the Environment
1. In Application: The Trans-Pacific Partnership, we summarized some of the
provisions of TPP and the views of consumer and environmental groups. The text of the
TPP agreement is available at: https://ustr.gov/tpp/#text. We will use that text to dig deeper
into the agreement
a. Consider the provisions listed in the Application, namely: Dispute Settlement,
Intellectual Property Protection, Labor Rights, Environmental Protection, and
Tariffs and Rules of Origin. For each of these items, which chapter of TPP would
cover that topic?
b. For each of these topics, scan the chapter to find the sections that discuss the key
features of each provision, as we have summarized it in the Application. List the
sentence(s) of the TPP text that support our summary in the Application. In
addition, describe one other feature of each provision that we have not mentioned
in the Application.
Answer: Answers will vary.
c. In the Application we also discussed the views of consumer and environmental
groups. For each provision, go online to find a statement from one group that
either supports or does not support each provision, and include these statements
with your answer.
Answer: Answers will vary.
2. a. How is a customs union different from a free-trade area? Provide examples of
each.
b. Why do some economists prefer multilateral trade agreements over regional trade
agreements?
Answer: Regional trade agreements may lead to trade diversion when a member
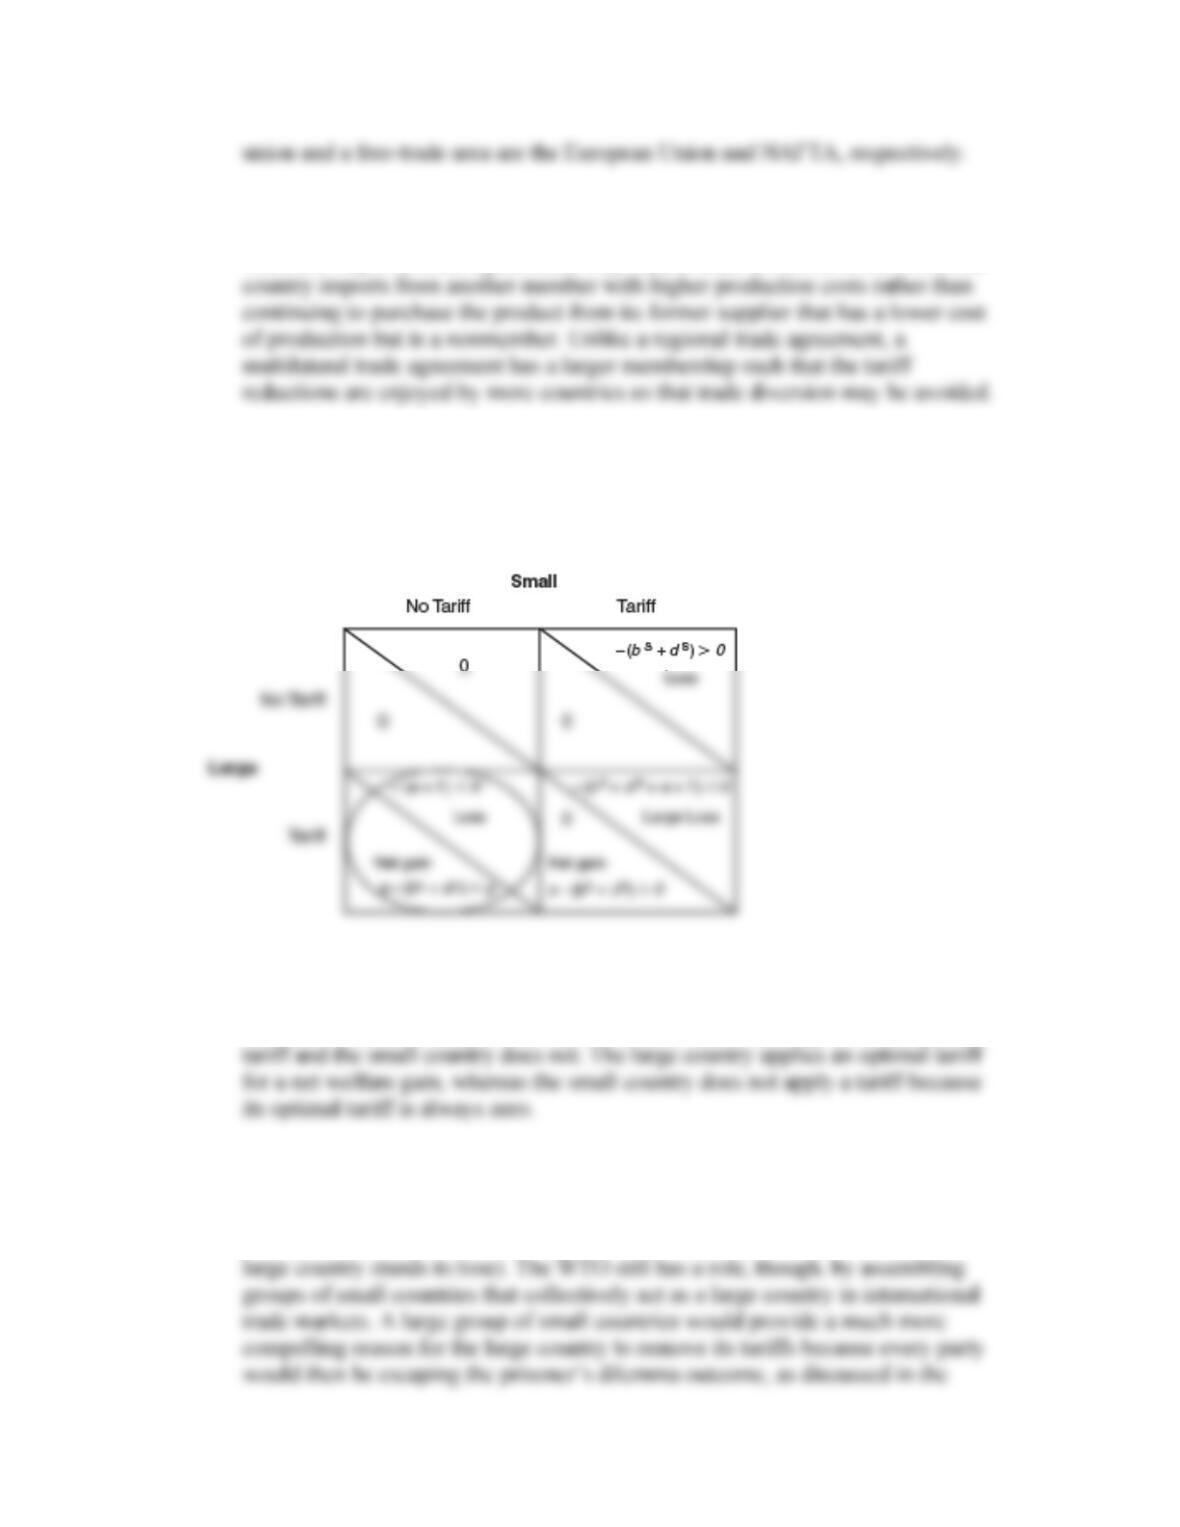
3. Figure 11-2 shows the tariff game between Home and Foreign, both large countries.
a. Redraw the payoff matrix for a game between a large and small country.
Answer:
b. What is/are the Nash equilibrium/equilibria, assuming that the large country
applies an optimal tariff?
Answer: There is a unique Nash equilibrium in which the large country applies a
c. What does your answer to (b) tell you about the role of the WTO in a situation
like this?
Answer: The WTO has a more difficult job in this case because only the small
country stands to gain by switching to the free-trade equilibrium (whereas the
Work It Out
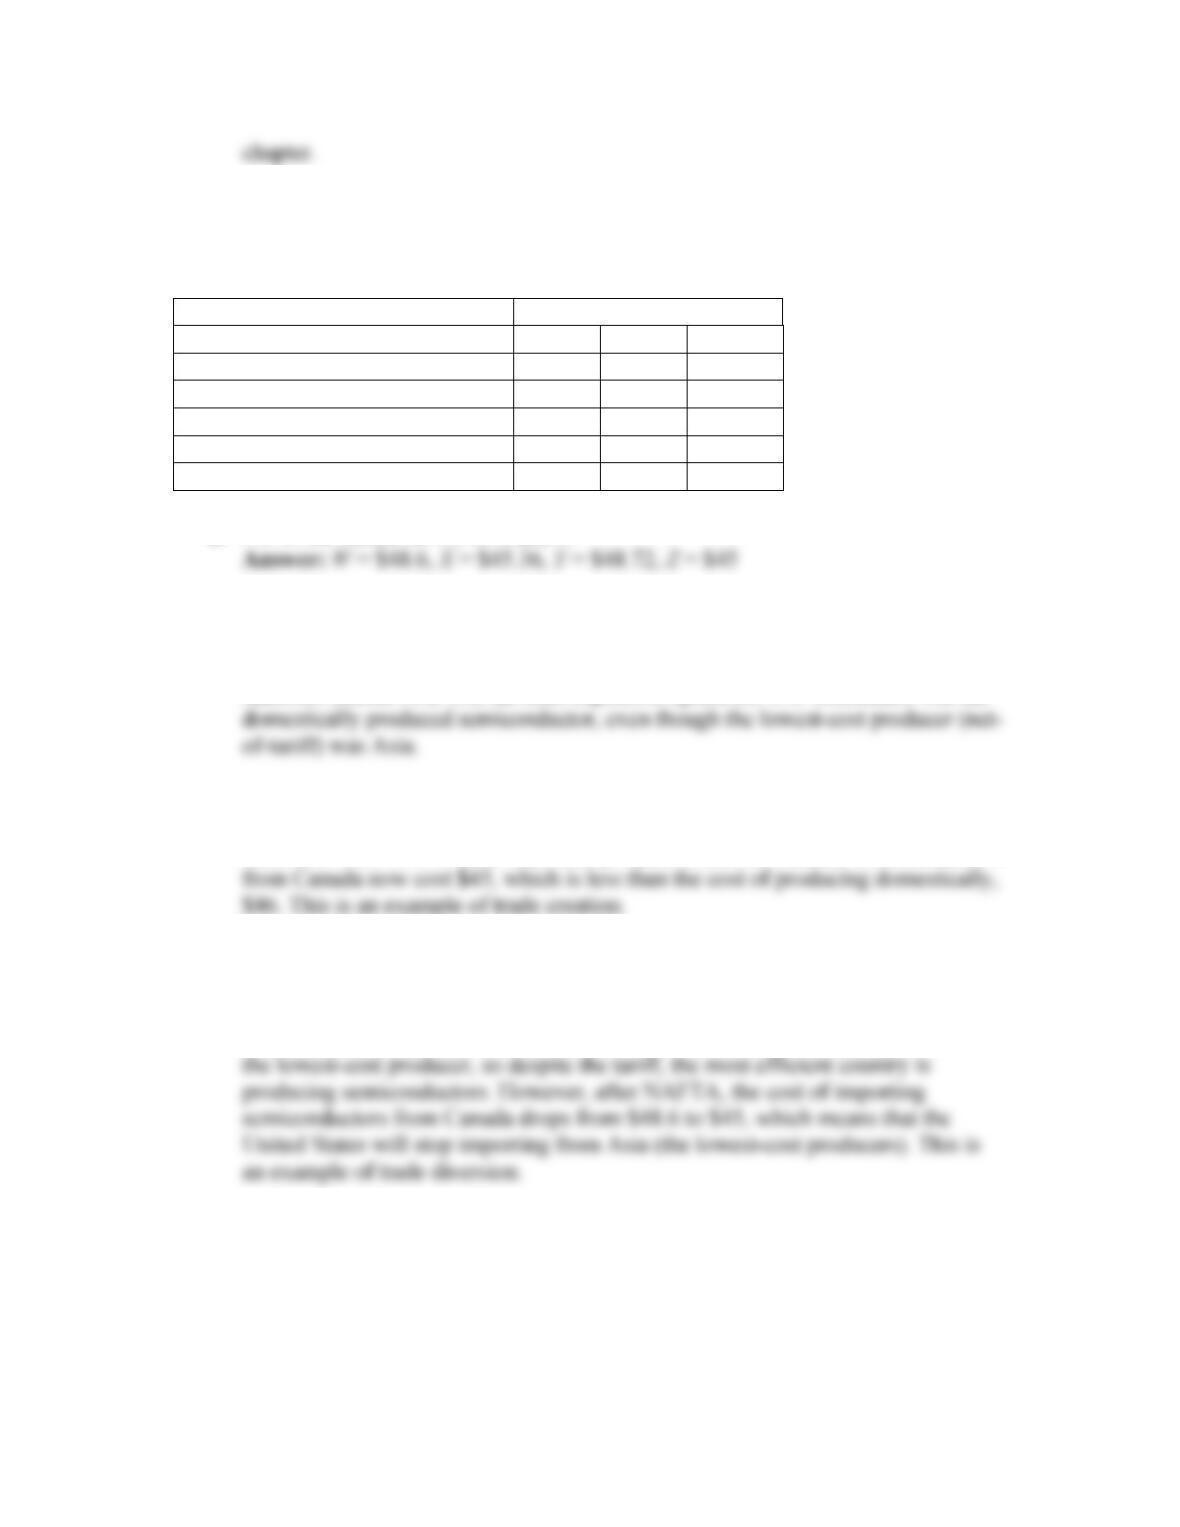
Consider the following variation of Table 11-1 for the U.S. semiconductor market:
U.S. Tariff
0%
8%
16%
From Canada, before NAFTA
$45
$W
$52.2
From Asia, before NAFTA
$40
$X
$Y
From Canada, after NAFTA
$43
$Z
$Z
From Asia, after NAFTA
$40
$X
$Y
From the United States
$46
$46
$46
a. Fill in the values for W, X, Y, and Z.
b. Suppose that before NAFTA, the United States had a 16% tariff on imported
semiconductors. Which country supplied the U.S. market? Is it the lowest-cost
producer?
Answer: Before NAFTA, the least expensive option for U.S. consumers was the
c. After NAFTA, who supplies the U.S. market? Has either trade creation or
diversion occurred because of NAFTA? Explain.
Answer: After NAFTA, the least cost producer becomes Canada. Semiconductors
d. Now suppose that before NAFTA, the United States had an 8% tariff on imported
semiconductors. Then repeat parts (b) and (c).
Answer: If the United States had an 8% tariff, before NAFTA the United States
would import semiconductors from Asia at a cost of $45.36. In this case, Asia is
e. In addition to the assumptions made in (d), consider the effect of an increase in
high-technology investment in Canada due to NAFTA, allowing Canadian firms
to develop better technology. As a result, three years after the initiation of
NAFTA, Canadian firms can begin to sell their products to the United States for
$40. What happens to the U.S. trade pattern three years after NAFTA? Has either
trade creation or diversion occurred because of NAFTA? Explain.
Answer: Refer to Figure 11-3. With better technology, marginal cost of
production significantly reduces for Canada so that its supply curve shifts out.
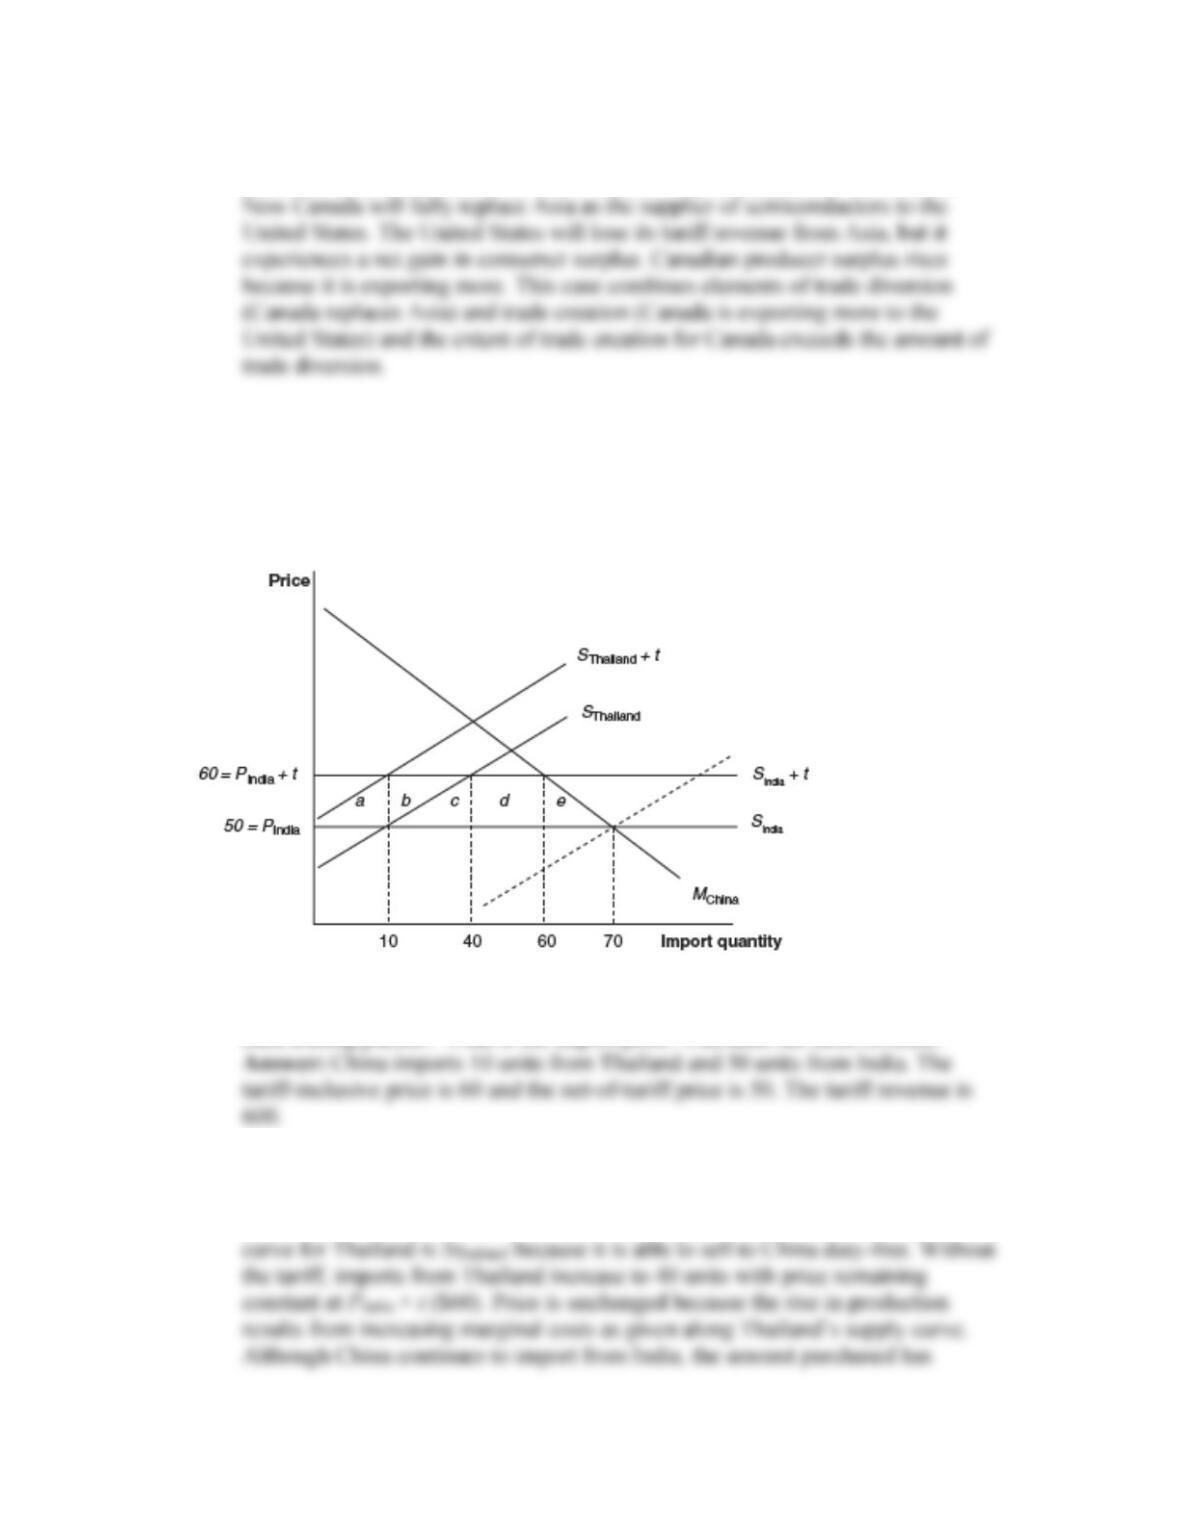
4. Assume that Thailand and India are potential trading partners of China. Thailand is a
member of ASEAN but India is not. Suppose the import price of textiles from India
(PIndia) is 50 per unit under free trade and is subject to a 20% tariff. As of January 1,
2010, China and Thailand entered into the China–ASEAN free-trade area, eliminating
tariffs on Thai imports. Use the following figure to answer the questions:
a. Before the China–ASEAN free-trade area, how much does China import from
each trading partner? What is the import price? Calculate the tariff revenue.
b. After the China–ASEAN free-trade area, how much does China import from each
trade partner? What is the import price? What is the total tariff revenue of China?
Answer: After the China–ASEAN free-trade agreement, the relevant supply
c. Based on your answer to part (b), what is the impact of the China–ASEAN free-
trade area on the welfare of China?
Answer: China is paying the same import price as before, but has lost the tariff
d. What is the effect of the China–ASEAN free-trade area on the welfare of
Thailand and India?
Answer: India has a producer surplus loss because it is selling less yet still
e. The China-ASEAN agreement may lead to a similar one between China and
India. How would this affect China’s imports from each country? What would be
the effect on welfare in China, Thailand, and India if such an agreement was
signed?
Answer: If China and India sign a free-trade agreement, the relevant supply
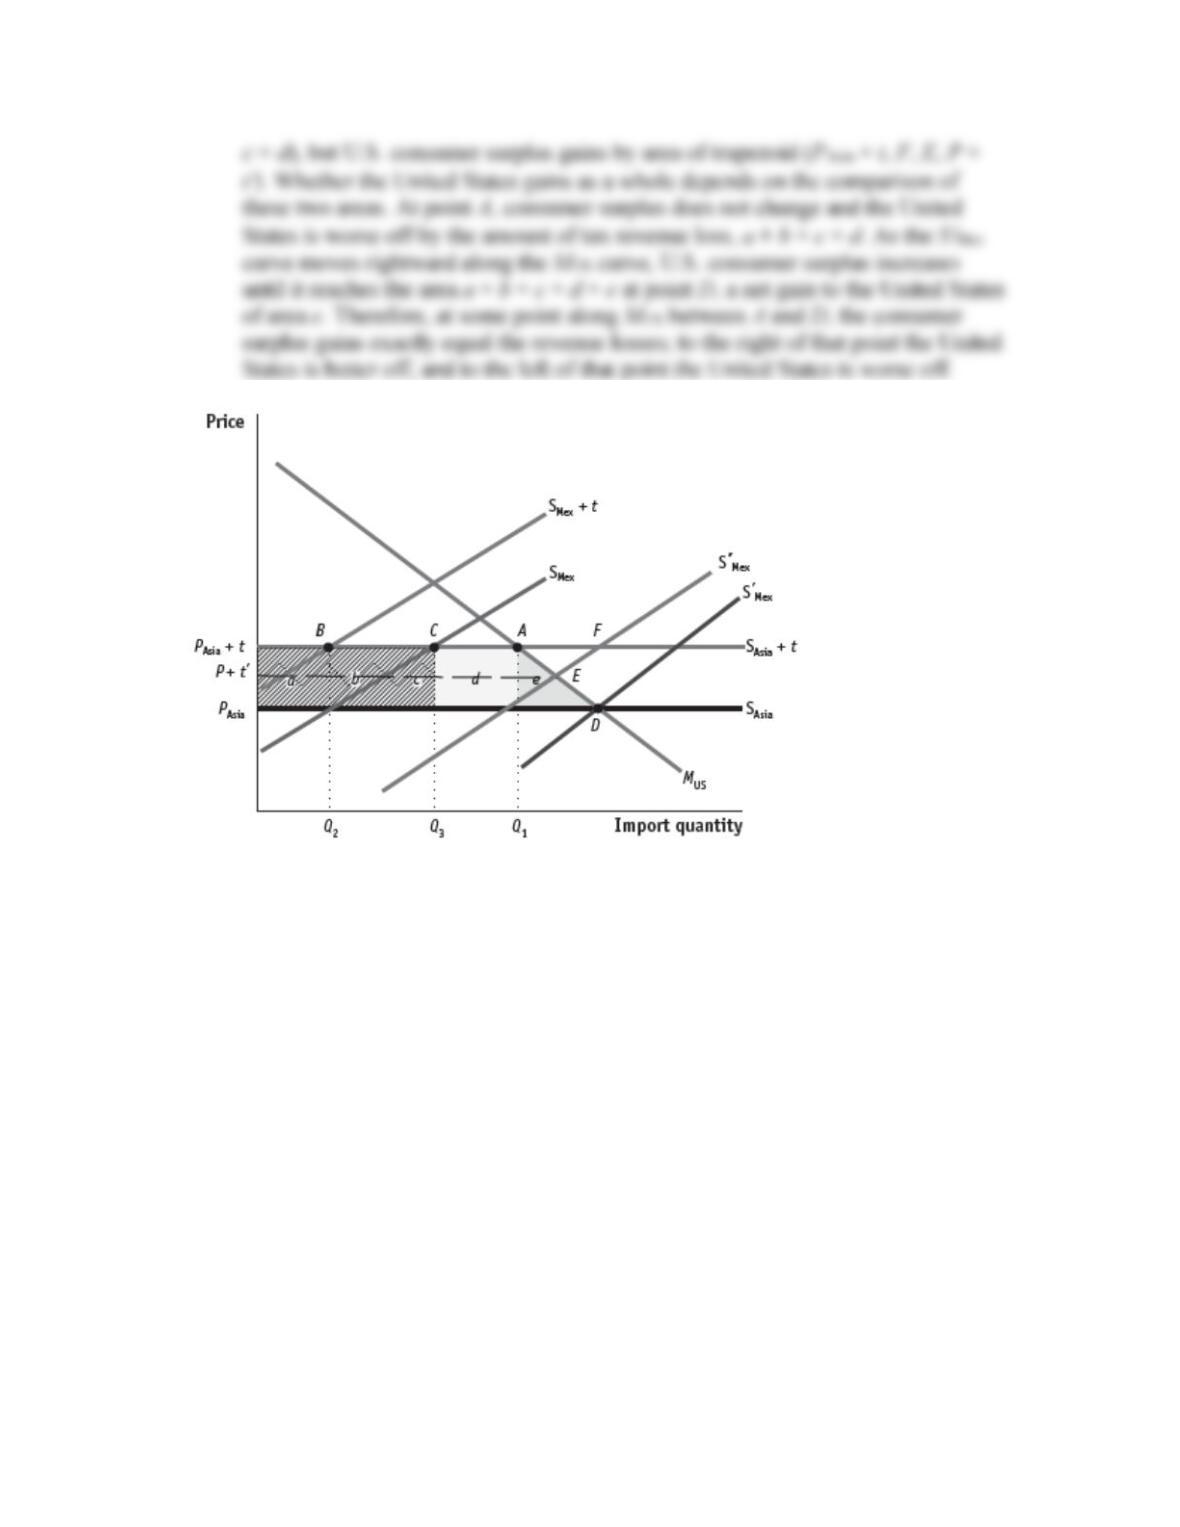
5. Redraw the graph of trade diversion (Figure 11-3) with the S
′
Mex curve intersecting
the MUS curve between points A and D.
a. When the United States and Mexico join NAFTA, who supplies auto parts to the
United States? Does the United States import a larger quantity of auto parts after
NAFTA; that is, does trade creation occur?
Answer: Because Mexico can now produce at a lower price than Asia with tariff,
b. What is the change in government revenue compared with before NAFTA?
c. Is the United States better off for joining NAFTA?
6. Refer to the survey in Table 11-2 regarding consumers’ attitudes toward working
conditions.
a. Fill in the survey questions for yourself and at least five friends.
Answer: Answers will vary.
b. Average your results and compare them with those in Table 11-2. Are there any
consistent differences in the answers from your friends and those in Table 11-2?
Answer: Answers will vary.
c. Do the answers from your friends show the following two characteristics?
i. Many people are willing to pay at least a small amount to ensure good labor
standards (or simply switch to an alternative with the same price), though
relatively few are willing to pay a lot.
ii. Individuals had to receive a higher discount to purchase a T-shirt made under
poor conditions than they were willing to pay for a T-shirt made under good
conditions.
Explain whether these characteristics apply to your friends.
Answer: Answers will vary.
7. Using Table 11-3, explain why environmentalists have “lost the battle but won the
war” in their dealings with the WTO. Refer to specific WTO cases in your answer.
Answer: In many instances, the WTO dispute settlement body has ruled against the
8. Refer to Figure 11-4 when answering this question.
a. Redraw Figure 11-4, panel (a), assuming that the production externality is
positive so that the SMC curve lies below the supply curve. Label the area c that
reflects the change in the cost of the externality when trade is opened. Is this area
an additional social gain from free trade or an offsetting cost?
Can you think of a real-world example of this case?
b. Redraw Figure 11-4, panel (b), assuming that the consumption externality is
positive so that the SMB curve lies above the demand curve. Label the area d that
arises when trade is opened, and explain why this area is an additional social gain
from free trade. (You can refer to the discussion of solar panels earlier in the
chapter.)
Answer:
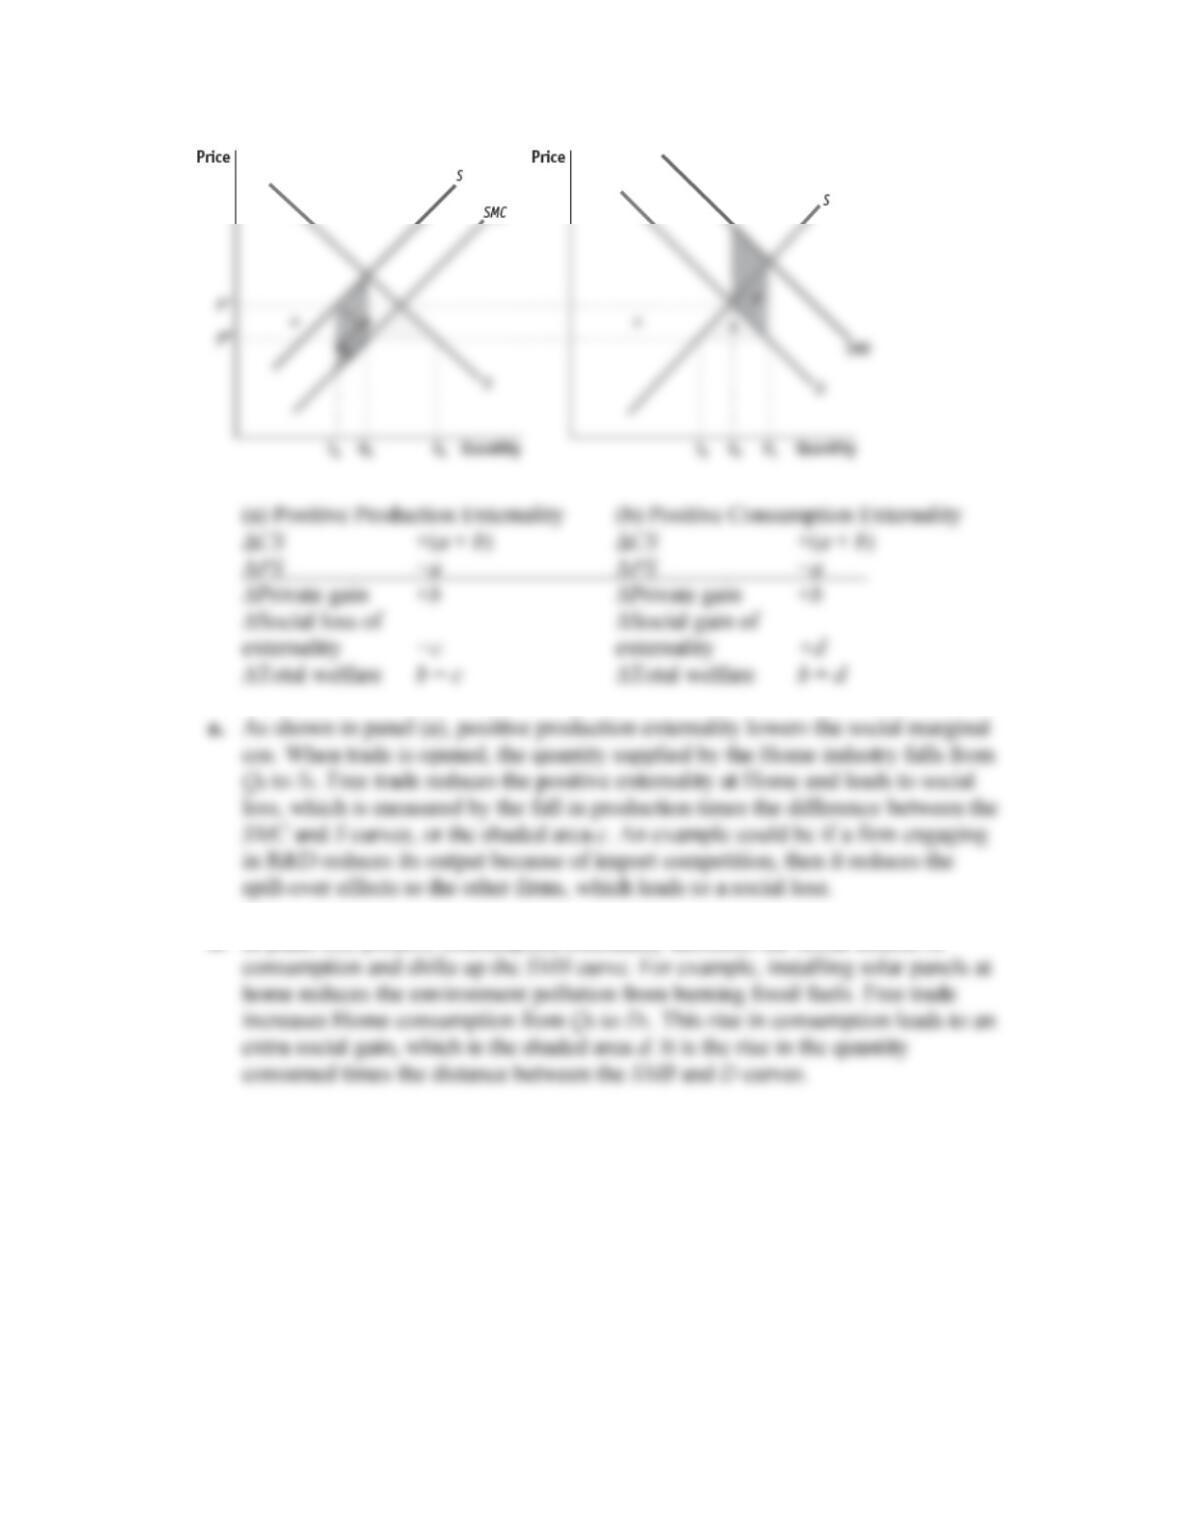
b. In panel (b), positive consumption externality increases the social benefit of
9. Refer to following variations of the payoff matrix for the environmental game shown
in Figure 11-7. In this problem, a number is assigned to represent the welfare level of
each outcome for Home and Foreign.
a. First, consider the case of global pollution, in which the government puts more
weight on producer profits than consumer well-being when calculating welfare
(this is so since a portion of consumer costs are borne by the other country). How
can you tell that the government favors producers over consumers from the
following payoff matrix? What is the Nash equilibrium for this environmental
game? Is it a prisoner’s dilemma? Briefly explain.
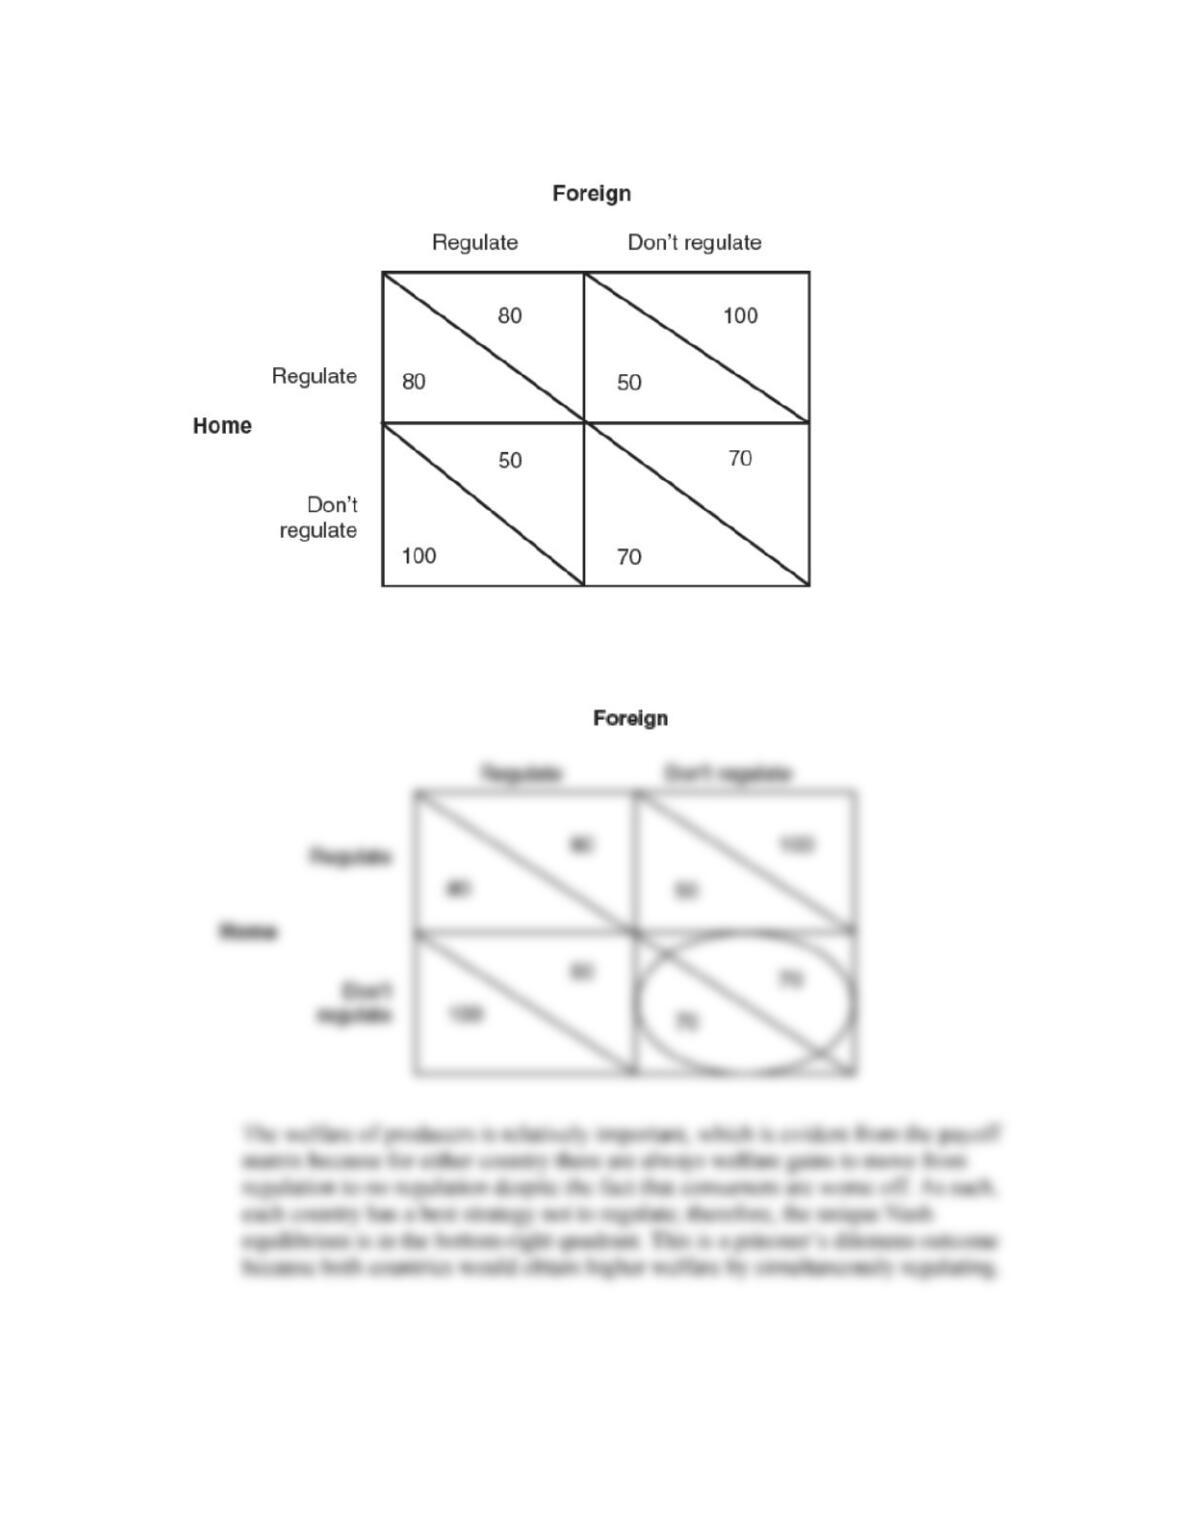
Answer:
b. Next, consider the case of local pollution in which the government puts more
weight on consumer well-being than producer profits when calculating welfare.
How can you tell that the government favors consumers over producers from the
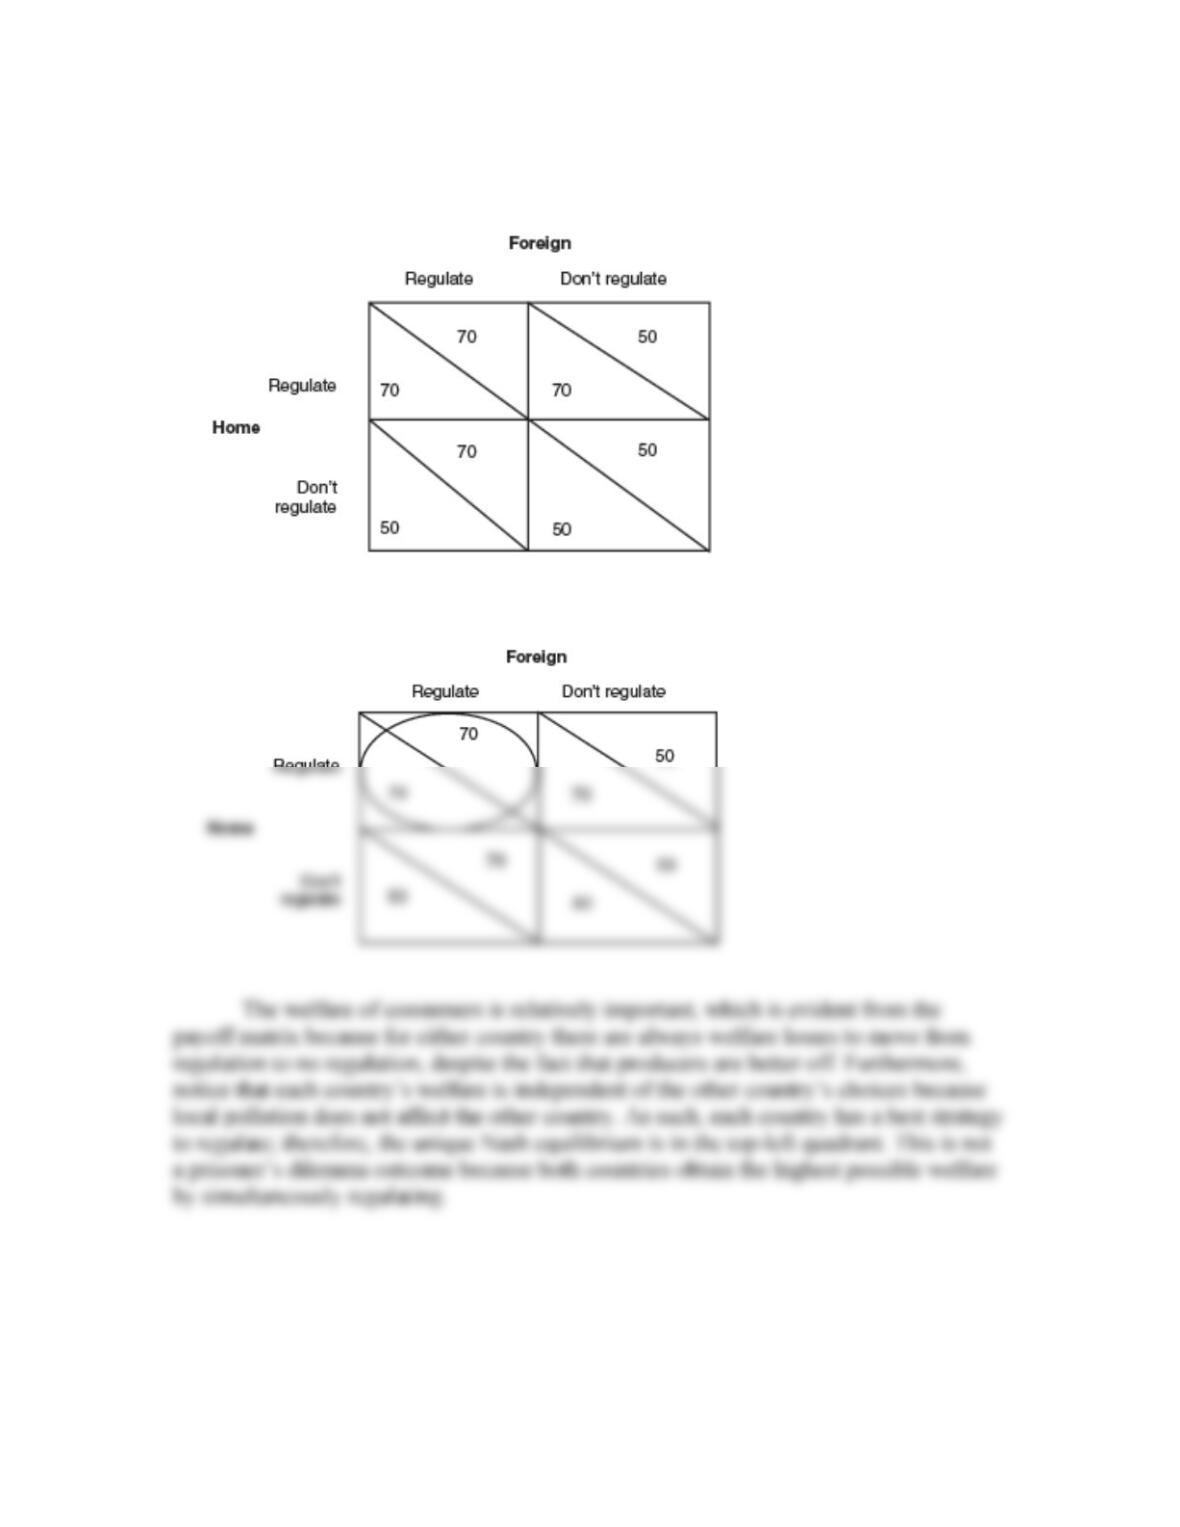
following payoff matrix? What is the Nash equilibrium for this environmental
game? Is it a prisoner’s dilemma? Briefly explain.
Answer:


