Unlock document.
This document is partially blurred.
Unlock all pages and 1 million more documents.
Get Access
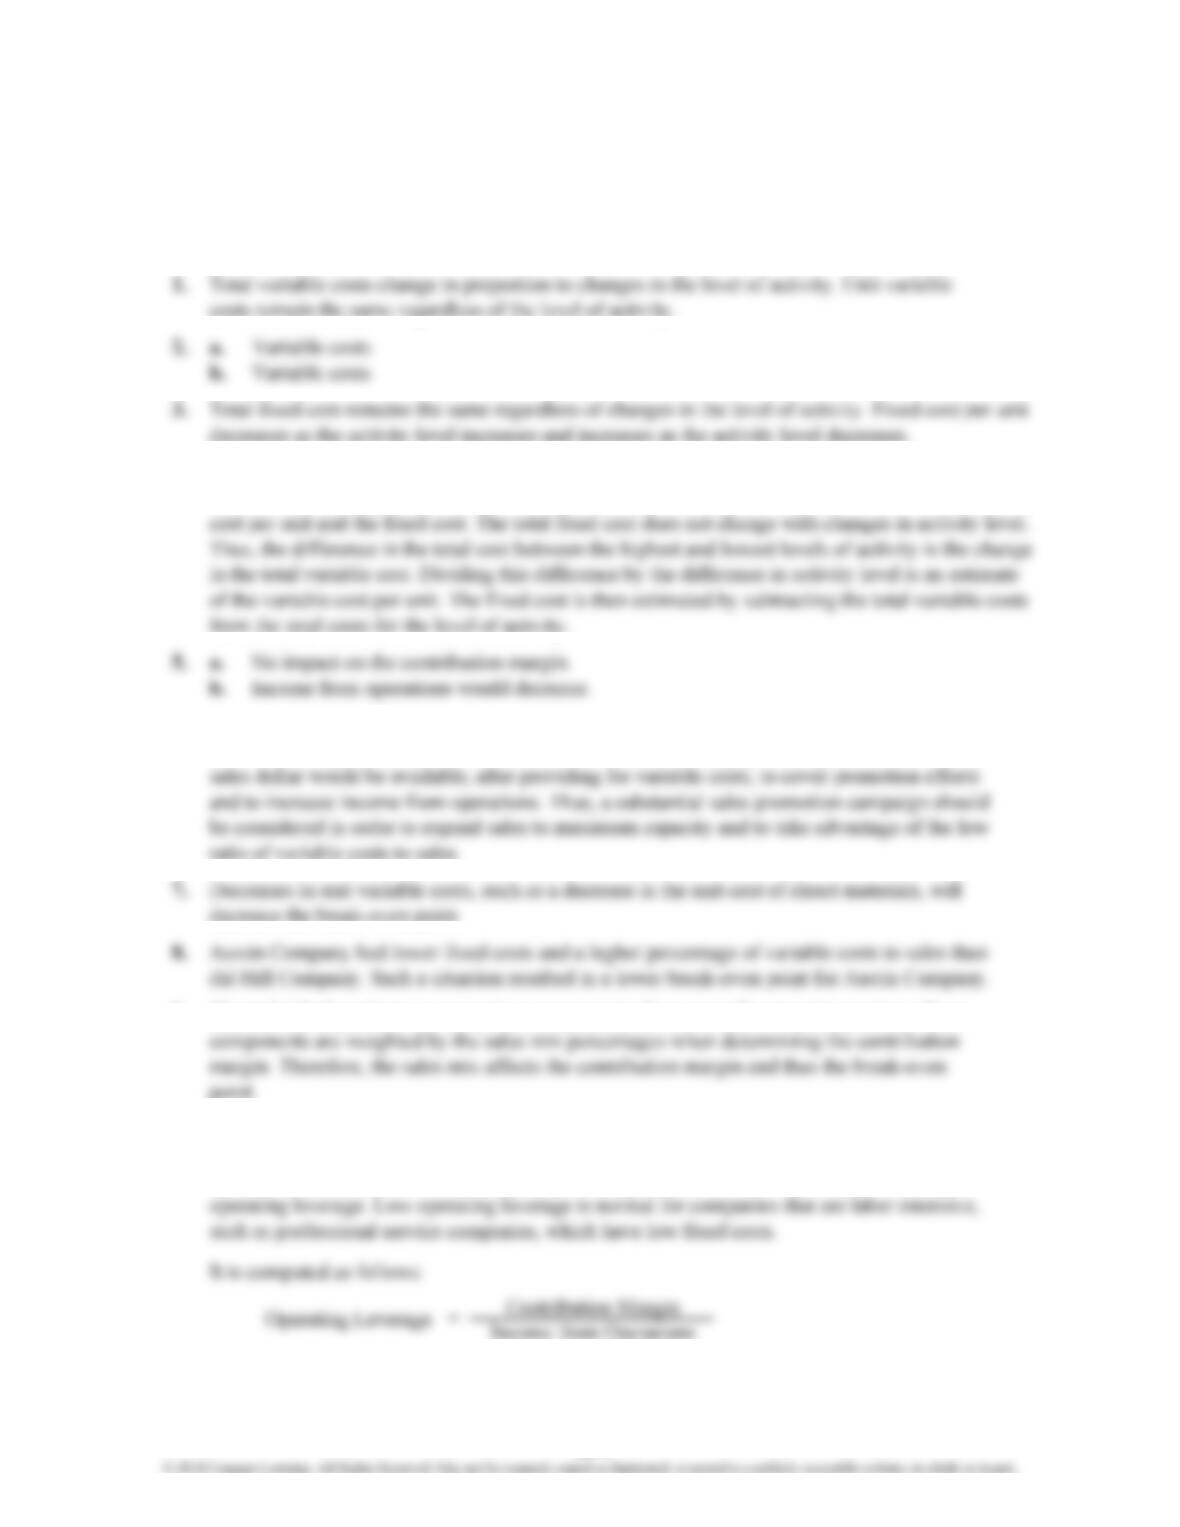
4. Mixed costs are costs that have characteristics of both a variable and a fixed cost. The high-low
method uses the highest and lowest activity levels and their related costs to estimate the variable
6. A high contribution margin ratio, coupled with idle capacity, indicates a potential for increased
income from operations if additional sales can be made. A large percentage of each additional
9. The individual products are treated as components of one overall enterprise product. These
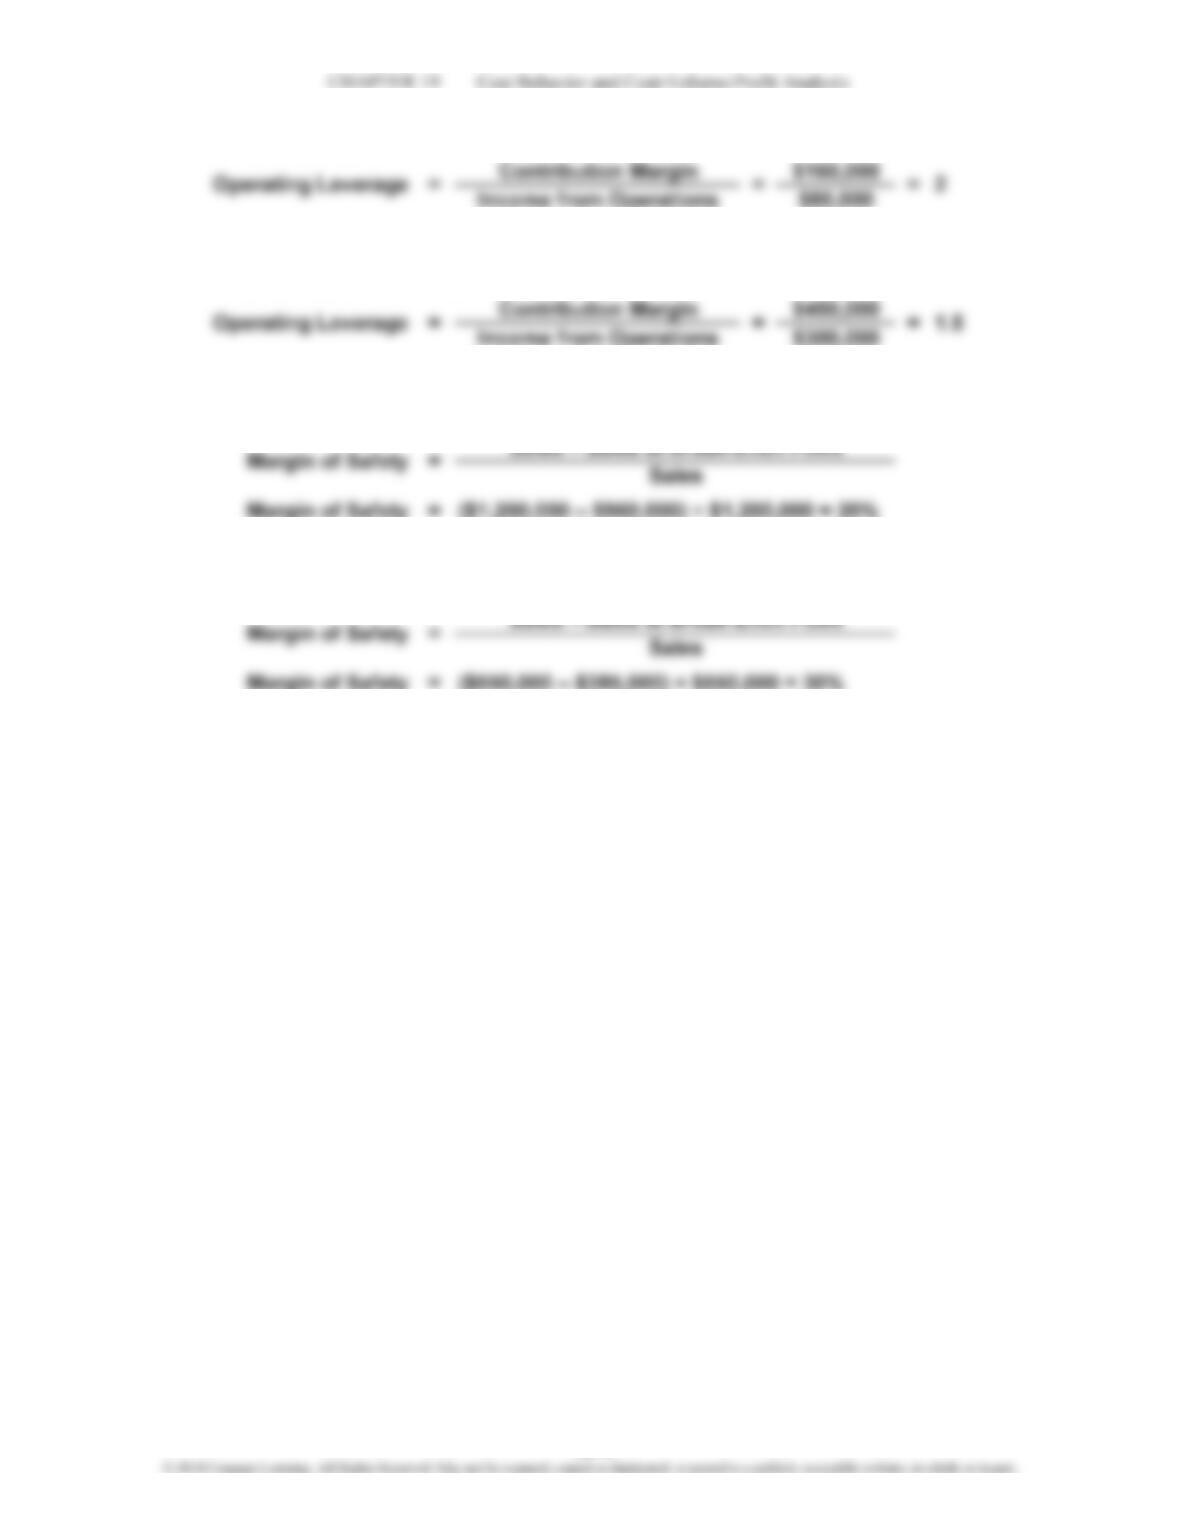
10. Operating leverage measures the relationship between a company’s contribution margin
and income from operations. The difference between contribution margin and income fro
m
operations is fixed costs. Thus, companies with high fixed costs will normally have a high
CHAPTER 19 (FIN MAN); CHAPTER 4 (MAN)
COST BEHAVIOR AND COST-VOLUME-PROFIT ANALYSIS
DISCUSSION QUESTIONS
19-1
CHAPTER 19 Cost Behavior and Cost-Volume-Profit Analysis
PE 19–1A (FIN MAN); PE 4–1A (MAN)
PE 19–1B (FIN MAN); PE 4–1B (MAN)
PE 19–2A (FIN MAN); PE 4–2A (MAN)
PE 19–2B (FIN MAN); PE 4–2B (MAN)
PRACTICE EXERCISES
19-2
CHAPTER 19 Cost Behavior and Cost-Volume-Profit Analysis
PE 19–3A (FIN MAN); PE 4–3A (MAN)
PE 19–3B (FIN MAN); PE 4–3B (MAN)
PE 19–4A (FIN MAN); PE 4–4A (MAN)
PE 19–4B (FIN MAN); PE 4–4B (MAN)
PE 19–5A (FIN MAN); PE 4–5A (MAN)
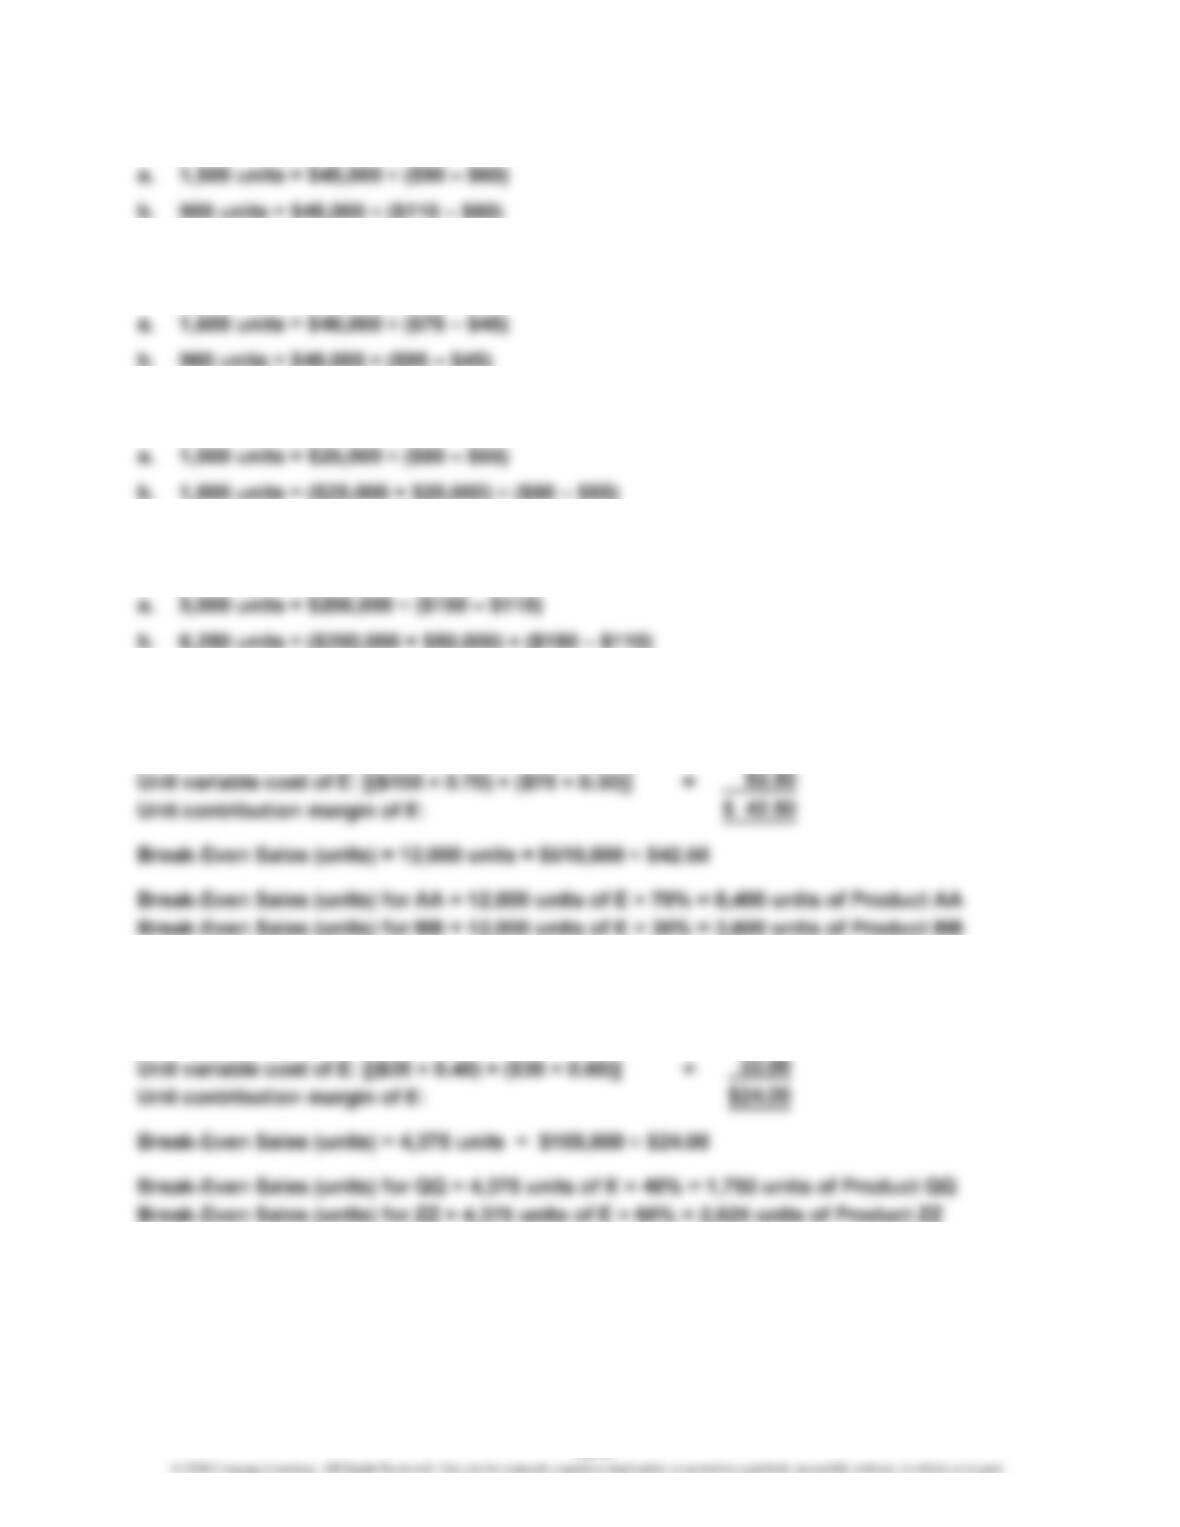
Unit selling price of E: [($150 × 0.70) + ($100 × 0.30)] = $135.00
PE 19–5B (FIN MAN); PE 4–5B (MAN)
Unit selling price of E: [($50 × 0.40) + ($60 × 0.60)] = $56.00
19-3
PE 19–6A (FIN MAN); PE 4–6A (MAN)
PE 19–6B (FIN MAN); PE 4–6B (MAN)
PE 19–7A (FIN MAN); PE 4–7A (MAN)
PE 19–7B (FIN MAN); PE 4–7B (MAN)
19-4
CHAPTER 19 Cost Behavior and Cost-Volume-Profit Analysis
Ex. 19–1 (FIN MAN); Ex. 4–1 (MAN)
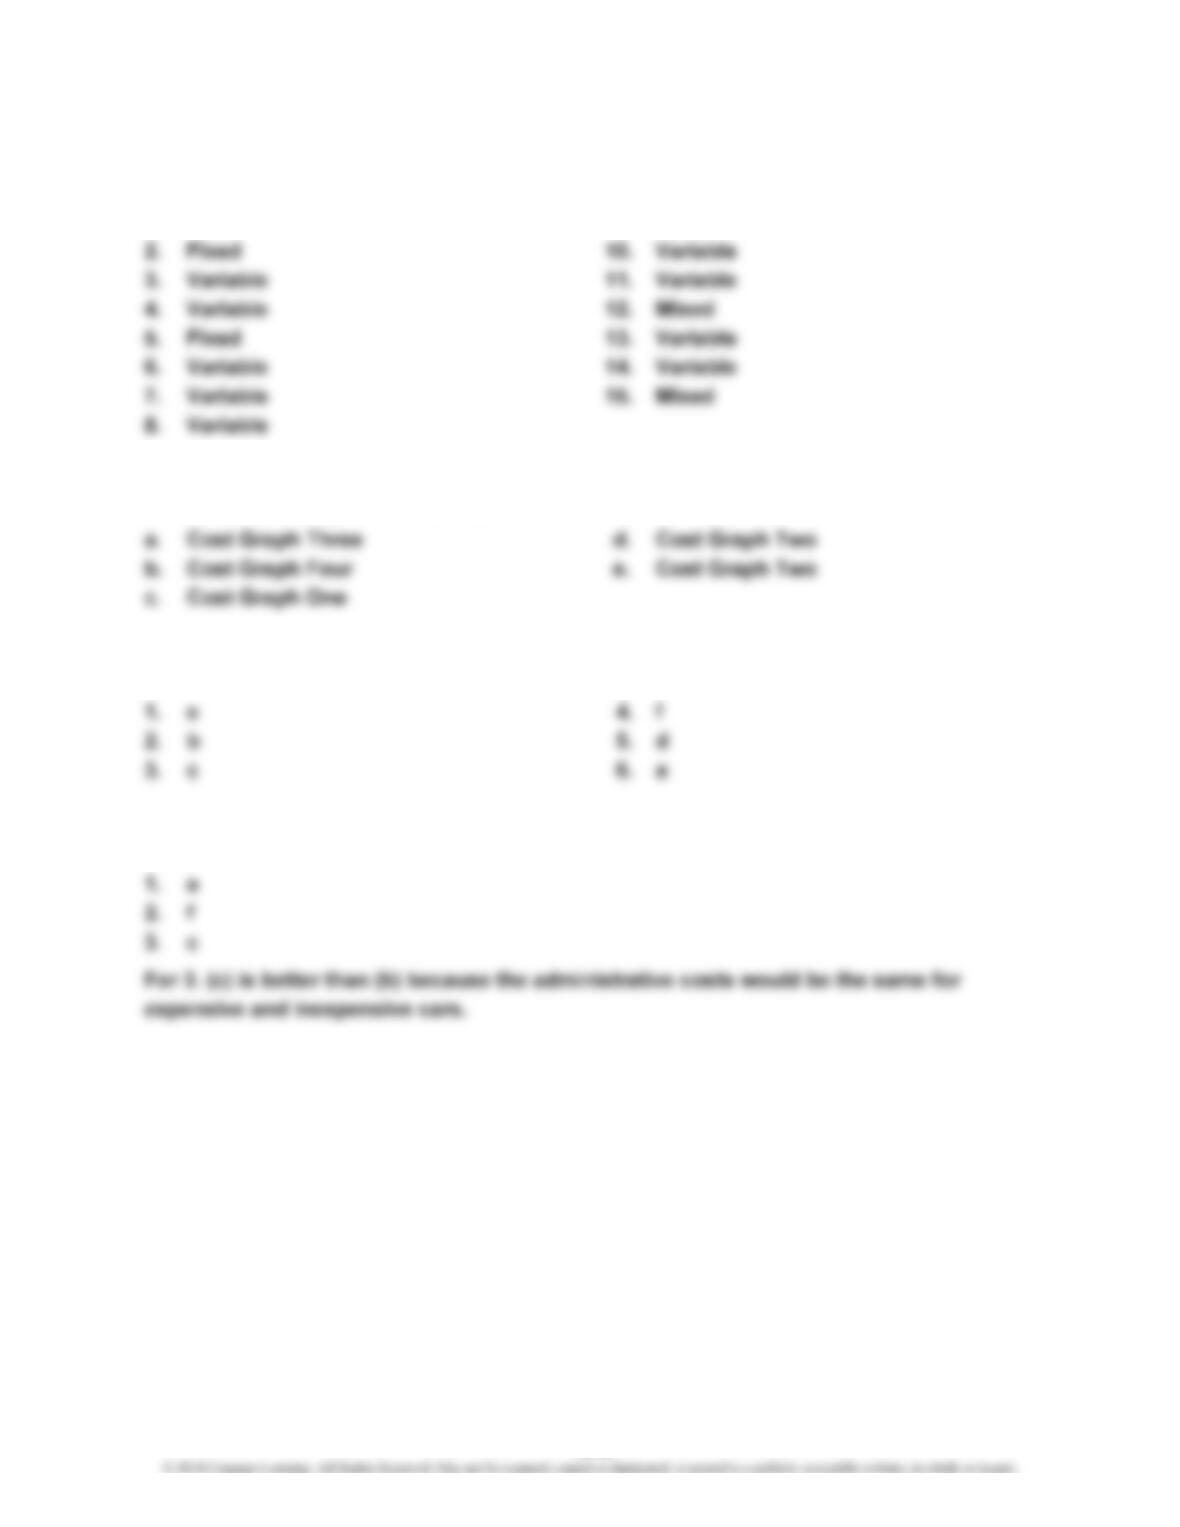
1. Fixed 9. Fixed
Ex. 19–2 (FIN MAN); Ex. 4–2 (MAN)
Ex. 19–3 (FIN MAN); Ex. 4–3 (MAN)
Ex. 19–4 (FIN MAN); Ex. 4–4 (MAN)
EXERCISES
19-5
CHAPTER 19 Cost Behavior and Cost-Volume-Profit Analysis
Ex. 19–5 (FIN MAN); Ex. 4–5 (MAN)
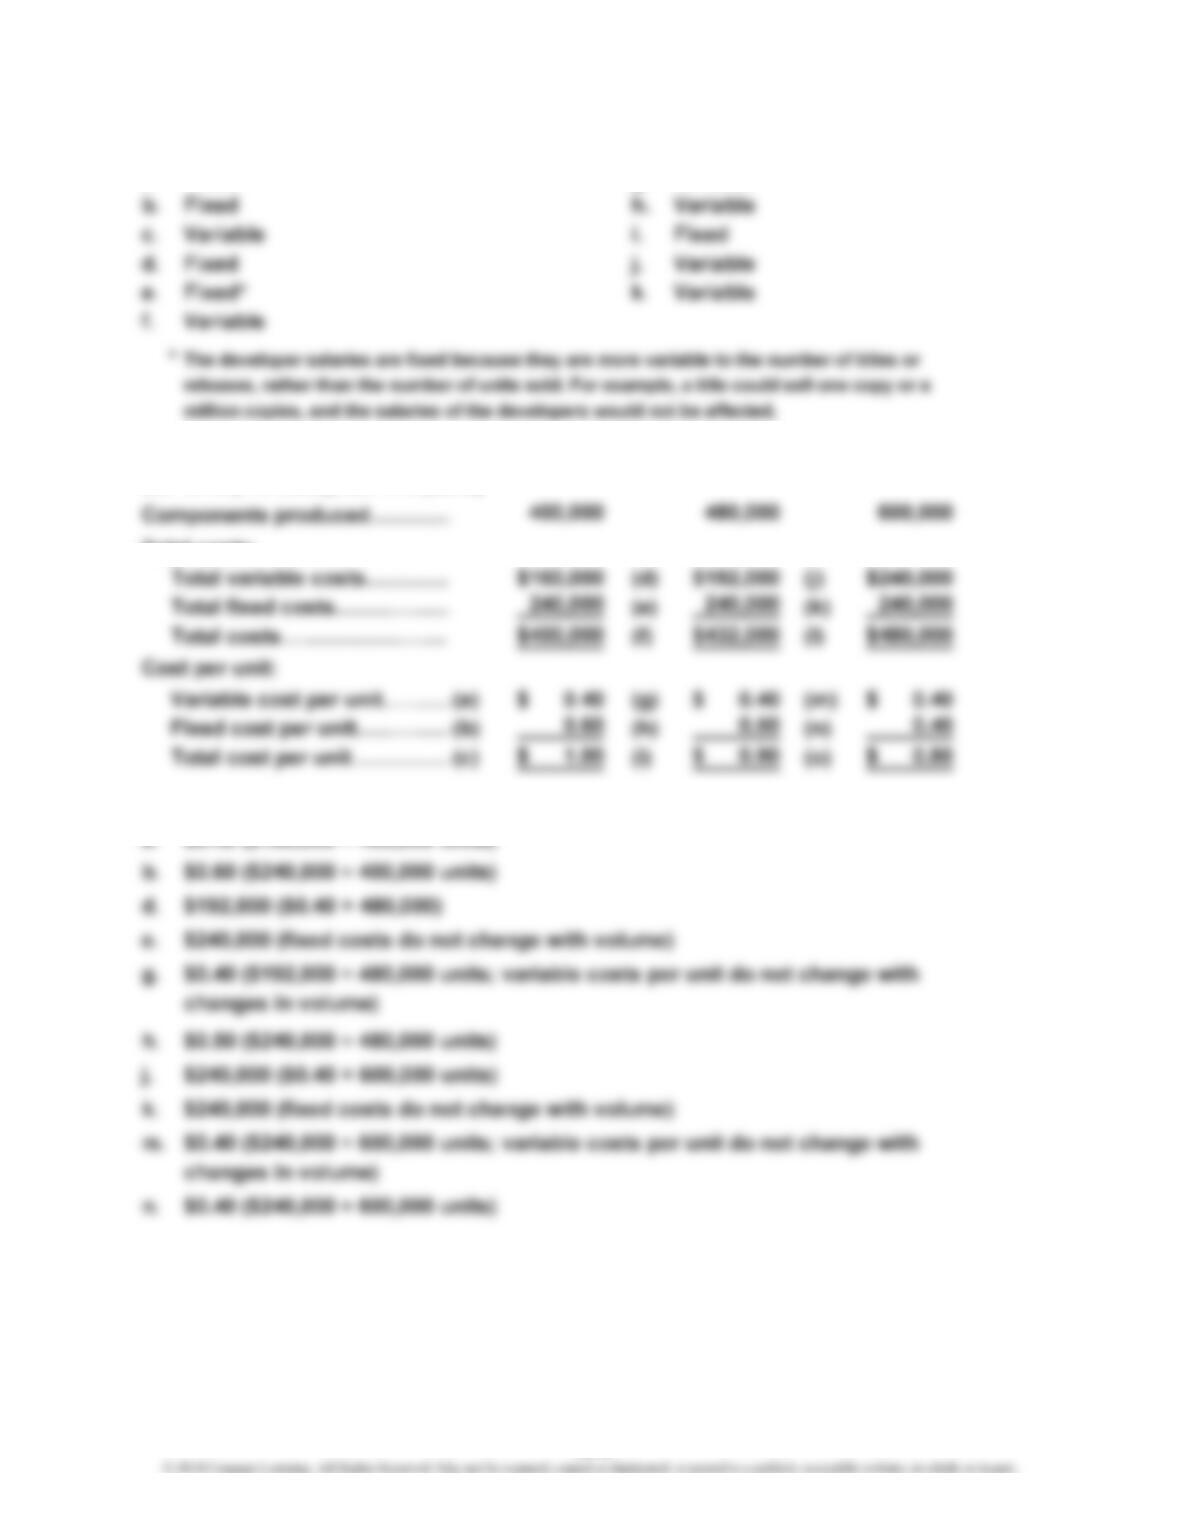
a. Fixed g. Variable
Ex. 19–6 (FIN MAN); Ex. 4–6 (MAN)
Total costs:
Supporting calculations:
a. $0.40 ($160,000 ÷ 400,000 units)
19-6
CHAPTER 19 Cost Behavior and Cost-Volume-Profit Analysis
Ex. 19–7 (FIN MAN); Ex. 4–7 (MAN)
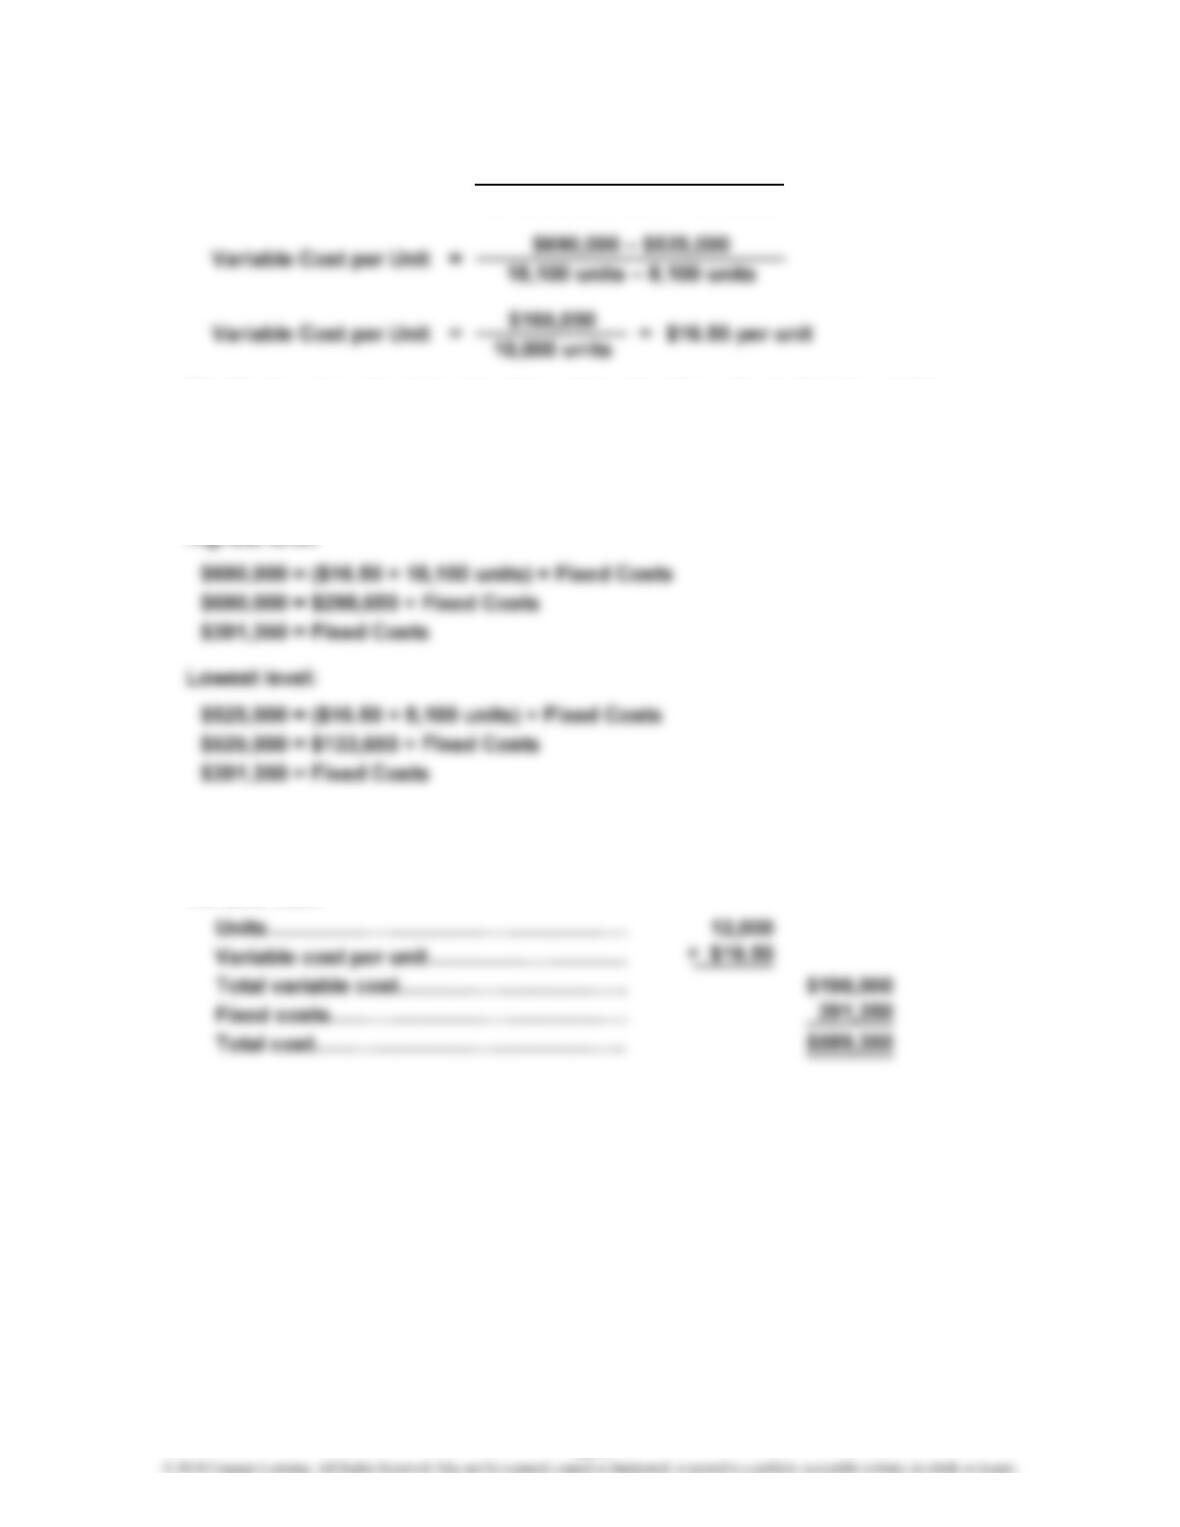
The fixed cost can be determined by subtracting the estimated total variable
cost from the total cost at either the highest or lowest level of production, as
follows:
Total Cost = (Variable Cost per Unit × Units Produced) + Fixed Costs
Highest level:
b. Total Cost = (Variable Cost per Unit × Units Produced) + Fixed Costs
Total cost for 12,000 units:
Variable cost:
=Variable Cost per Unita.
Difference in Total Costs
Difference in Units Produced
19-7
CHAPTER 19 Cost Behavior and Cost-Volume-Profit Analysis
Ex. 19–8 (FIN MAN); Ex. 4–8 (MAN)
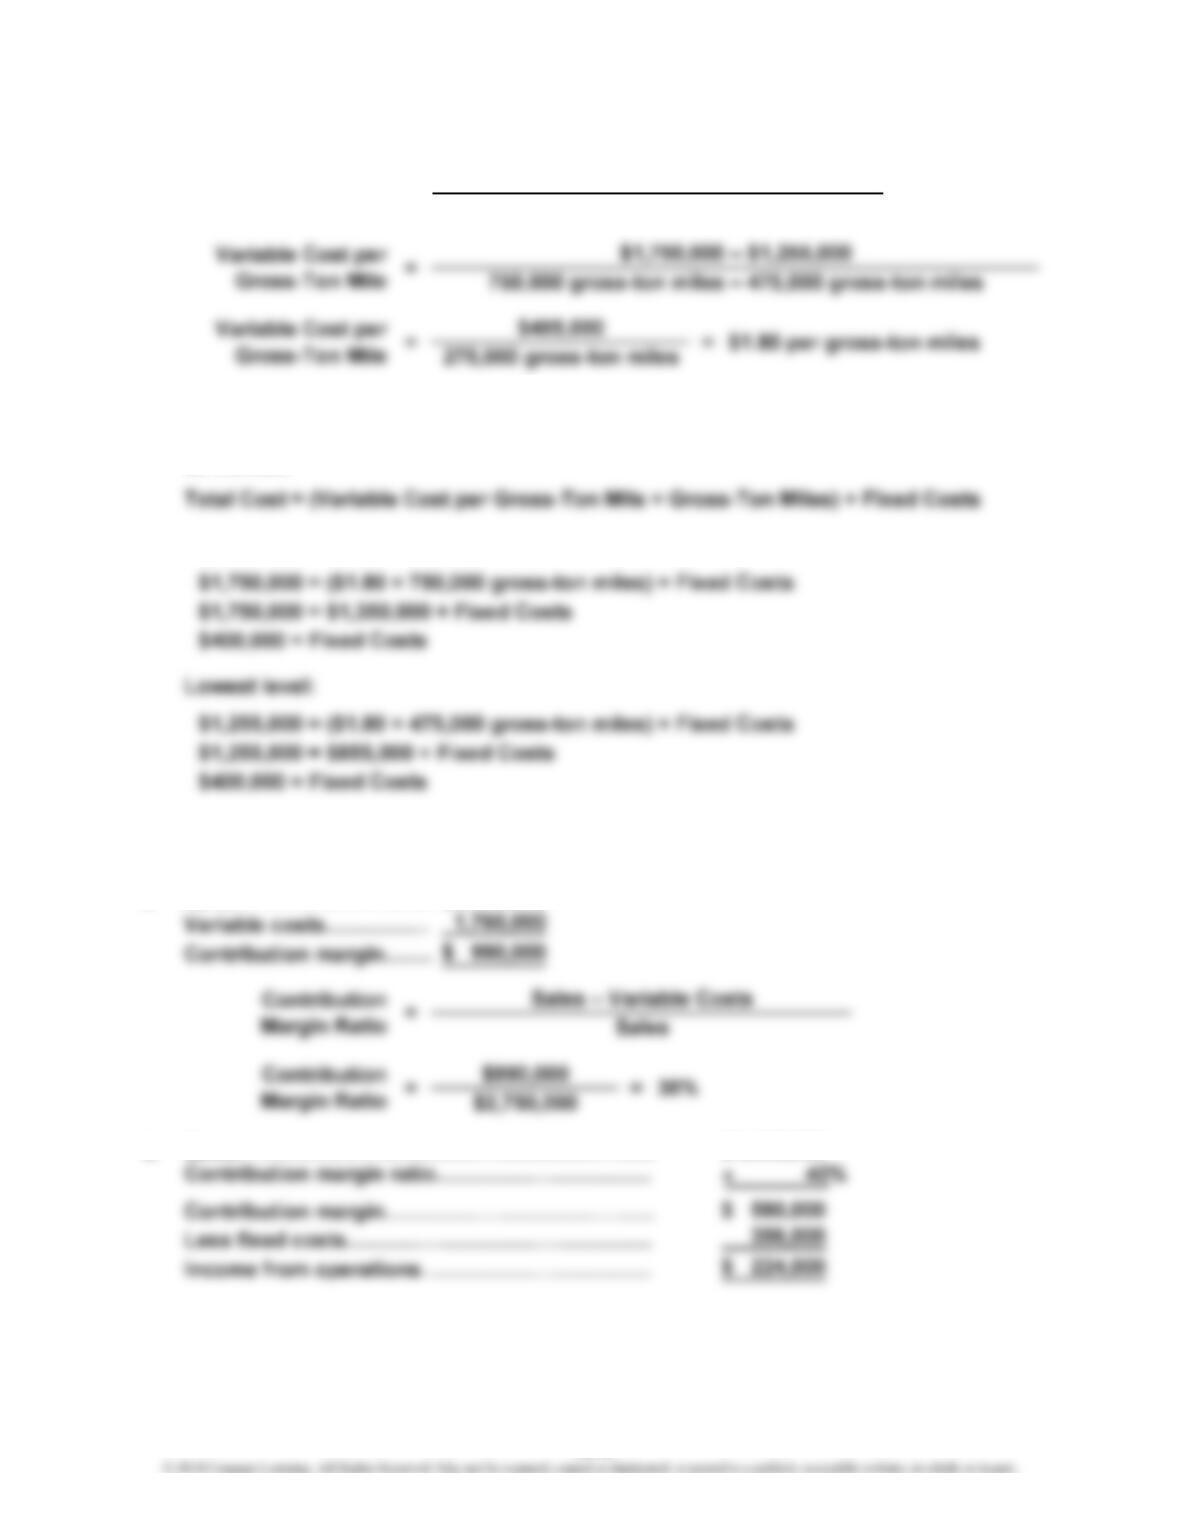
The fixed costs can be determined by subtracting the estimated total variable
cost from the total cost at either the highest or lowest level of gross-ton mile,
as follows:
Highest level:
Ex. 19–9 (FIN MAN); Ex. 4–9 (MAN)
a. Sales………………………
…
$2,750,000
b. Sales…………………………………………………
…
=
Variable Cost per
Gross-Ton Mile Difference in Gross-Ton Miles
Difference in Total Costs
$1,450,000
19-8
CHAPTER 19 Cost Behavior and Cost-Volume-Profit Analysis
Ex. 19–10 (FIN MAN); Ex. 4–10 (MAN)
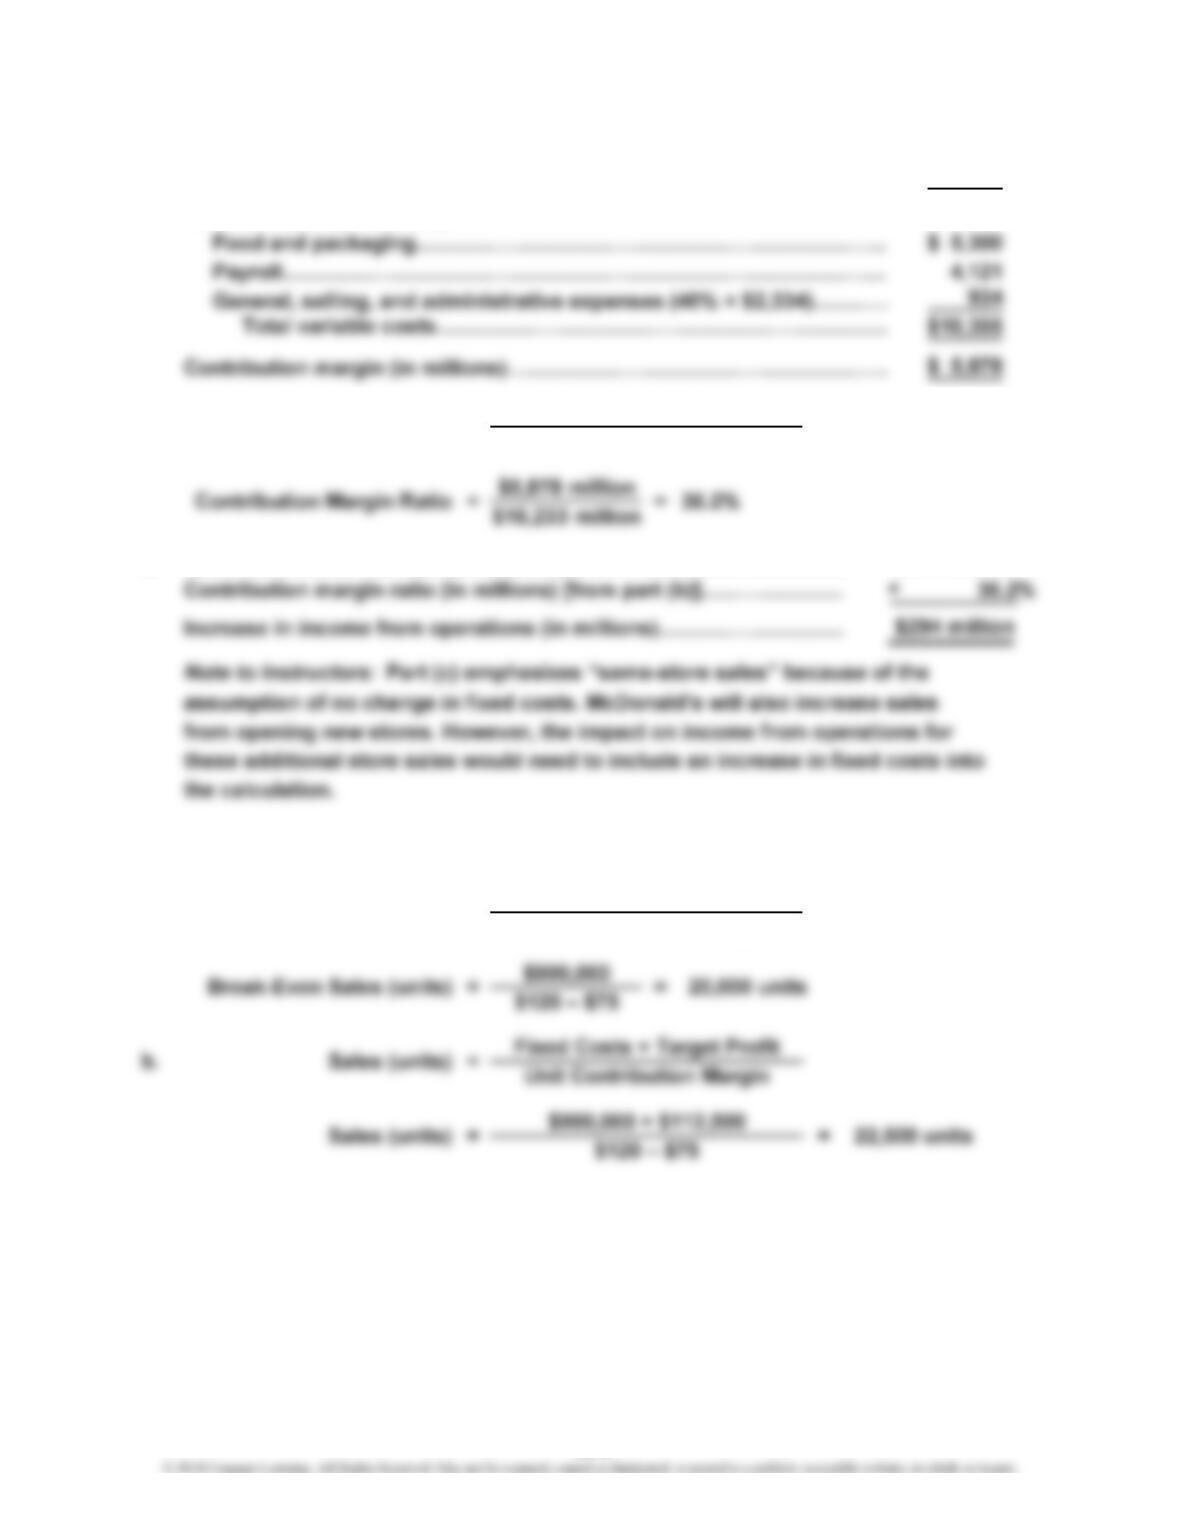
a. Sales (in millions)…………………………………………………………………
…
$16,233
Variable costs (in millions):
c. Same-store sales increase (in millions)…………………………………
…
Ex. 19–11 (FIN MAN); Ex. 4–11 (MAN)
a. Break-Even Sales (units) = Fixed Costs
Unit Contribution Margin
$811 million
Sales – Variable Costs
Sales
b. =Contribution Margin Ratio
19-9
CHAPTER 19 Cost Behavior and Cost-Volume-Profit Analysis
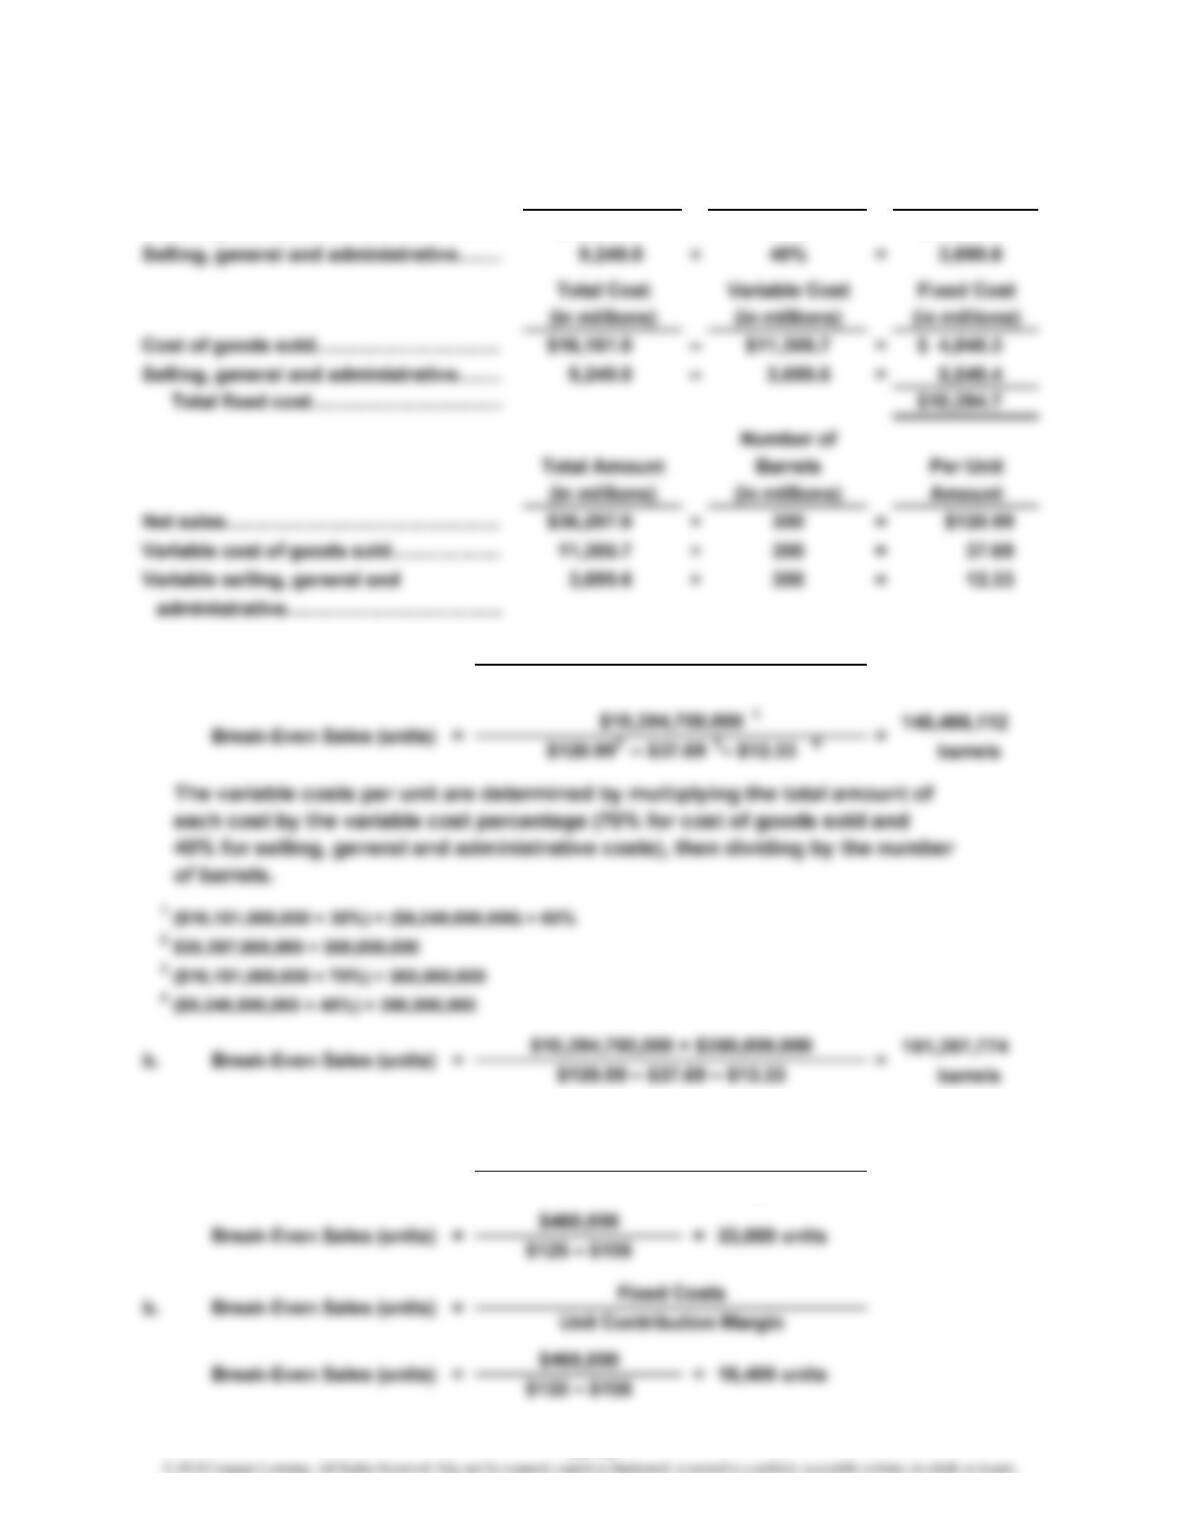
Ex. 19–12 (FIN MAN); Ex. 4–12 (MAN)
Total Cost Variable Cost Variable Cost
(in millions) Percentage (in millions)
Cost of goods sold………………………
…
$16,151.0 × 70% = $11,305.7
Ex. 19–13 (FIN MAN); Ex. 4–13 (MAN)
a. Break-Even Sales (units) =
Fixed Costs
Unit Contribution Margin
a. Break-Even Sales (units) =
Fixed Costs
Unit Contribution Margin
19-10
CHAPTER 19 Cost Behavior and Cost-Volume-Profit Analysis
Ex. 19–14 (FIN MAN); Ex. 4–14 (MAN)
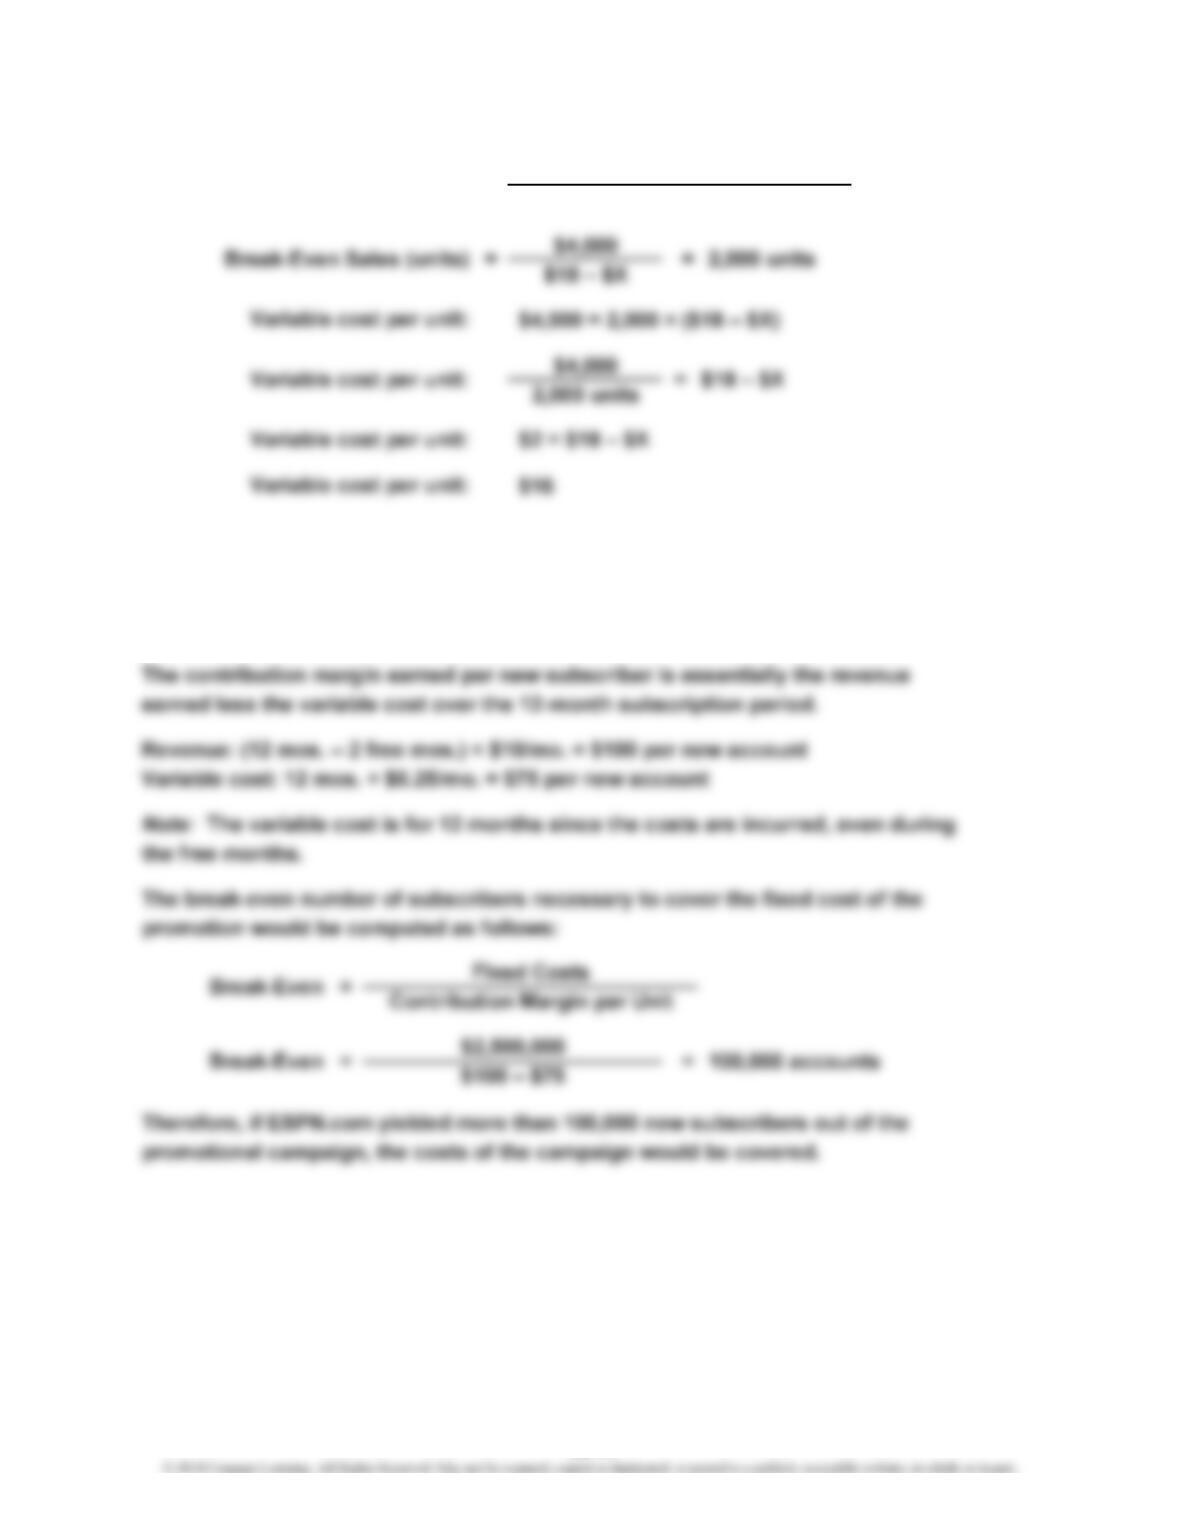
Ex. 19–15 (FIN MAN); Ex. 4–15 (MAN)
The cost of the promotional campaign is the fixed cost in this analysis, since
we’re trying to determine the break-even adoption rate of the campaign.
Unit Contribution Margin
=Break-Even Sales (units)
Fixed Costs
19-11
CHAPTER 19 Cost Behavior and Cost-Volume-Profit Analysis
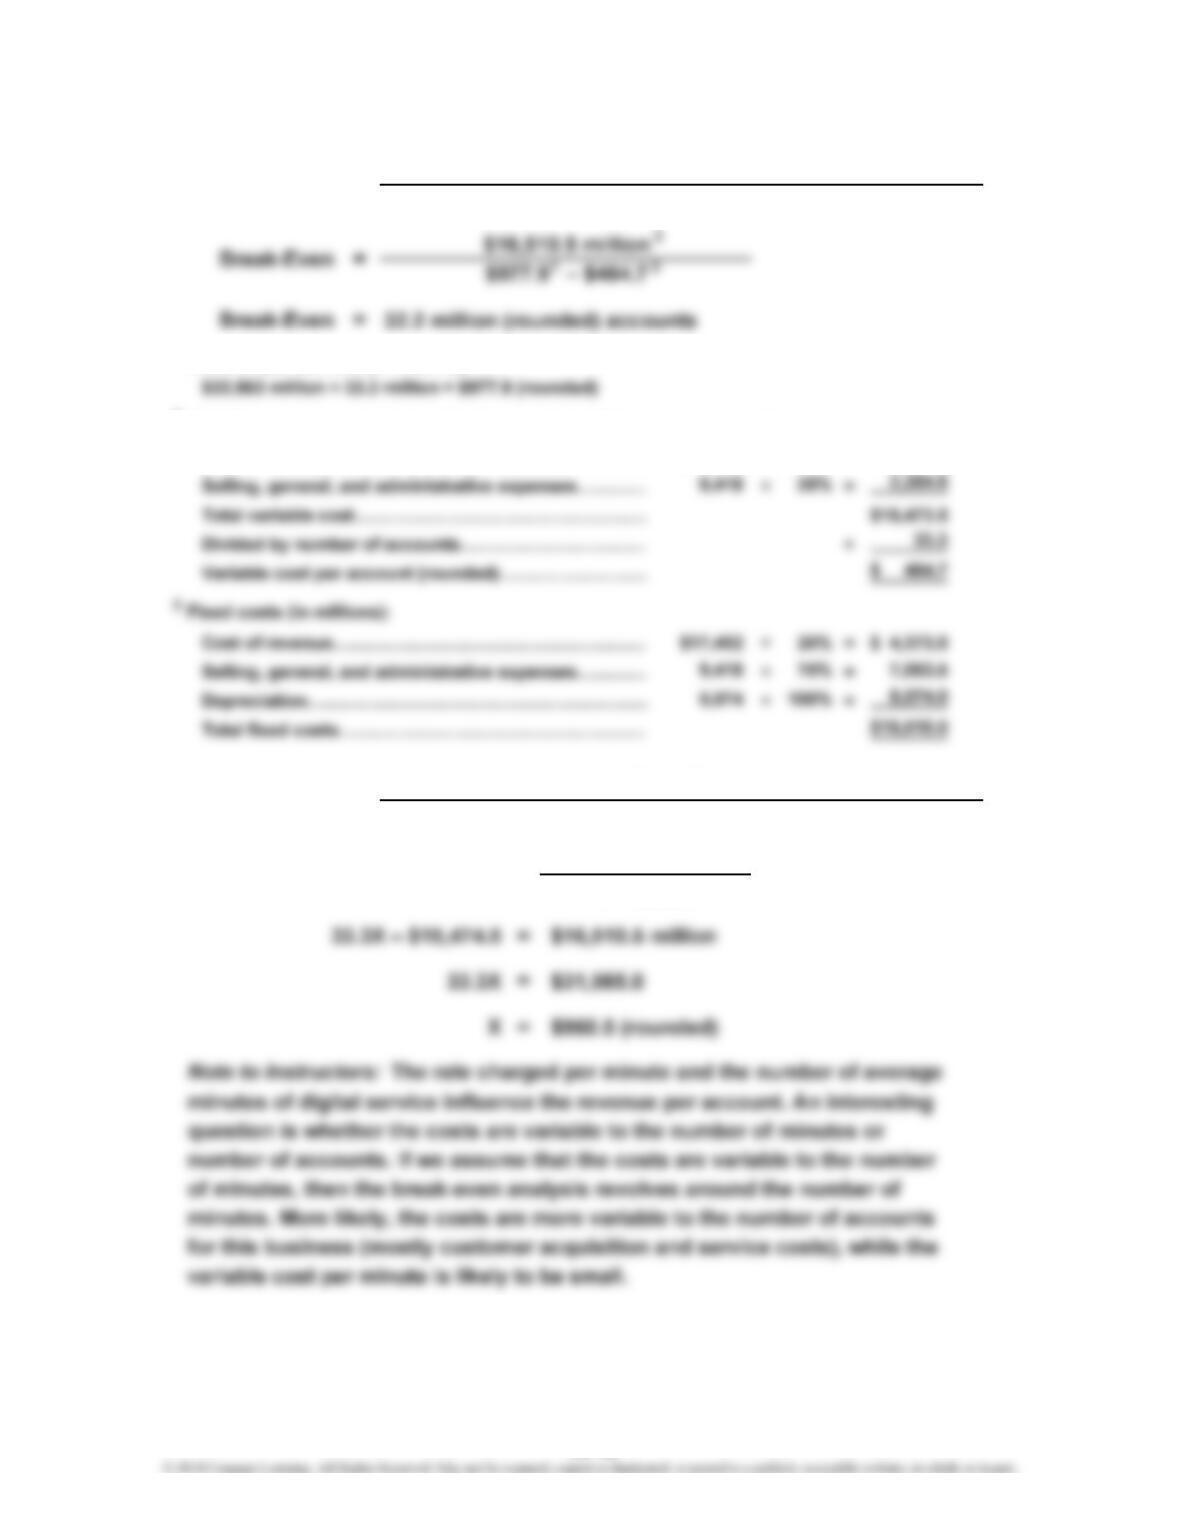
Ex. 19–16 (FIN MAN); Ex. 4–16 (MAN)
1Revenue per account (in millions):
2Variable cost per account (in millions, except variable cost per account):
Cost of revenue……………………………………………… $17,492 × 75% = $13,119.0
=
$16,510.5 million
X – $464.7
Revenue per Account – Variable Cost per Account
Fixed Cost
Revenue per Account – Variable Cost per Account
=33.3 million accounts
b. Break-Even =
Fixed Costs
a.
Break-Even
19-12
CHAPTER 19 Cost Behavior and Cost-Volume-Profit Analysis
Ex. 19–17 (FIN MAN); Ex. 4–17 (MAN)
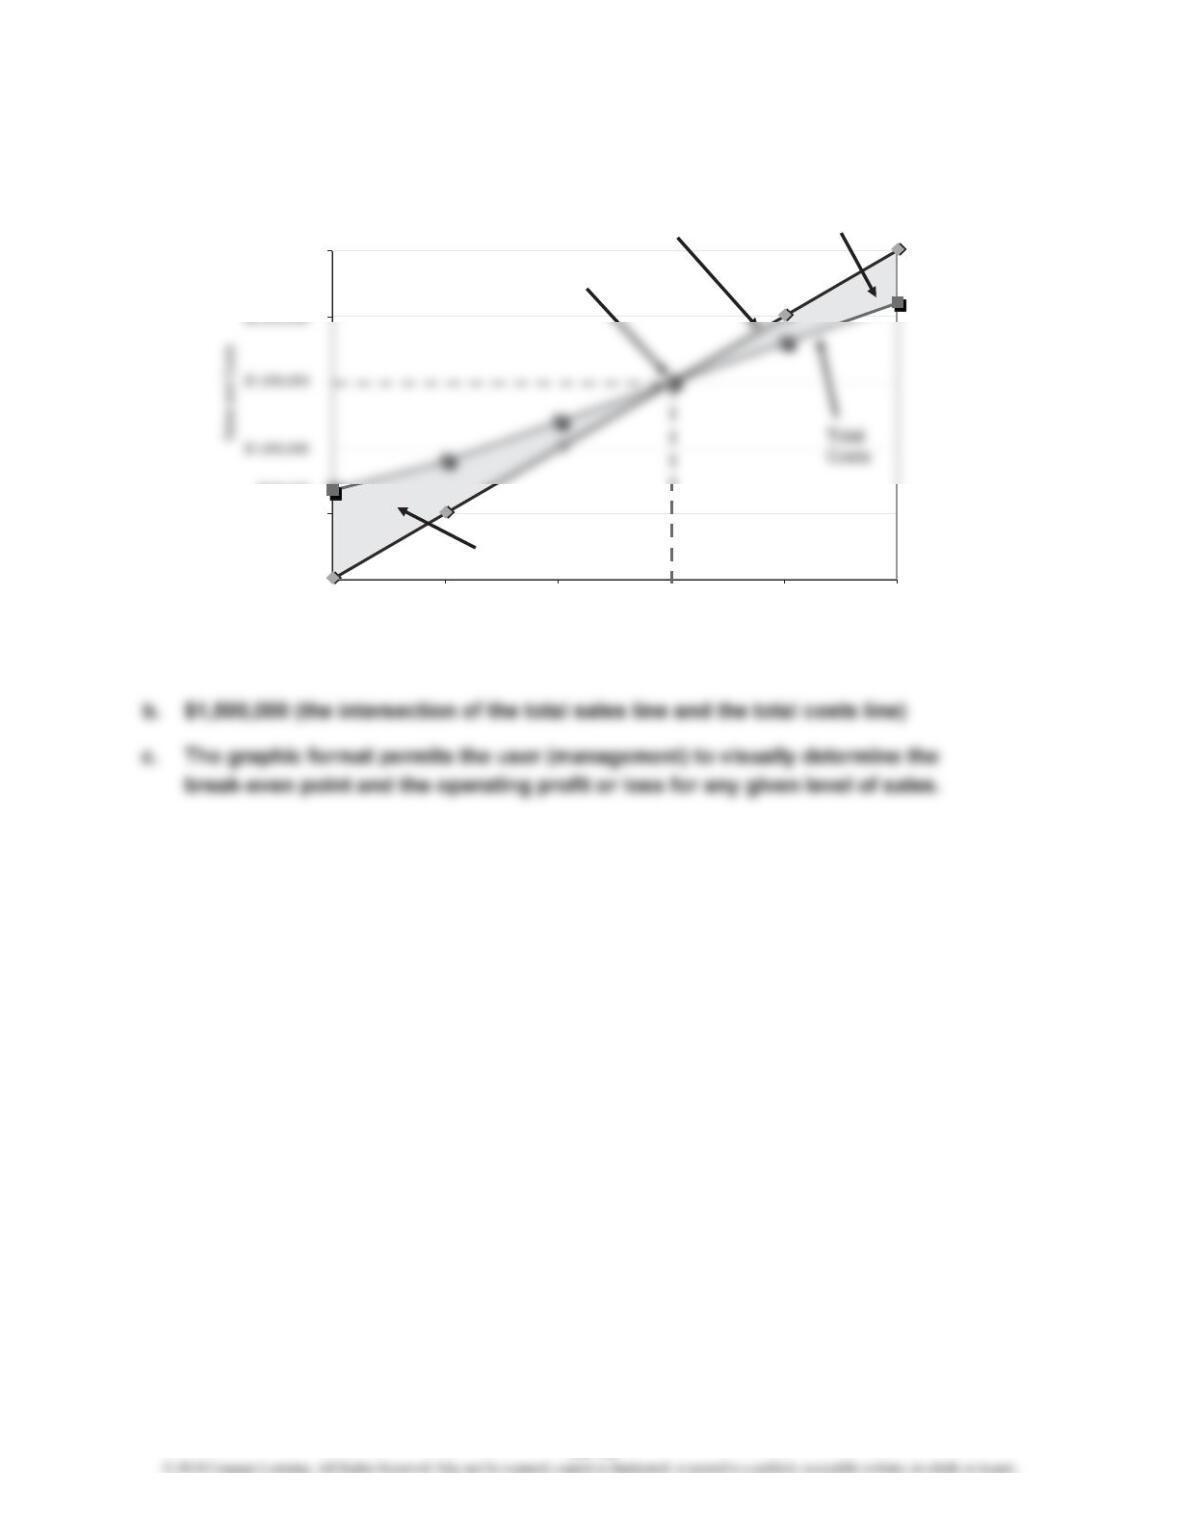
a.
$0
$500,000
$2,500,000
0 4,000 8,000 12,000 16,000 20,000
Units of Sales
Break-
Even Point
Operating
Profit Area Total Sales Line
Operating
Loss Area
$600,000
19-13
CHAPTER 19 Cost Behavior and Cost-Volume-Profit Analysis
Ex. 19–18 (FIN MAN); Ex. 4–18 (MAN)
a. $600,000 (total fixed costs)
c.
d. 12,000 units (the intersection of the profit line and the horizontal axis)
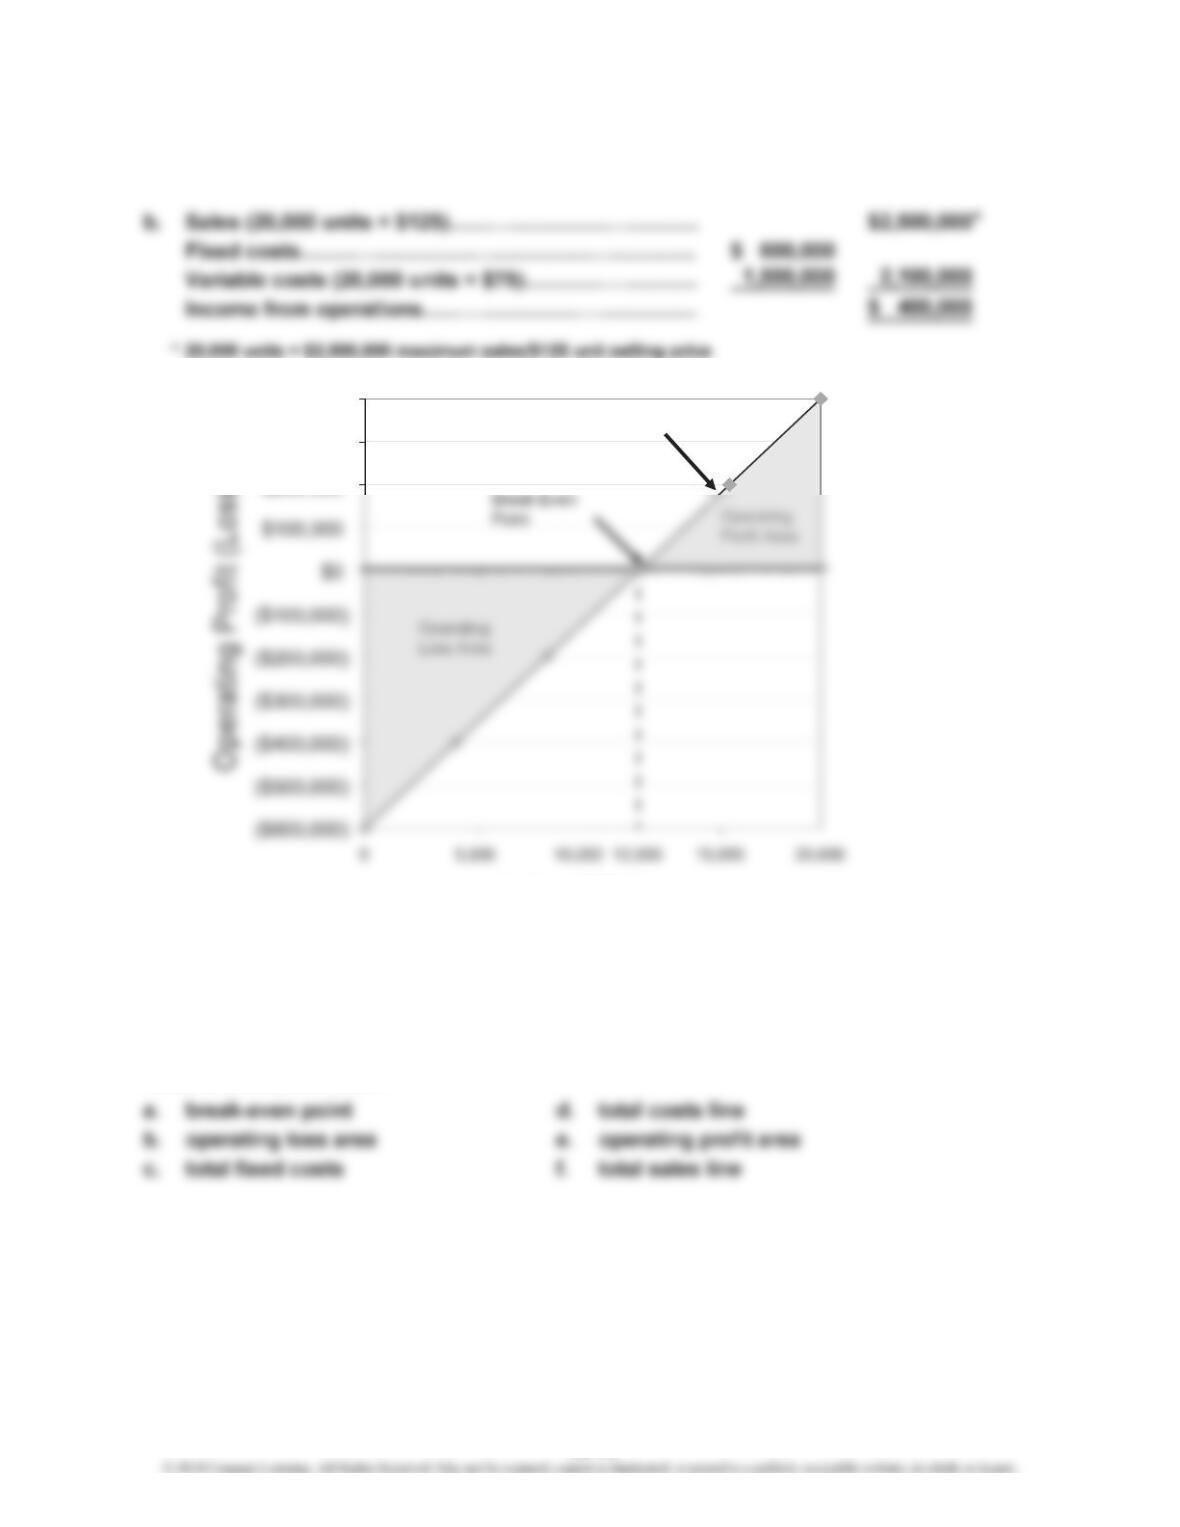
Ex. 19–19 (FIN MAN); Ex. 4–19 (MAN)
Cost-volume-profit chart
$200,000
$300,000
$400,000
Units of Sales
Profit Line
19-14
CHAPTER 19 Cost Behavior and Cost-Volume-Profit Analysis
Ex. 19–20 (FIN MAN); Ex. 4–20 (MAN)
Profit-volume chart
a. break-even point
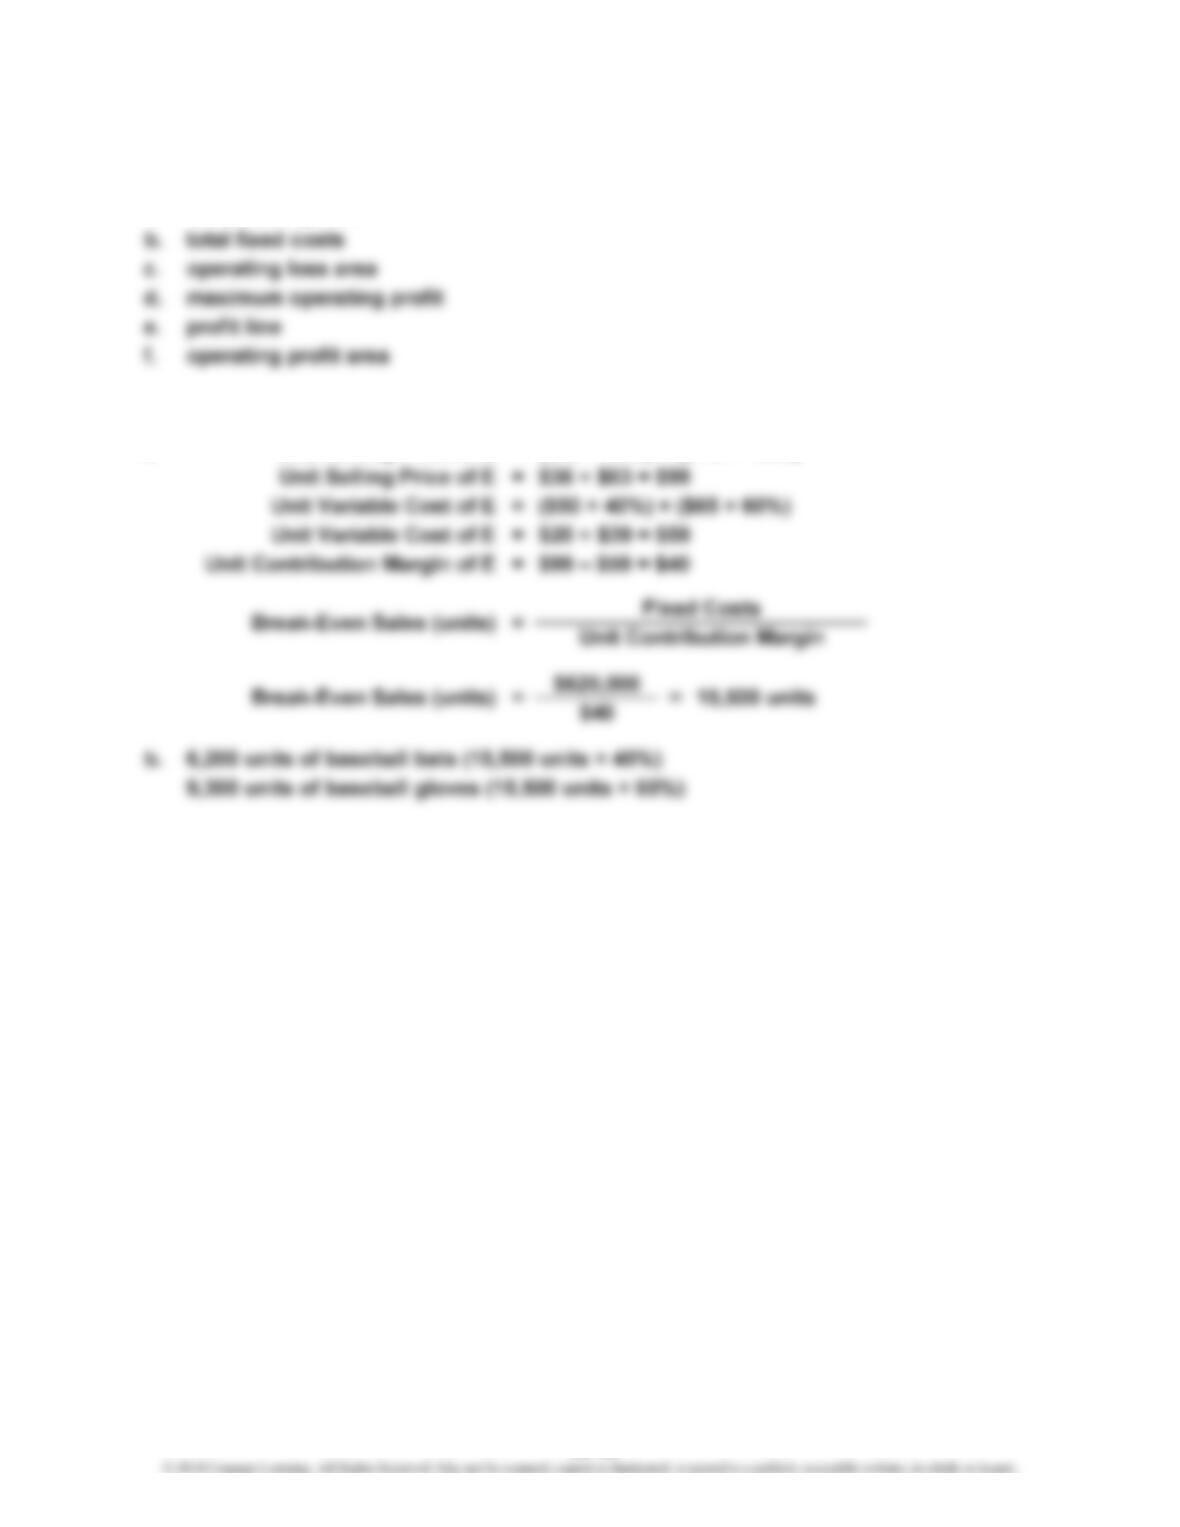
Ex. 19–21 (FIN MAN); Ex. 4–21 (MAN)
a. Unit Selling Price of E = ($90 × 40%) + ($105 × 60%)
19-15
CHAPTER 19 Cost Behavior and Cost-Volume-Profit Analysis
Ex. 19–22 (FIN MAN); Ex. 4–22 (MAN)
a. Unit contribution margin of overall product (E):
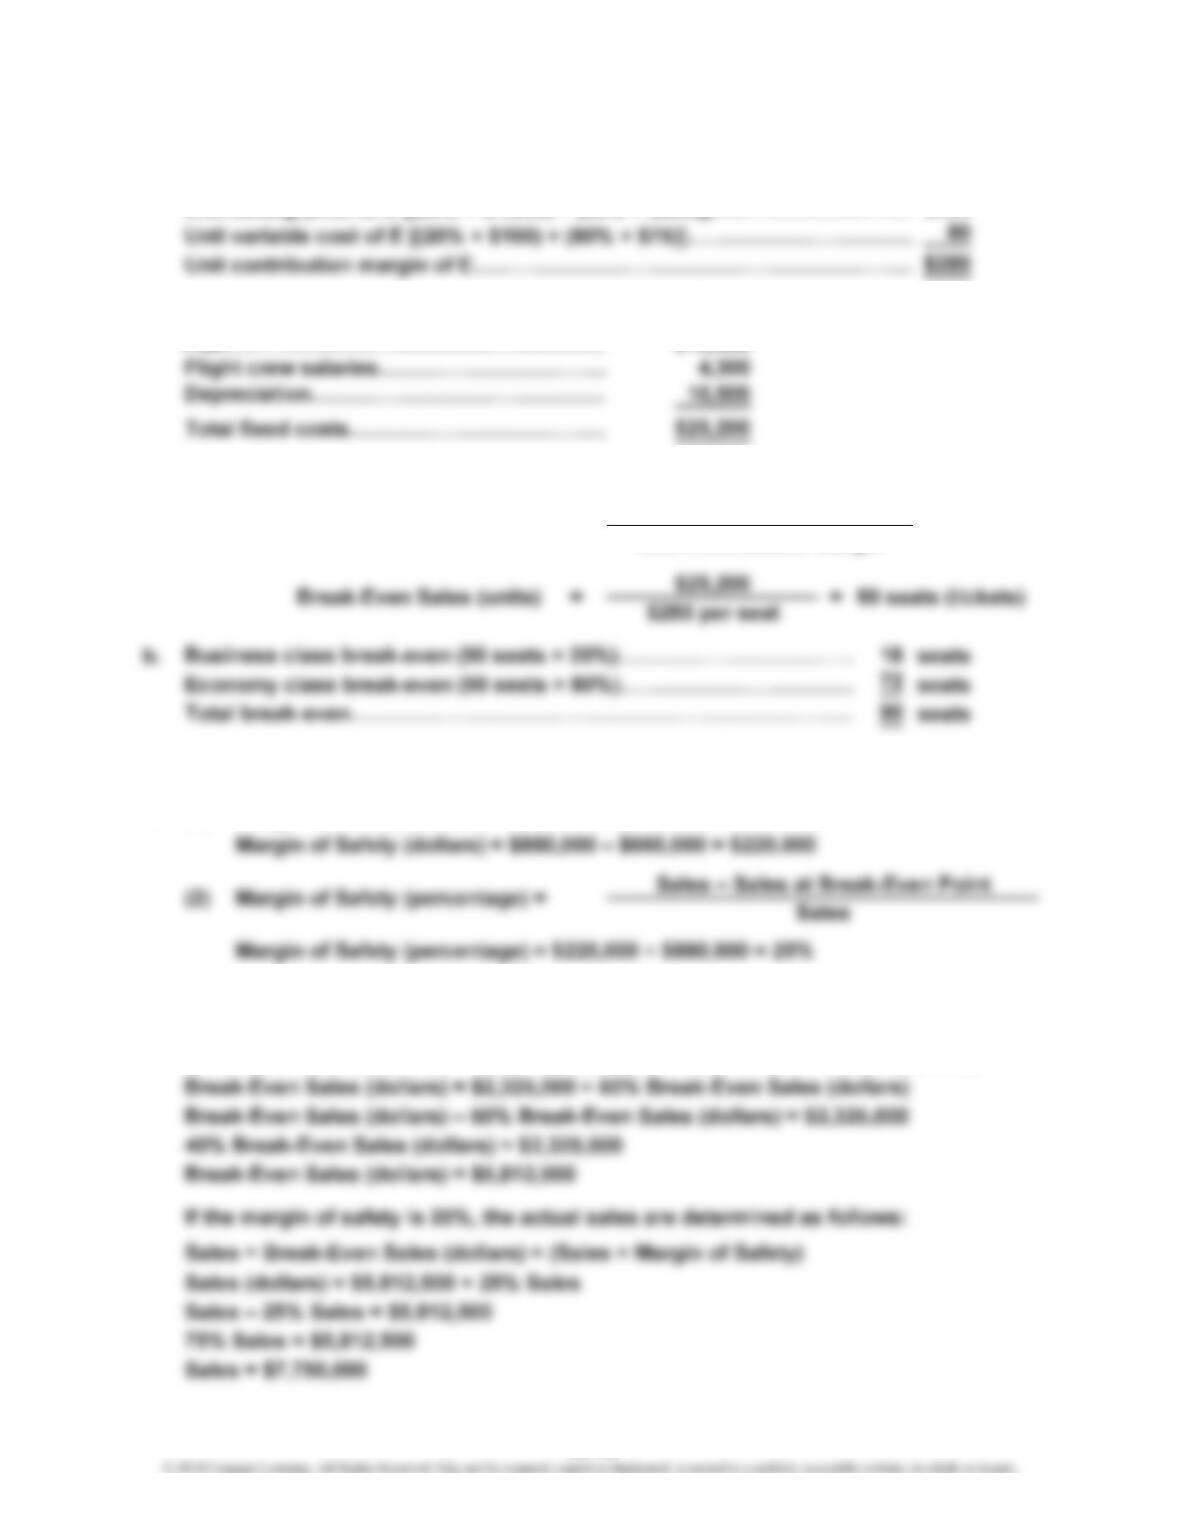
Unit selling price of E [(20% × $1,000) + (80% × $200)]………………………
…
$360
Fixed costs of the New York City to George Town, Grand Cayman round-trip flight:
Fuel………………………………………………
…
$10,400
Break-even sales (units) of overall product:
Ex. 19–23 (FIN MAN); Ex. 4–23 (MAN)
a. (1) Margin of Safety (dollars) = Sales – Sales at Break-Even Point
b. The break-even point (S) is determined as follows:
Break-Even Sales (dollars) = Total Fixed Costs + Total Variable Costs (at Break-Even)
Break-Even Sales (dollars) = Total Fixed Costs + 60% Break-Even Sales (dollars)
=Fixed Costs
Unit Contribution Margin
Break-Even Sales (units)
19-16
CHAPTER 19 Cost Behavior and Cost-Volume-Profit Analysis
Ex. 19–24 (FIN MAN); Ex. 4–24 (MAN)
Ex. 19–25 (FIN MAN); Ex. 4–25 (MAN)
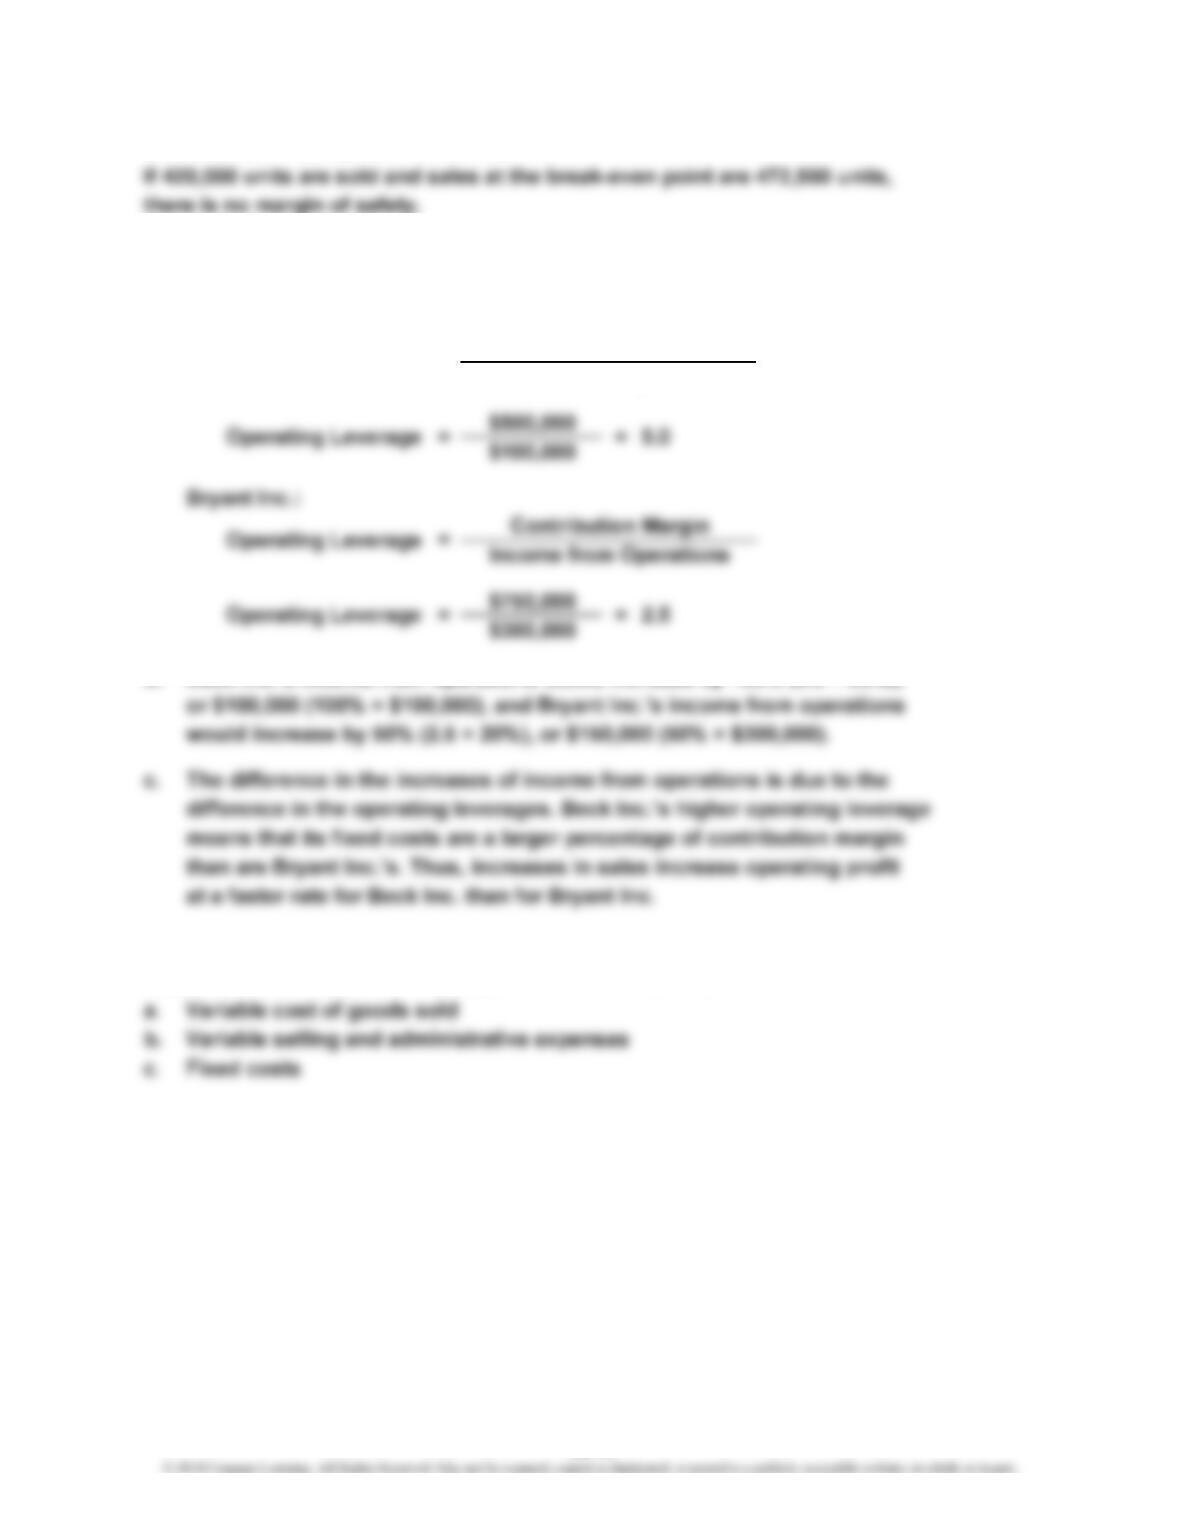
a. Beck Inc.:
b. Beck Inc.’s income from operations would increase by 100% (5.0 × 20%),
Appendix Ex. 19–26 (FIN MAN); Appendix Ex. 4–26 (MAN)
=
Contribution Margin
Income from Operations
Operating Leverage
19-17
CHAPTER 19 Cost Behavior and Cost-Volume-Profit Analysis
Appendix Ex. 19–27 (FIN MAN); Appendix Ex. 4–27 (MAN)
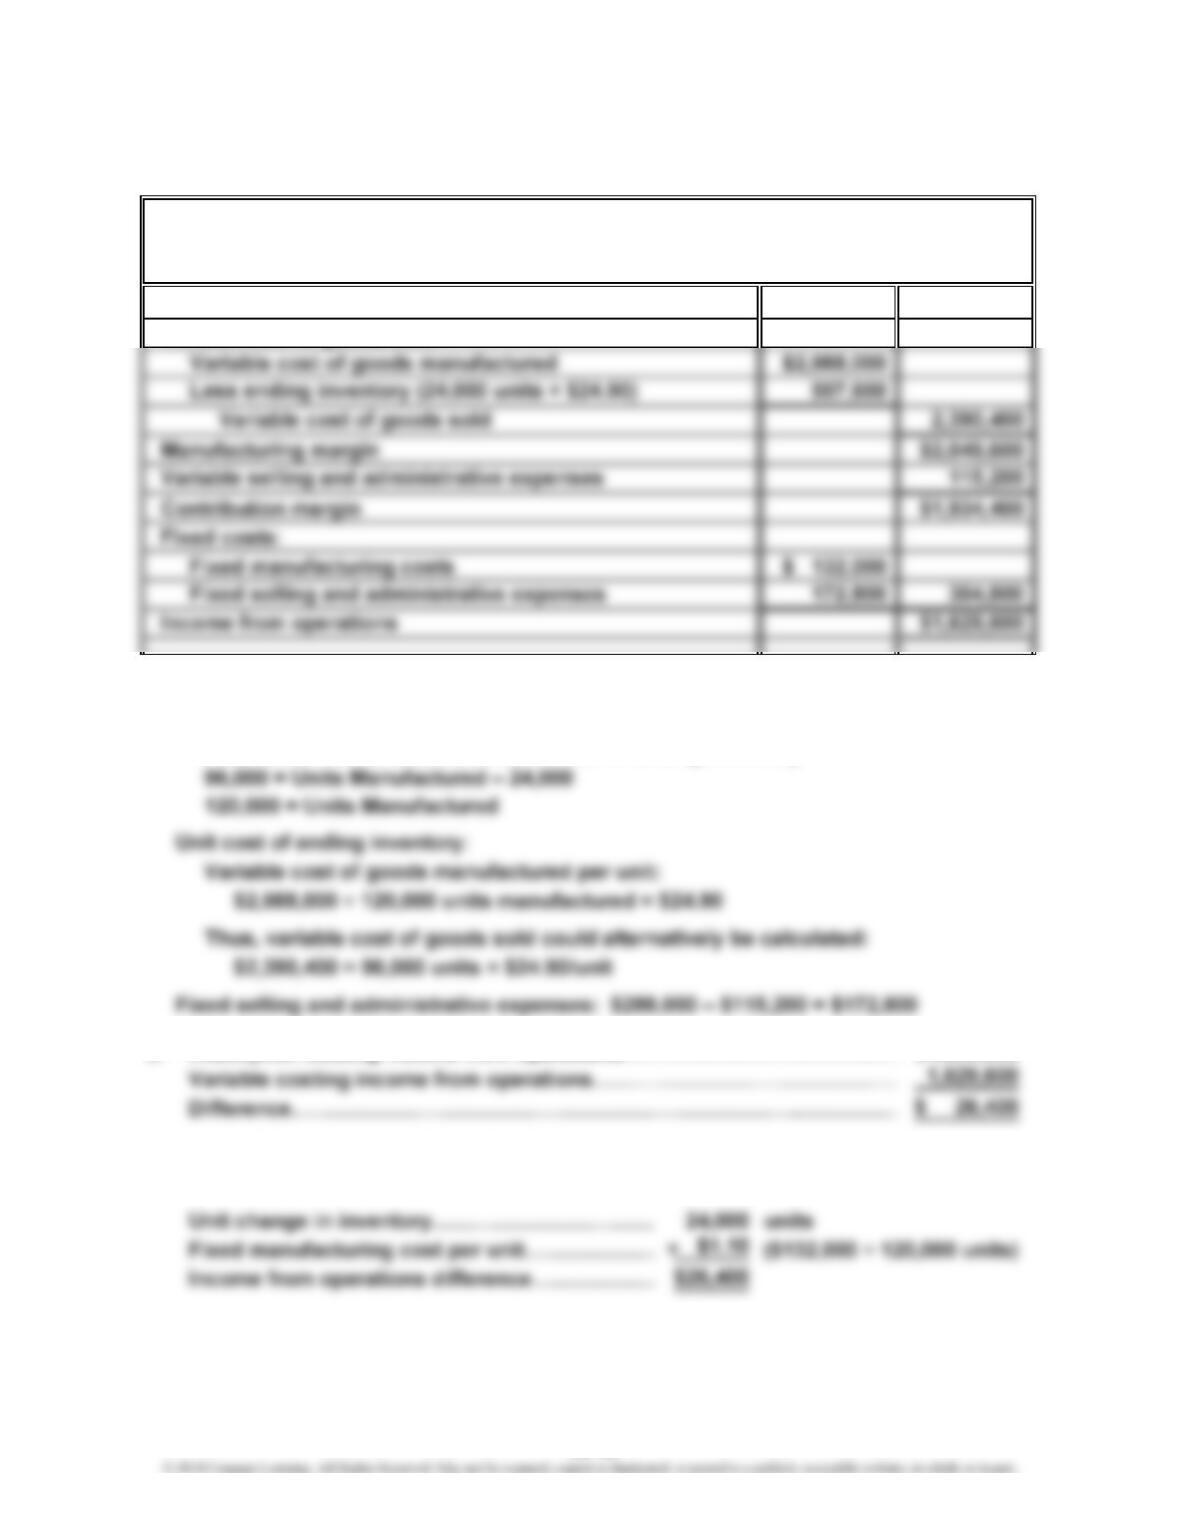
a.
Sales $4,440,000
Variable cost of goods sold:
Computations:
Variable cost of goods manufactured: $3,120,000 – $132,000 = $2,988,000
Units Sold = Units Manufactured – Units in Ending Inventory
b. Absorption costing income from operations…………………………………
…
$1,656,000
Note: The difference between the two income numbers can be reconciled
as follows:
RHYS COMPANY
Income Statement—Variable Costing
For the Month Ended July 31, 2014
19-18
CHAPTER 19 Cost Behavior and Cost-Volume-Profit Analysis
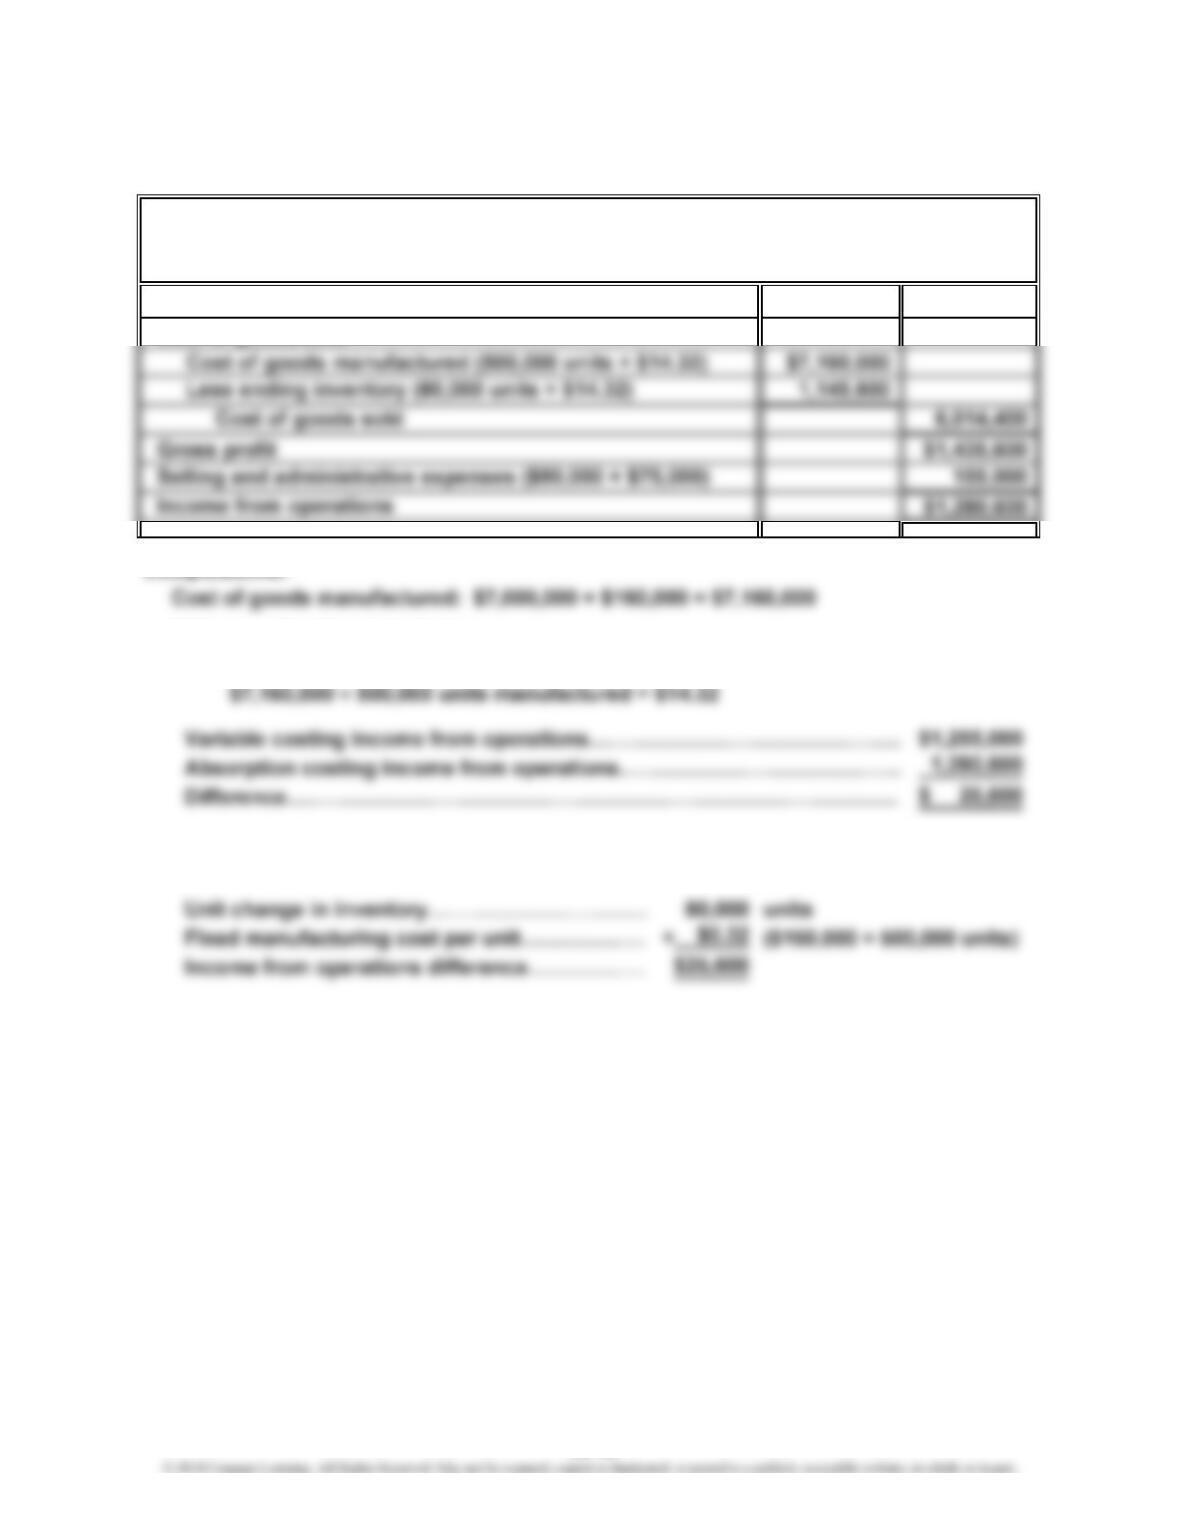
Appendix Ex. 19–28 (FIN MAN); Ex. 4–28 (MAN)
a.
Sales $7,450,000
Cost of goods sold:
Computations:
Unit cost of ending inventory:
Total cost of goods manufactured:
b. Note: The difference between the two income numbers can be reconciled
as follows:
TUDOR MANUFACTURING CO.
Income Statement—Absorption Costing
For the Month Ended June 30, 2014
19-19
CHAPTER 19 Cost Behavior and Cost-Volume-Profit Analysis
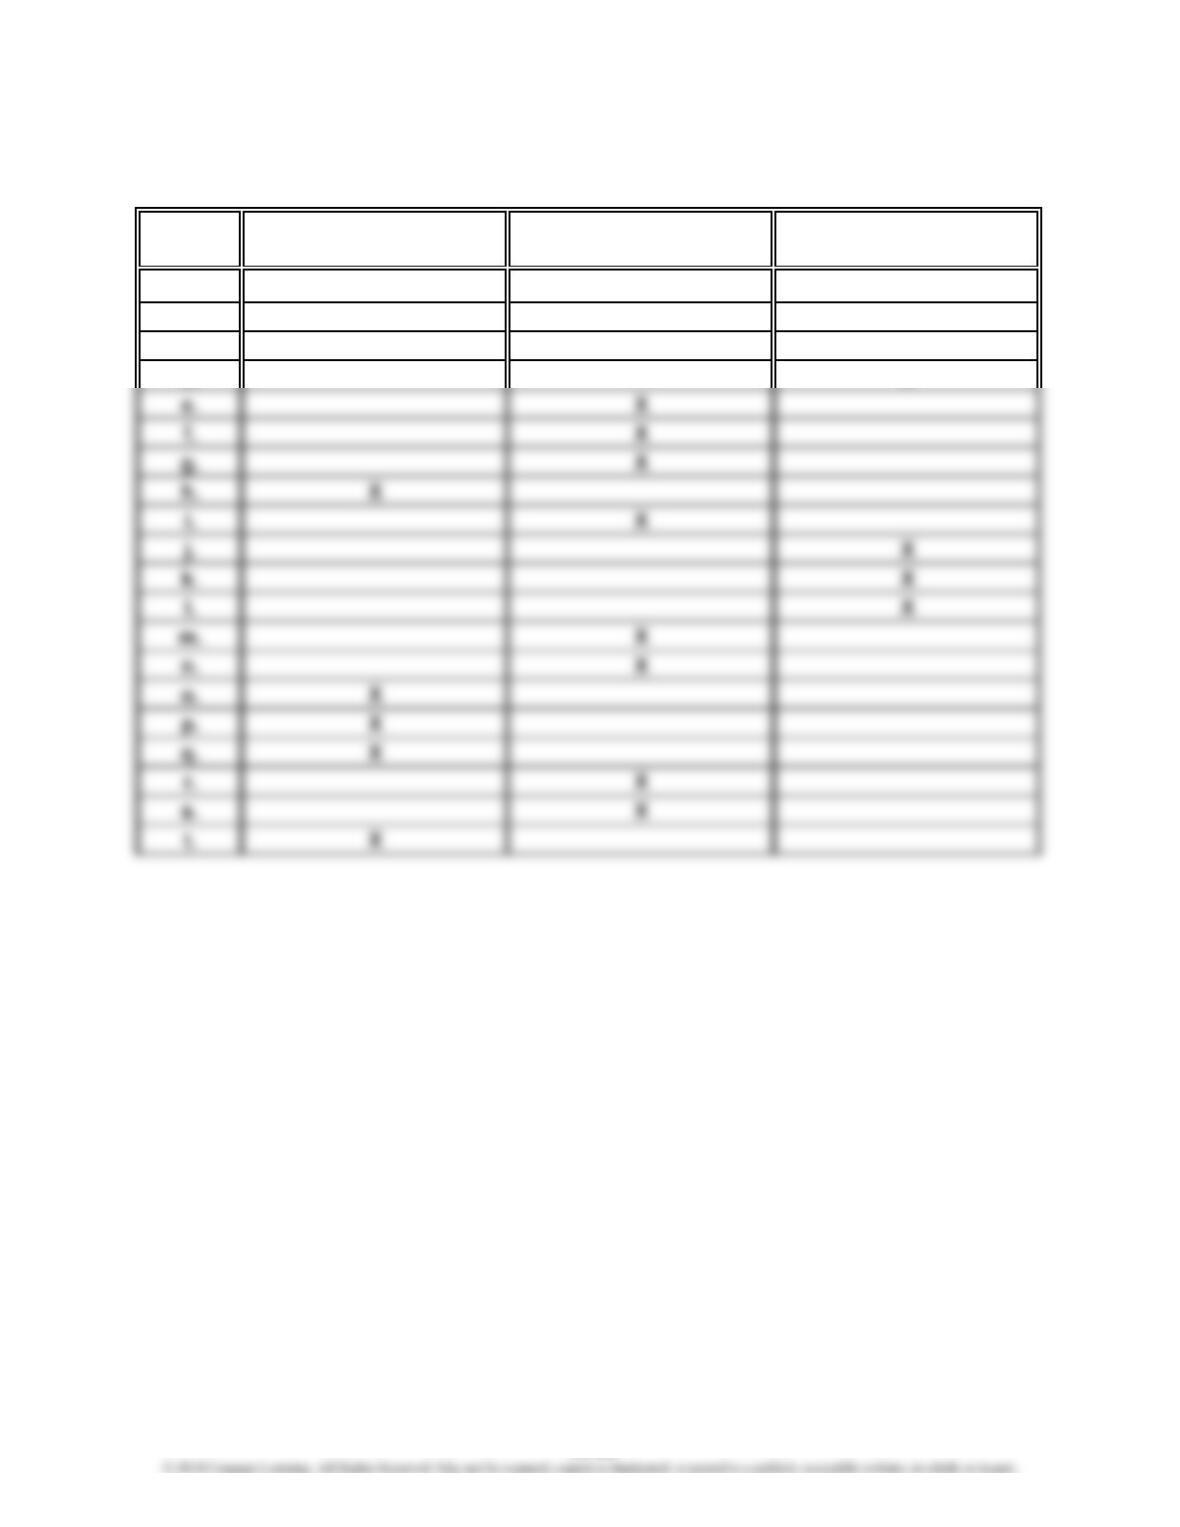
Prob. 19–1A (FIN MAN); Prob. 4–1A (MAN)
Fixed Variable Mixed
Cost Cost Cost Cost
a. X
b. X
c. X
d. X
PROBLEMS
19-20


