Unlock document.
This document is partially blurred.
Unlock all pages and 1 million more documents.
Get Access
191
P6–2
1.
a. b.
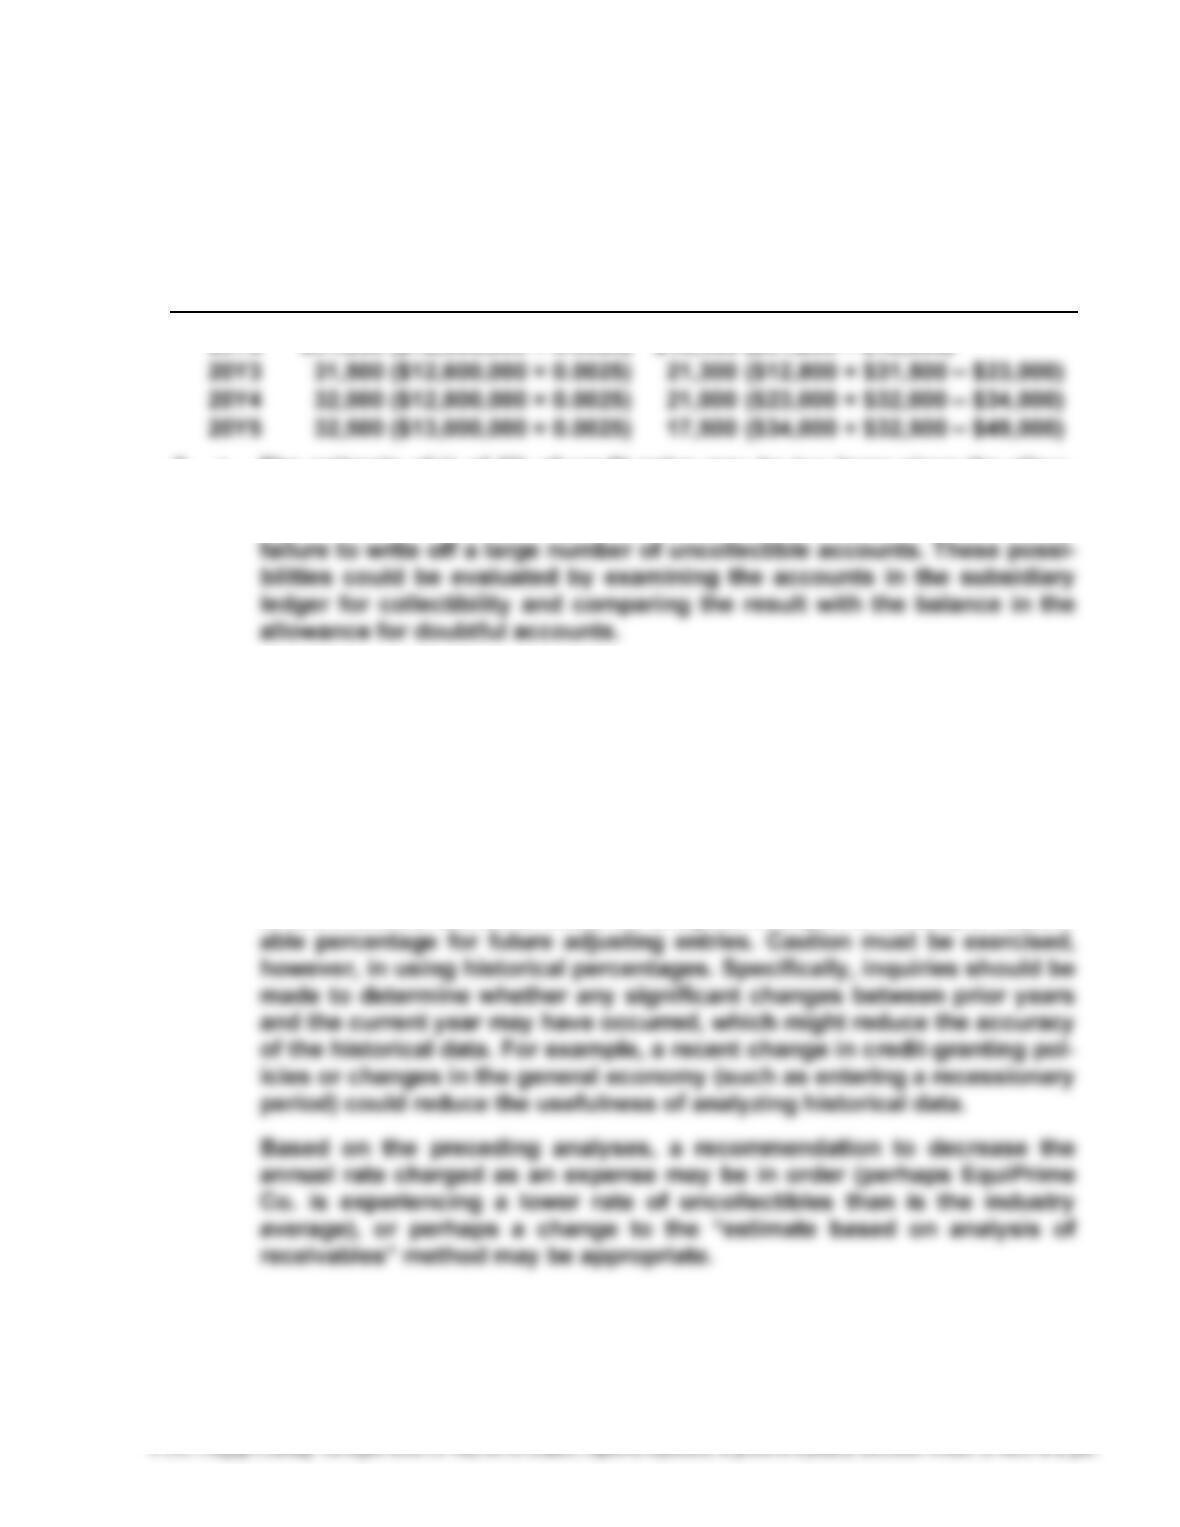
Addition to Allowance Accounts Written
Year for Doubtful Accounts Off During Year
2. a. The estimate of ¼ of 1% of credit sales may be too large since the allow-
ance for doubtful accounts has steadily increased each year. The increas-
ing balance of the allowance for doubtful accounts may also be due to the
Note to Instructors: Since the amount of credit sales has been fairly uniform over
the years, the increase cannot be explained by an expanding volume of sales.
b. The balance of Allowance for Doubtful Accounts that should exist at
December 31, 20Y5, can only be determined after all attempts have been
made to collect the receivables on hand at December 31, 20Y5. However,
the account balances at December 31, 20Y5, could be analyzed, perhaps
using an aging schedule, to determine a reasonable amount of allowance
and to determine accounts that should be written off. Also, past write-offs
of uncollectible accounts could be analyzed in depth to develop a reason-
192
P6–3
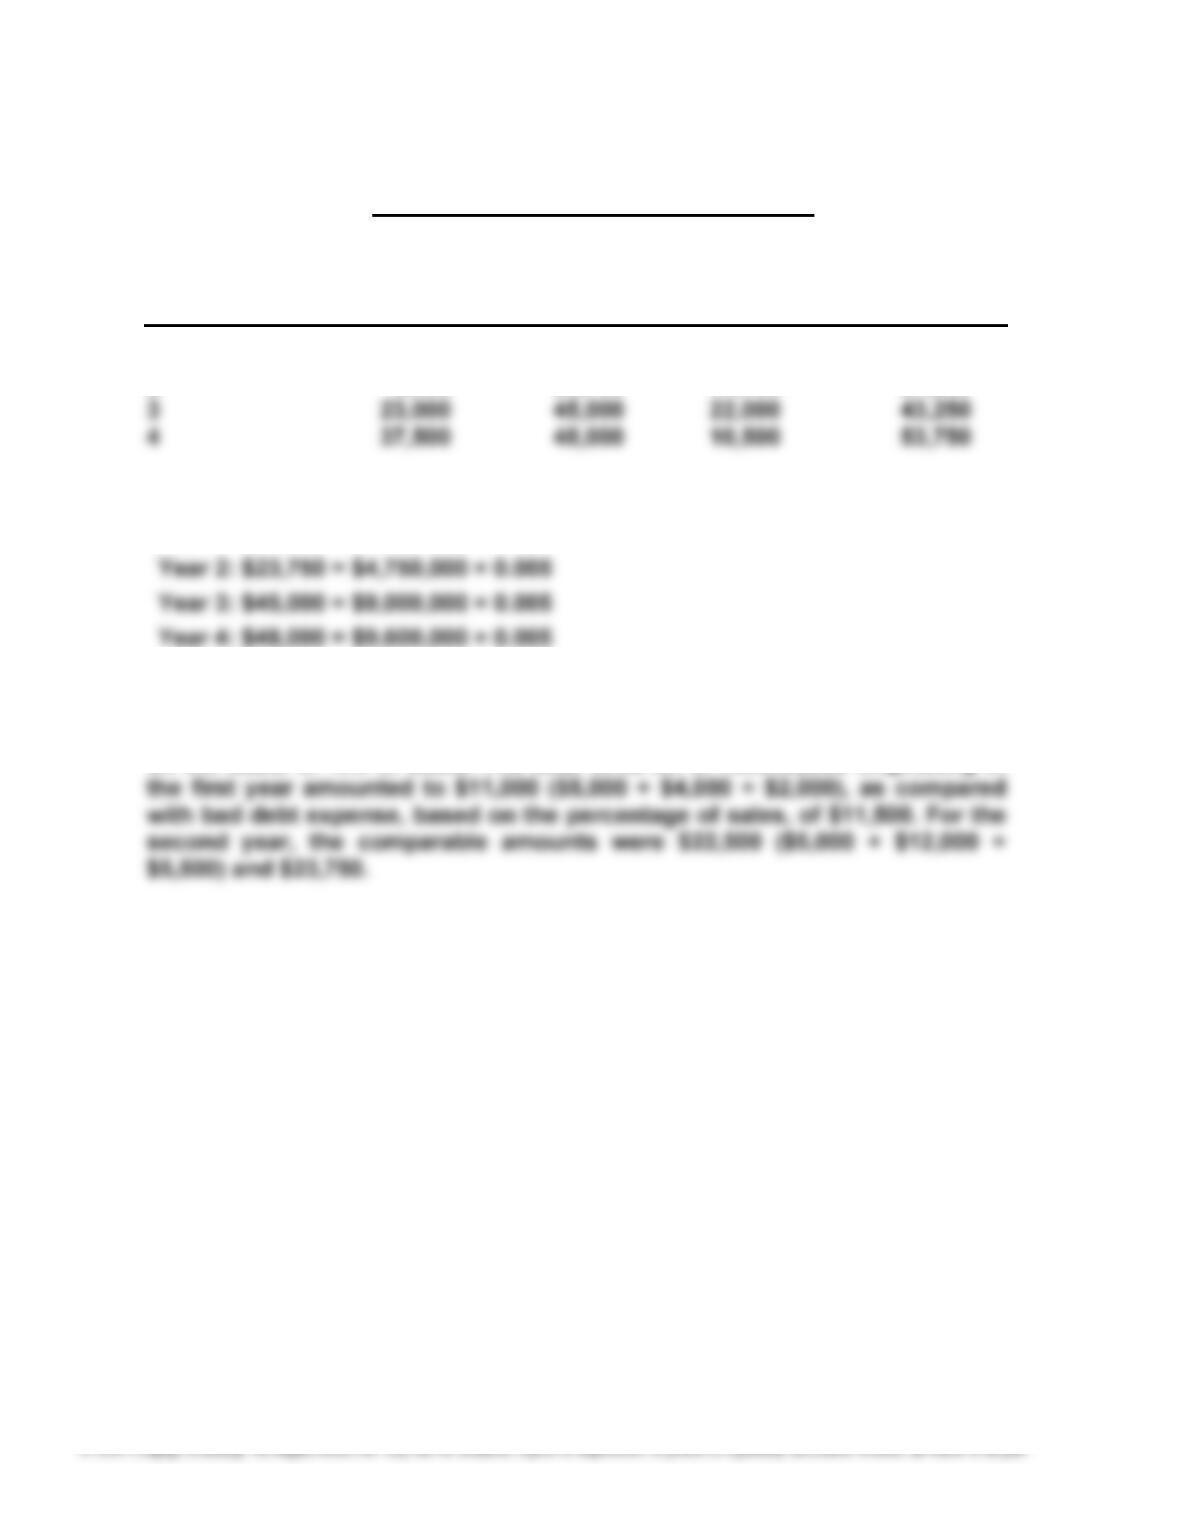
1. Bad Debt Expense
Increase Balance of
Expense Expense (Decrease) Allowance
Actually Based on in Amount Account,
Year Reported Estimate* of Expense End of Year
1 $ 5,000 $ 11,500 $ 6,500 $ 6,500
2 9,000 23,750 14,750 21,250
*Determined by multiplying sales by 0.005 as follows:
Year 1: $11,500 = $2,300,000 × 0.005
2. Yes. The actual write-offs of accounts originating in the first two years are
reasonably close to the expense that would have been charged to those years
193
P6–4
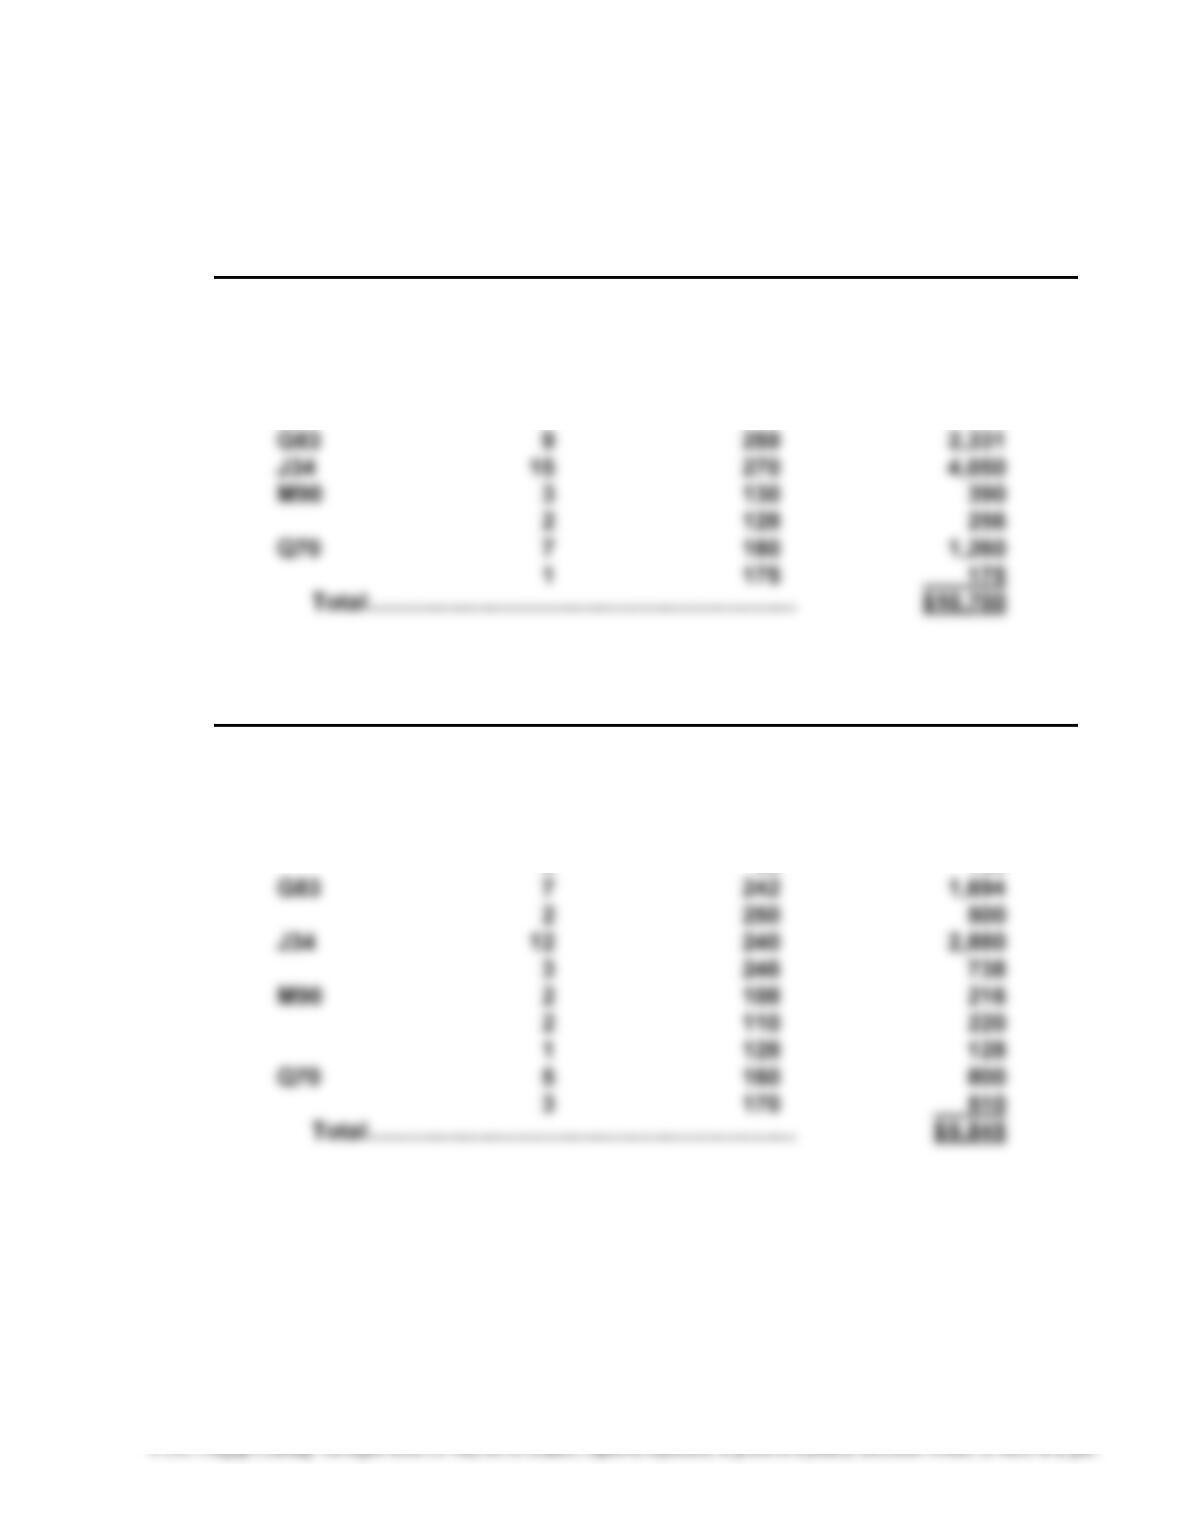
1. First-In, First-Out Method
Model Quantity Unit Cost Total Cost
A10 4 $ 76 $ 304
2 70 140
B15 6 184 1,104
2 170 340
E60 5 70 350
2. Last-In, First-Out Method
Model Quantity Unit Cost Total Cost
A10 4 $ 64 $ 256
2 70 140
B15 8 176 1,408
E60 3 75 225
194
P6–4, Concluded
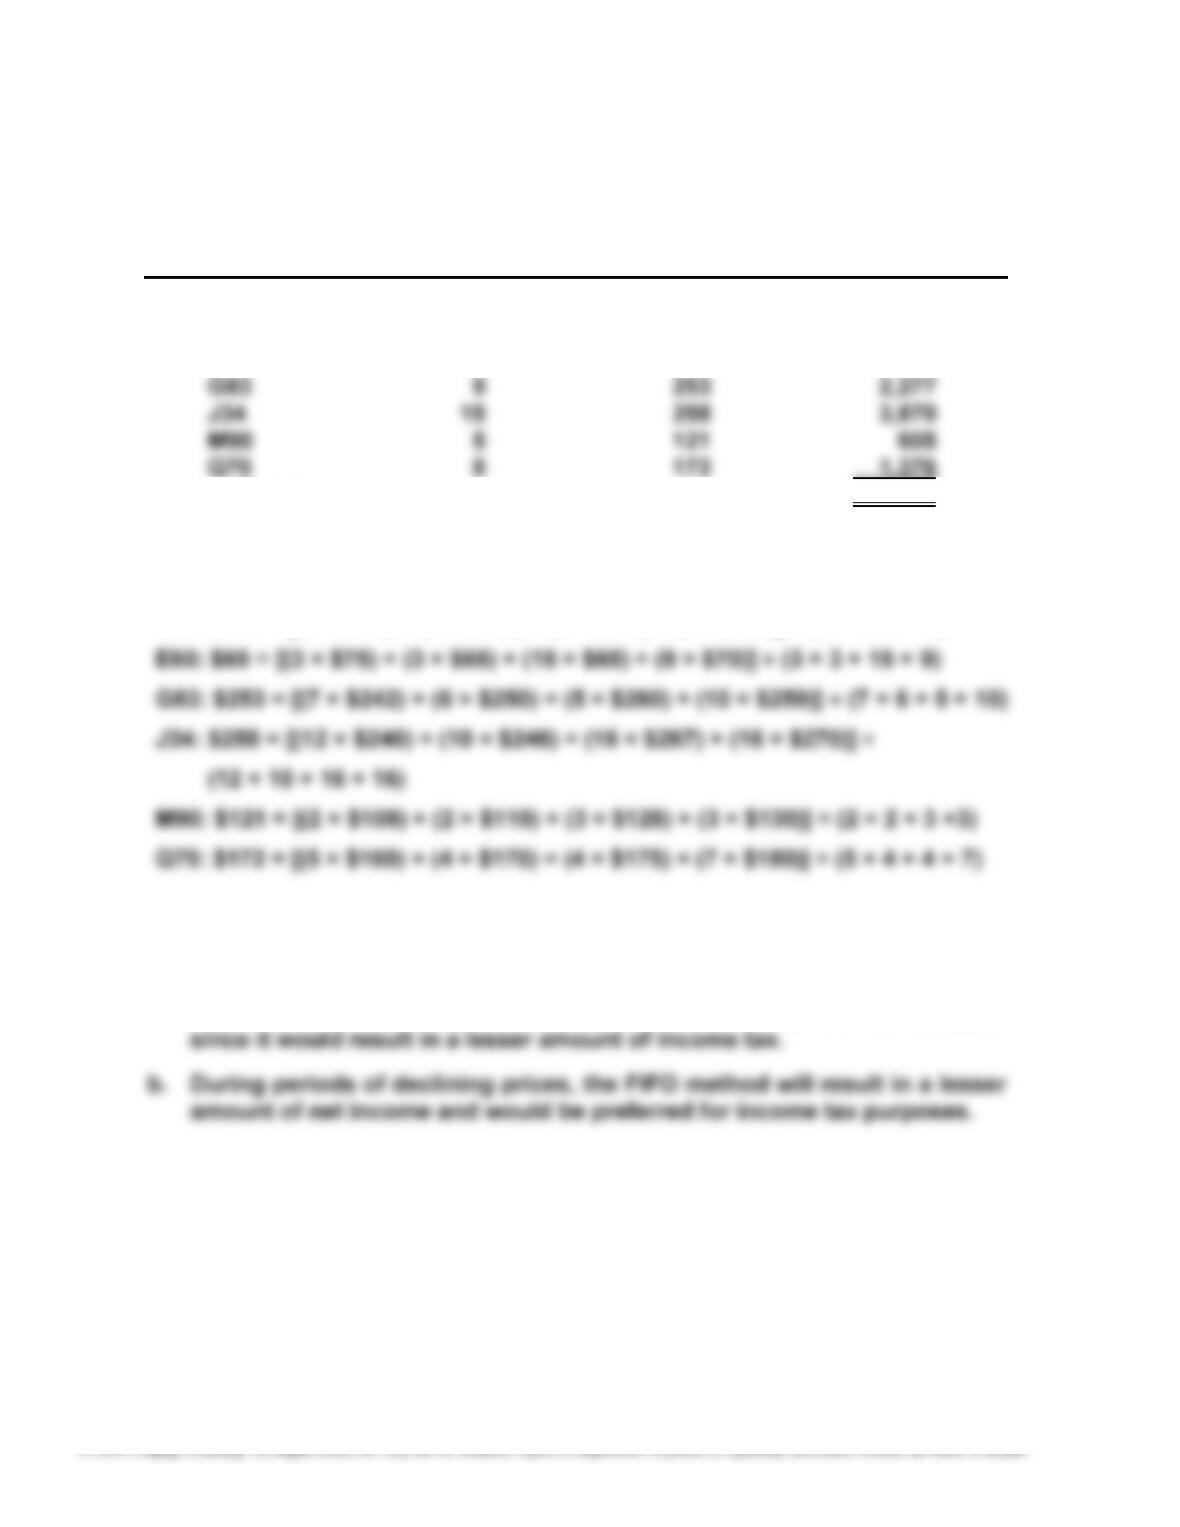
3. Weighted Average Cost Method
Model Quantity Unit Cost Total Cost
A10 6 $ 70 $ 420
B15 8 174 1,392
E60 5 69 345
Total ................................................................. $10,285
Computations of unit costs:
A10: $70 = [(4 × $64) + (4 × $70) + (4 × $76)] ÷ (4 + 4 + 4)
B15: $174 = [(8 × $176) + (4 × $158) + (3 × $170) + (6 × $184)] ÷ (8 + 4 + 3 + 6)
4. a. During periods of rising prices, the LIFO method will result in a lesser
amount of inventory, a greater amount of the cost of goods sold, and a
lesser amount of net income than the other two methods. For Amsterdam
Appliances, the LIFO method would be preferred for the current year
195
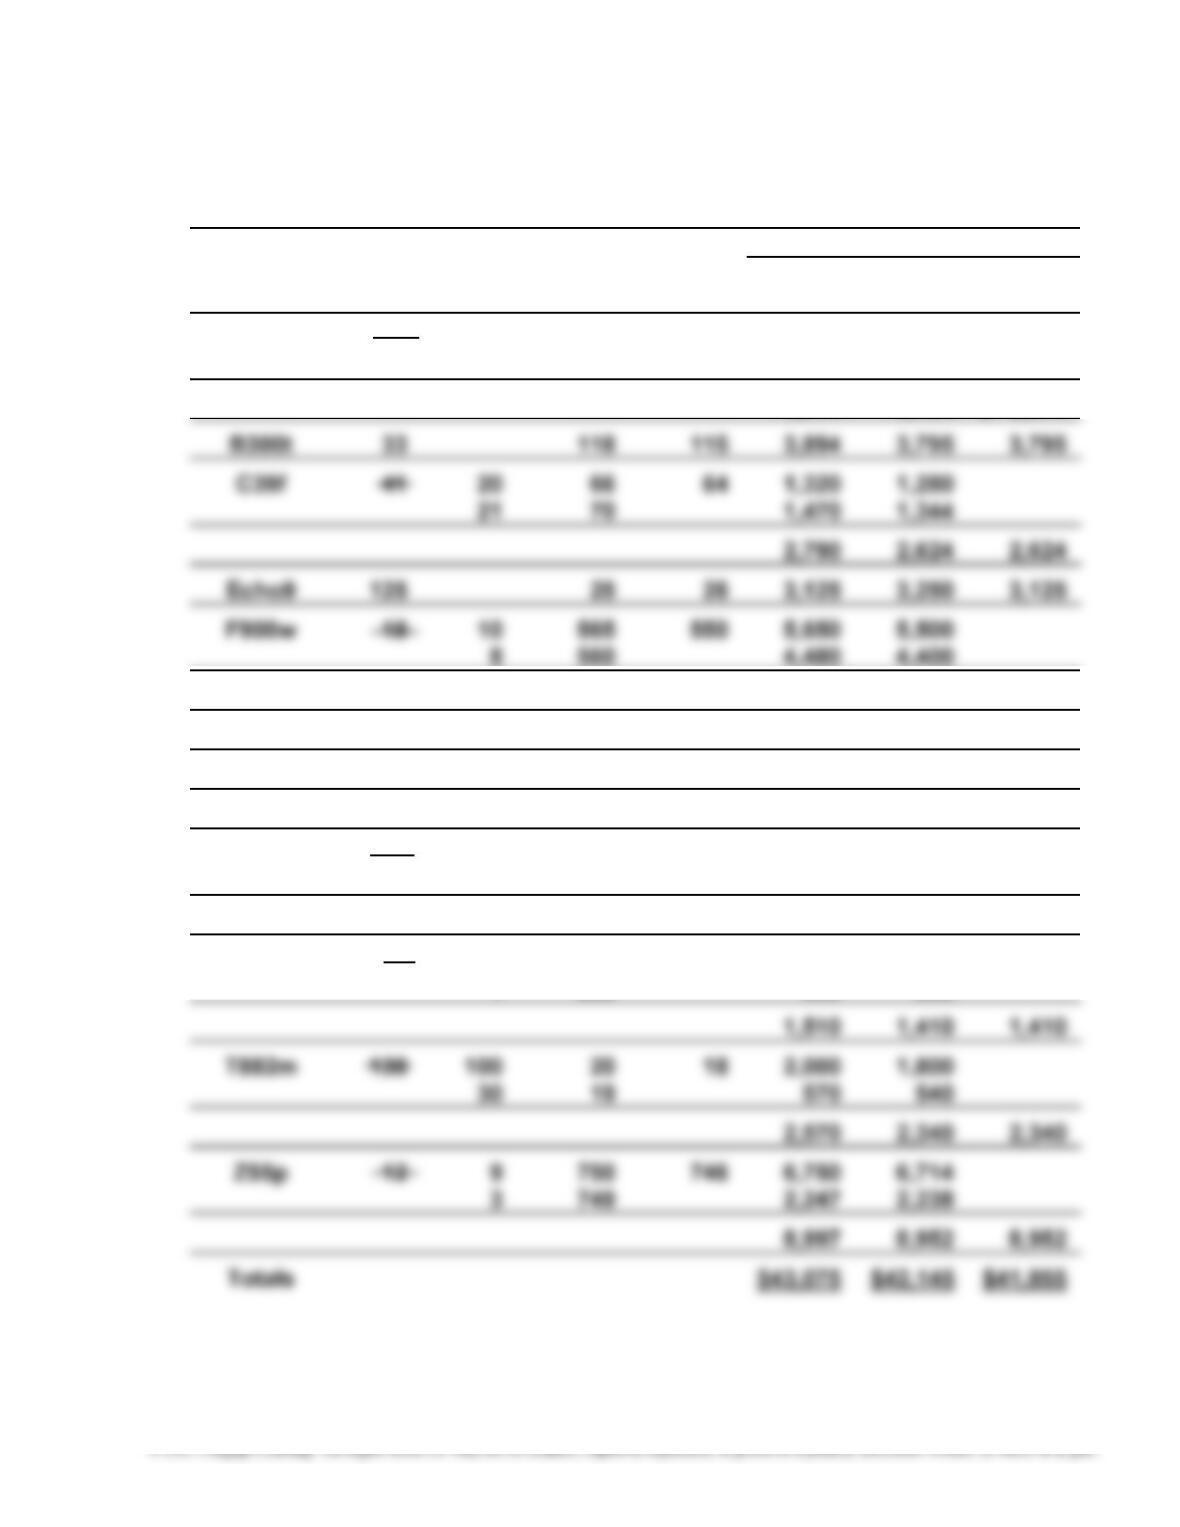
P6–5
Inventory Sheet
December 31, 20Y9
Unit Unit Total
Inventory Cost Market
Description Quantit
y
Price Price Cost Market LCM
112Aa 38 25 $ 80 $ 83 $ 2,000 $2,075
13 78 1,014 1,079
3,014 3,154 $ 3,014
10,130 9,900 9,900
H687 60 15 15 900 900 900
J023 5 385 390 1,925 1,950 1,925
L33
y
375 6 6 2,250 2,250 2,250
R66b 90 80 22 18 1,760 1,440
10 21 210 180
1,970 1,620 1,620
S77x 6 5 250 235 1,250 1,175
196
METRIC-BASED ANALYSIS
MBA 6–1
Transaction Liquidity Metric Profitability Metric
Days’ Sales Return on
Date Description in Receivables Sales
Mar. 18 Collected cash Decrease No effect
18 Wrote off account Decrease Decrease
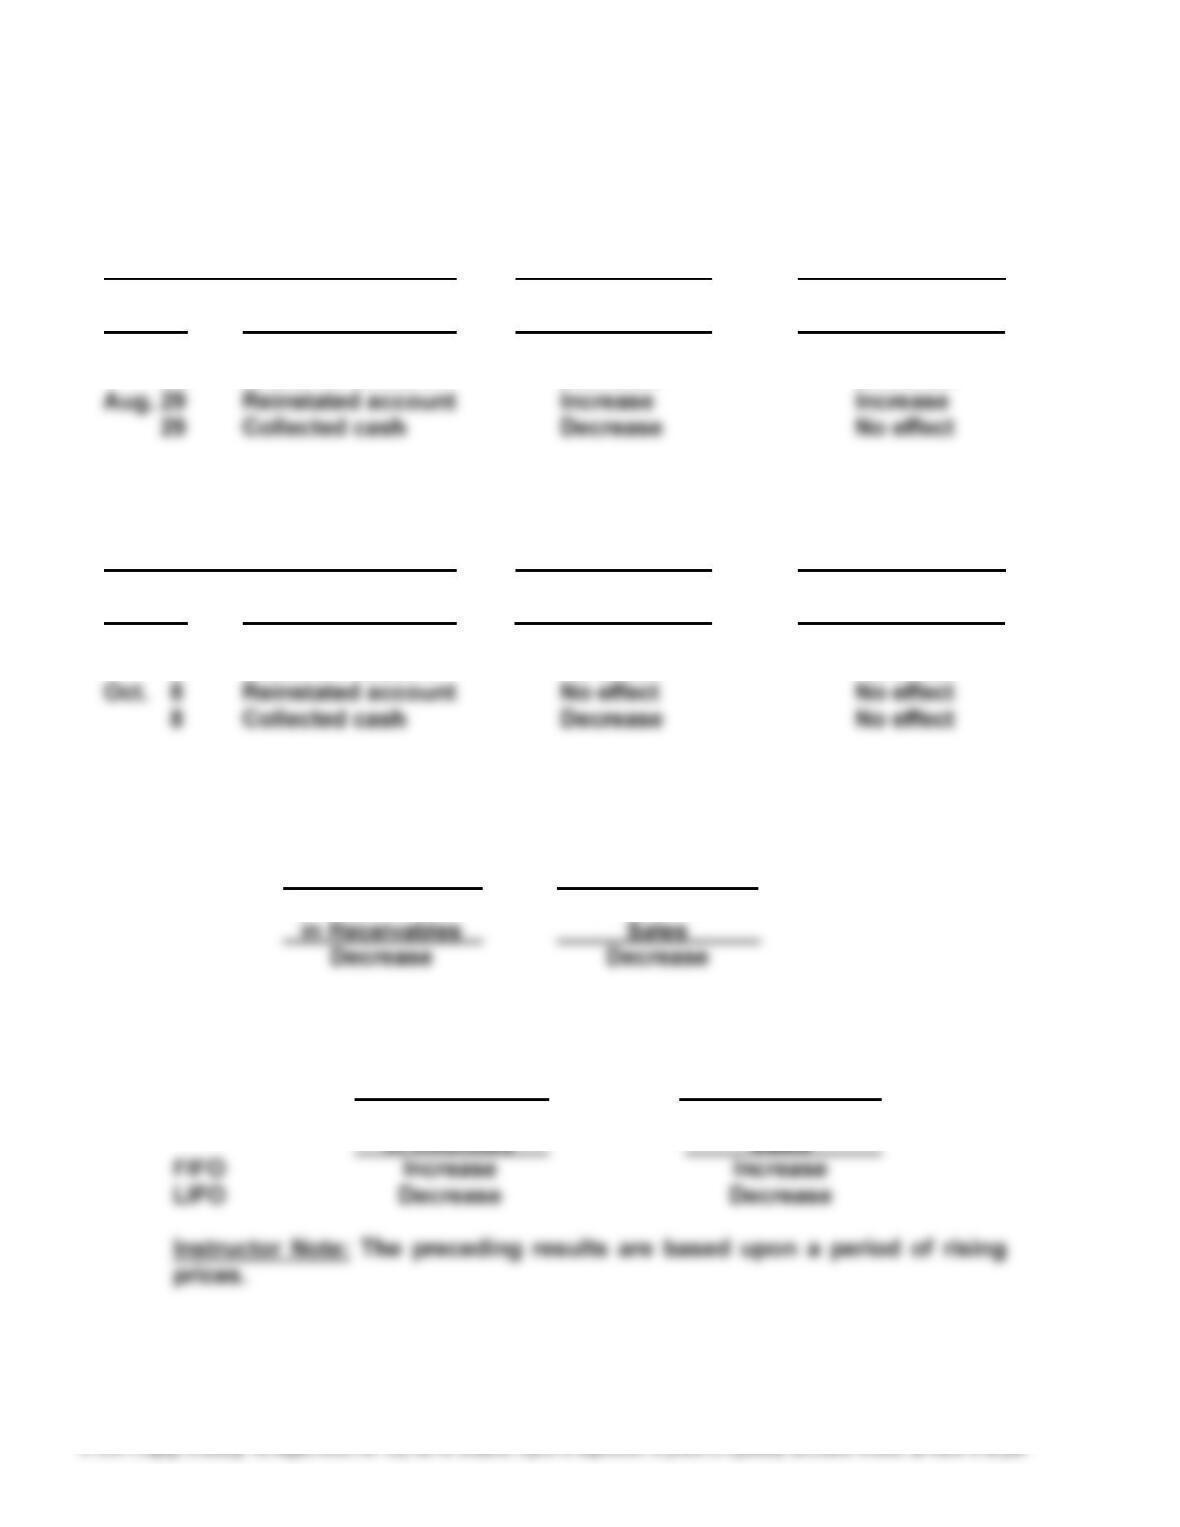
MBA 6–2
Transaction Liquidity Metric Profitability Metric
Days’ Sales Return on
Date Description in Receivables Sales
July 3 Collected cash Decrease No effect
3 Wrote off account No effect No effect
MBA 6–3
Liquidity Metric Profitability Metric
Days’ Sales Return on
MBA 6–4
Liquidity Metric Profitability Metric
Days’ Sales Return on
197
MBA 6–5
Liquidity Metric Profitability Metric
Days’ Sales Return on
MBA 6–6
1. Year 2 Year 1
Accounts receivable turnover:
$229,234 ÷ $16,814 ........................ 13.6
$215,639 ÷ $14,802 ........................ 14.6
3. Inventory turnover:
$141,048 ÷ $3,494 .......................... 40.4
$131,376 ÷ $2,241 .......................... 58.6
5. Return on sales
$61,344 ÷ $229,234 ........................ 26.8%
$60,024 ÷ $215,639 ........................ 27.8%
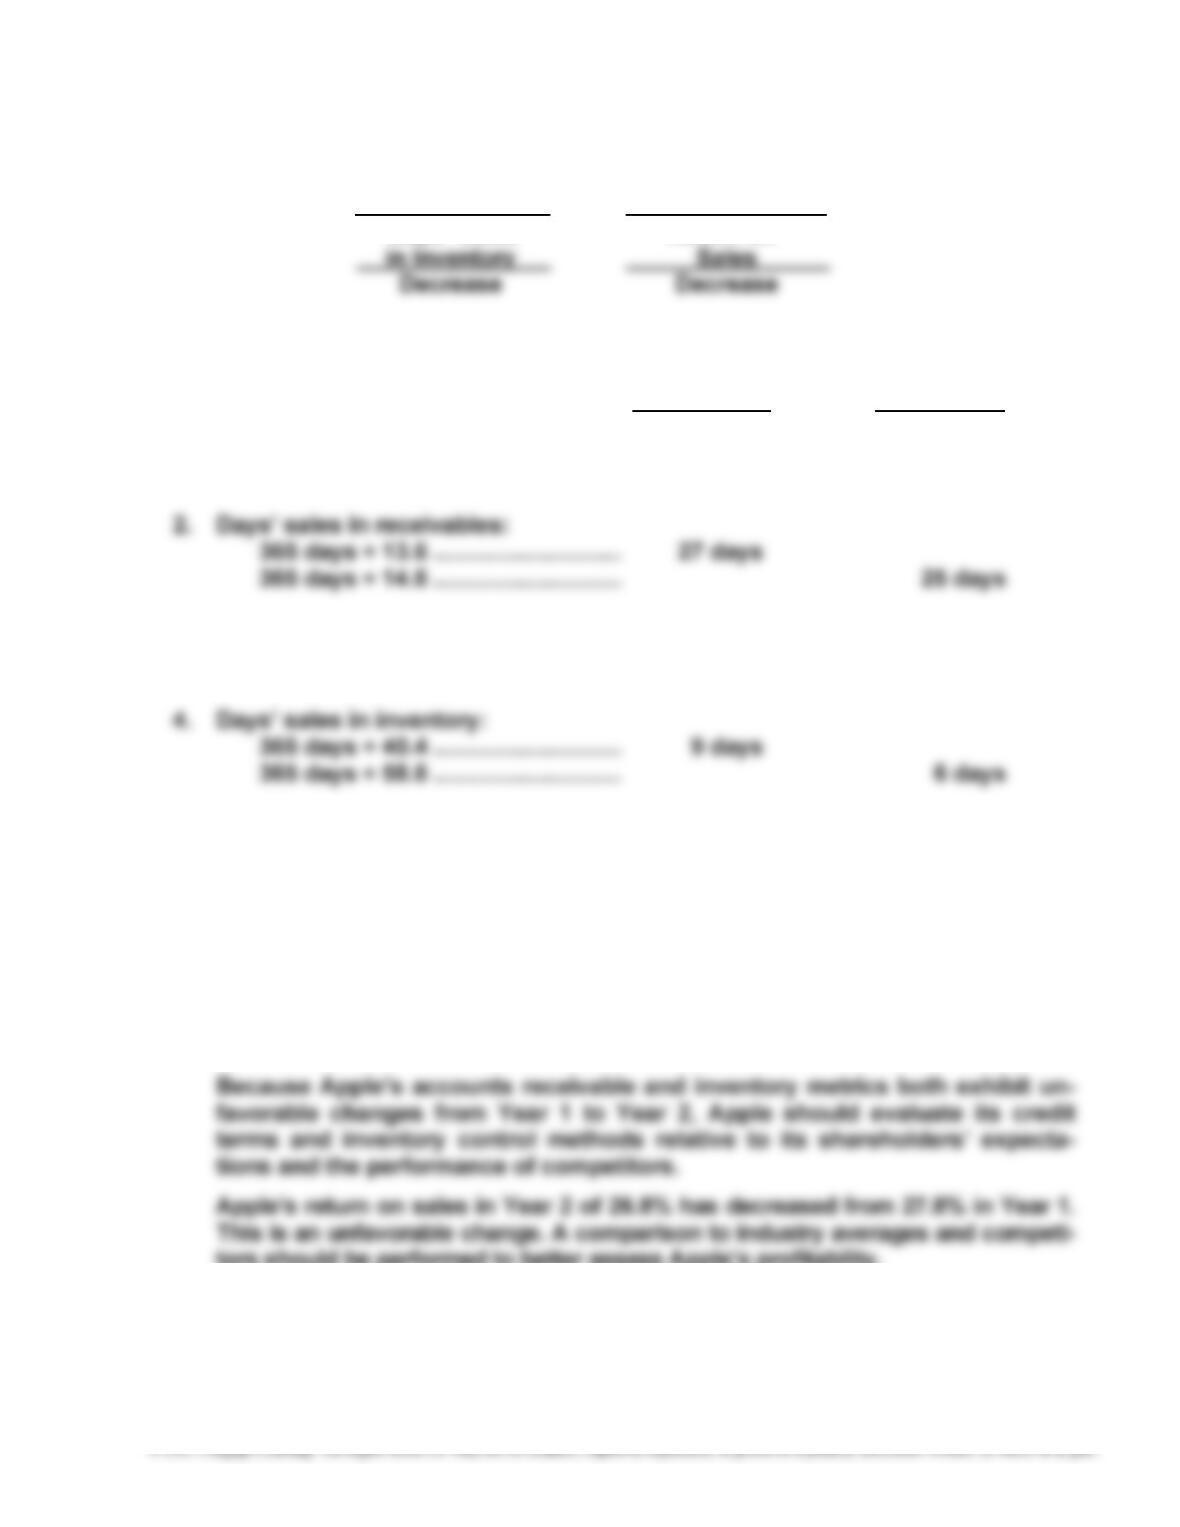
6. Apple’s accounts receivable turnover in Year 2 of 13.6 has decreased slightly
from 14.6 in Year 1. Days’ sales in receivables has increased from 25 days to
27 days. This is an unfavorable change. Apple’s inventory turnover in Year 2
of 40.4 has decreased from 58.6 in Year 1. Days’ sales in inventory has in-
creased from 6 days in Year 1 to 9 days in Year 2. In general, this is also con-
sidered an unfavorable change.
tors should be performed to better assess Apple’s profitability.
198
MBA 6–7
1. Year 2 Year 1
Accounts receivable turnover:
$52,056 ÷ $4,264 ........................... 12.2
$48,238 ÷ $4,470 ........................... 10.8
2. Days’ sales in receivables:
365 days ÷ 12.2 ............................. 30 days
365 days ÷ 10.8 ............................. 34 days
5. Return on sales
$3,519 ÷ $52,056 ........................... 6.8%
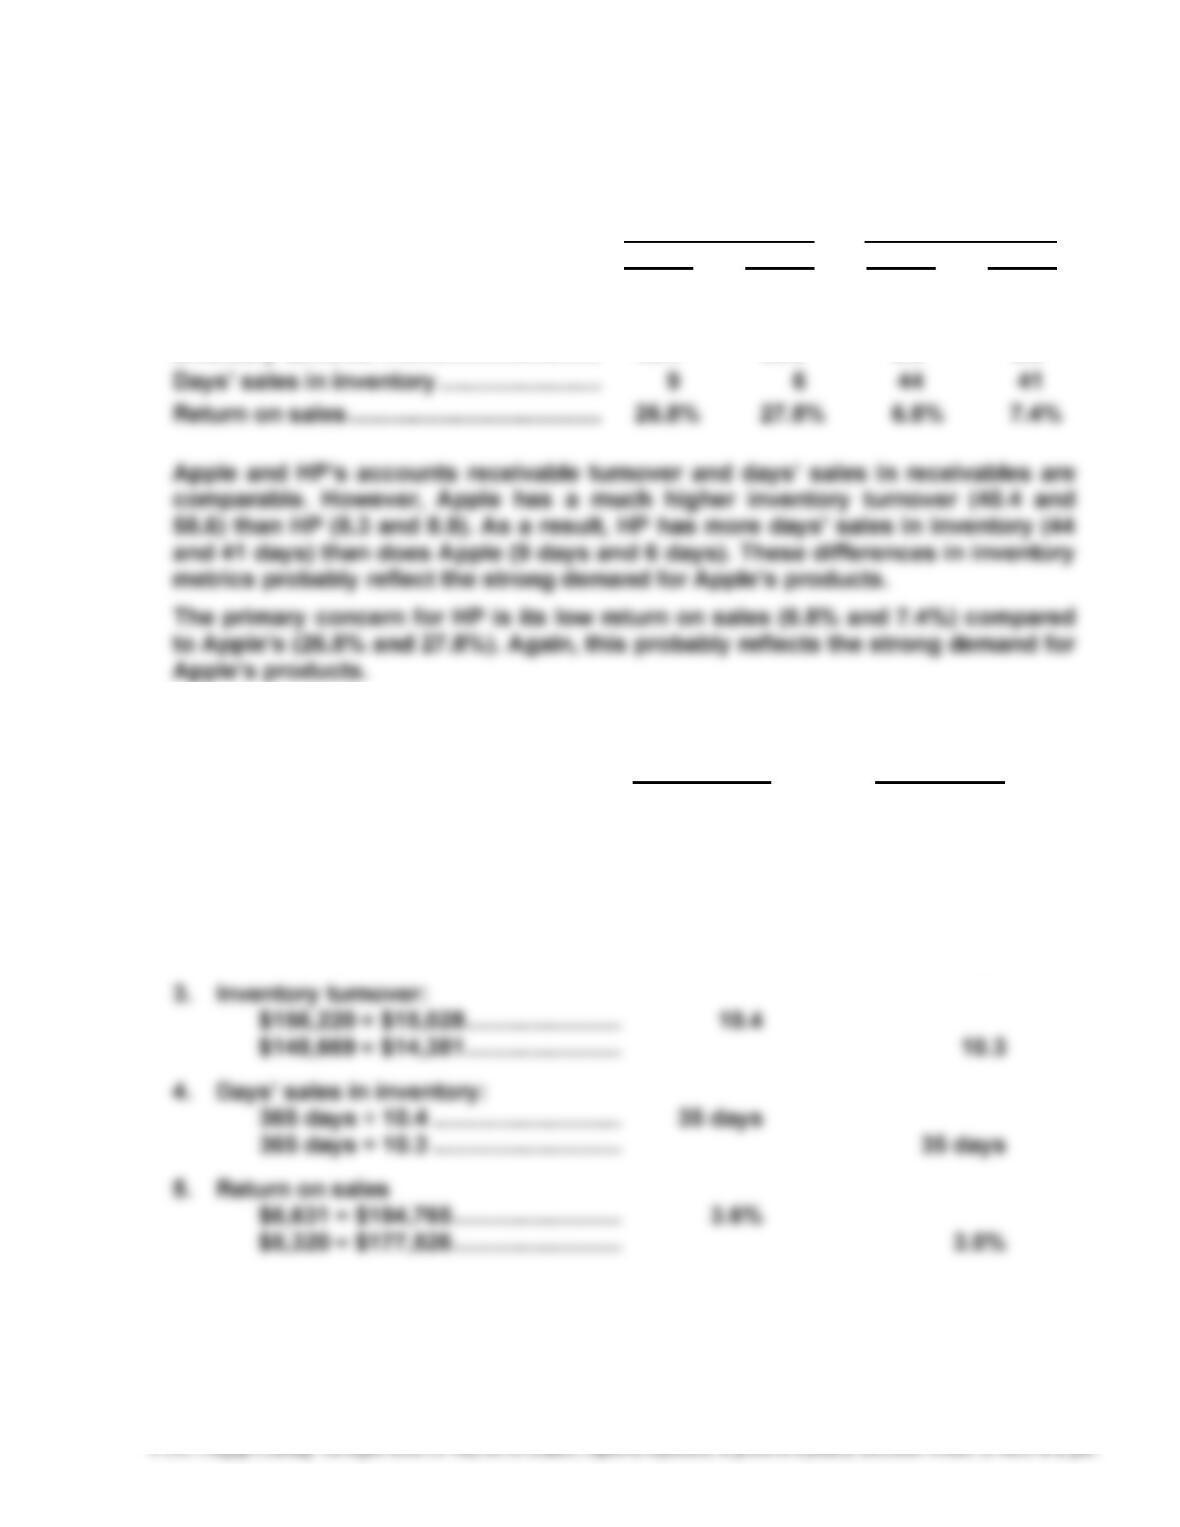
$3,549 ÷ $48,238 ........................... 7.4%
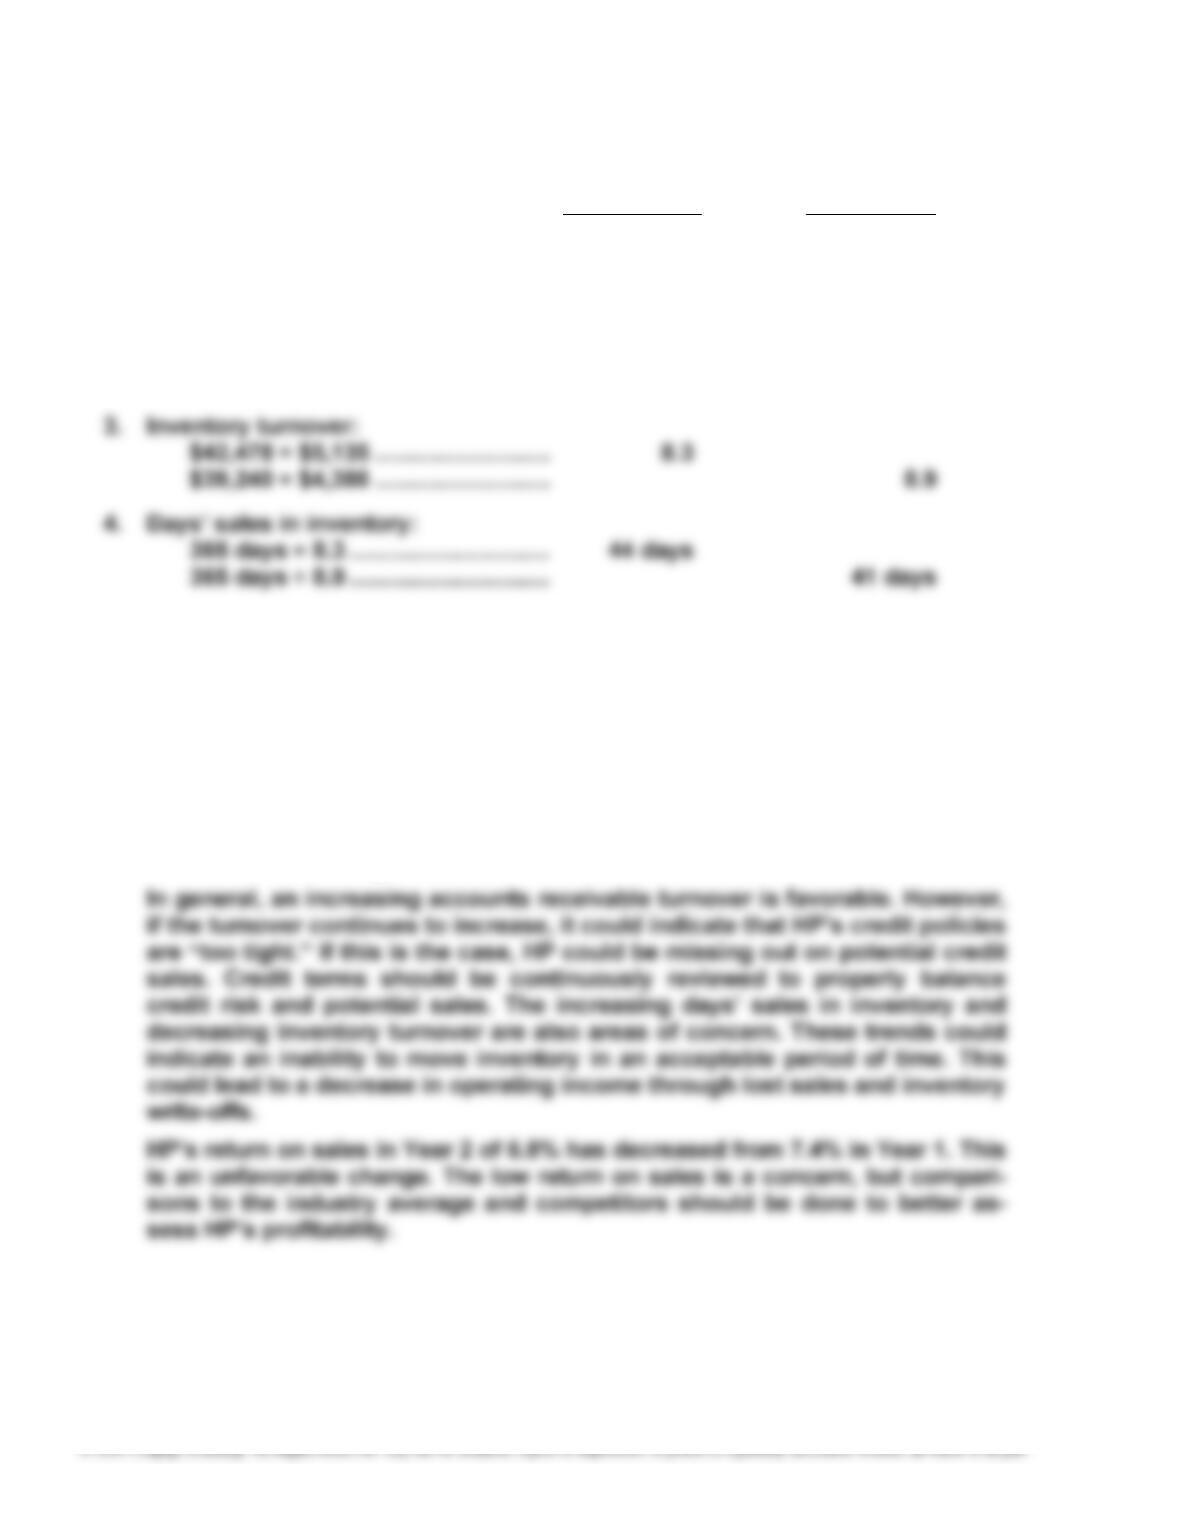
6. HP’s accounts receivable turnover in Year 2 of 12.2 has increased slightly
from 10.8 in Year 1. Days’ sales in receivables has decreased from 34 days in
Year 1 to 30 days in Year 2. This is a favorable change. HP’s inventory turno-
ver in Year 2 of 8.3 has decreased from 8.9 in Year 1. As a result, days’ sales
in inventory has increased from 41 days in Year 1 to 44 days in Year 2. This is
an unfavorable change.
199
MBA 6–8
The results of MBA 6–6 and MBA 6–7 for Apple and HP are summarized below.
Apple HP
Year 2 Year 1 Year 2 Year 1
Accounts receivable turnover................ 13.6 14.6 12.2 10.8
Days’ sales in receivables ...................... 27 25 30 34
Inventory turnover .................................. 40.4 58.6 8.3 8.9
MBA 6–9
1. Year 2 Year 1
Accounts receivable turnover:
$184,765 ÷ $12,673 ........................ 14.6
$177,526 ÷ $12,026 ........................ 14.8
2. Days’ sales in receivables:
365 days ÷ 14.6 ............................. 25 days
365 days ÷ 14.8 ............................. 25 days
200
MBA 6–9, Concluded
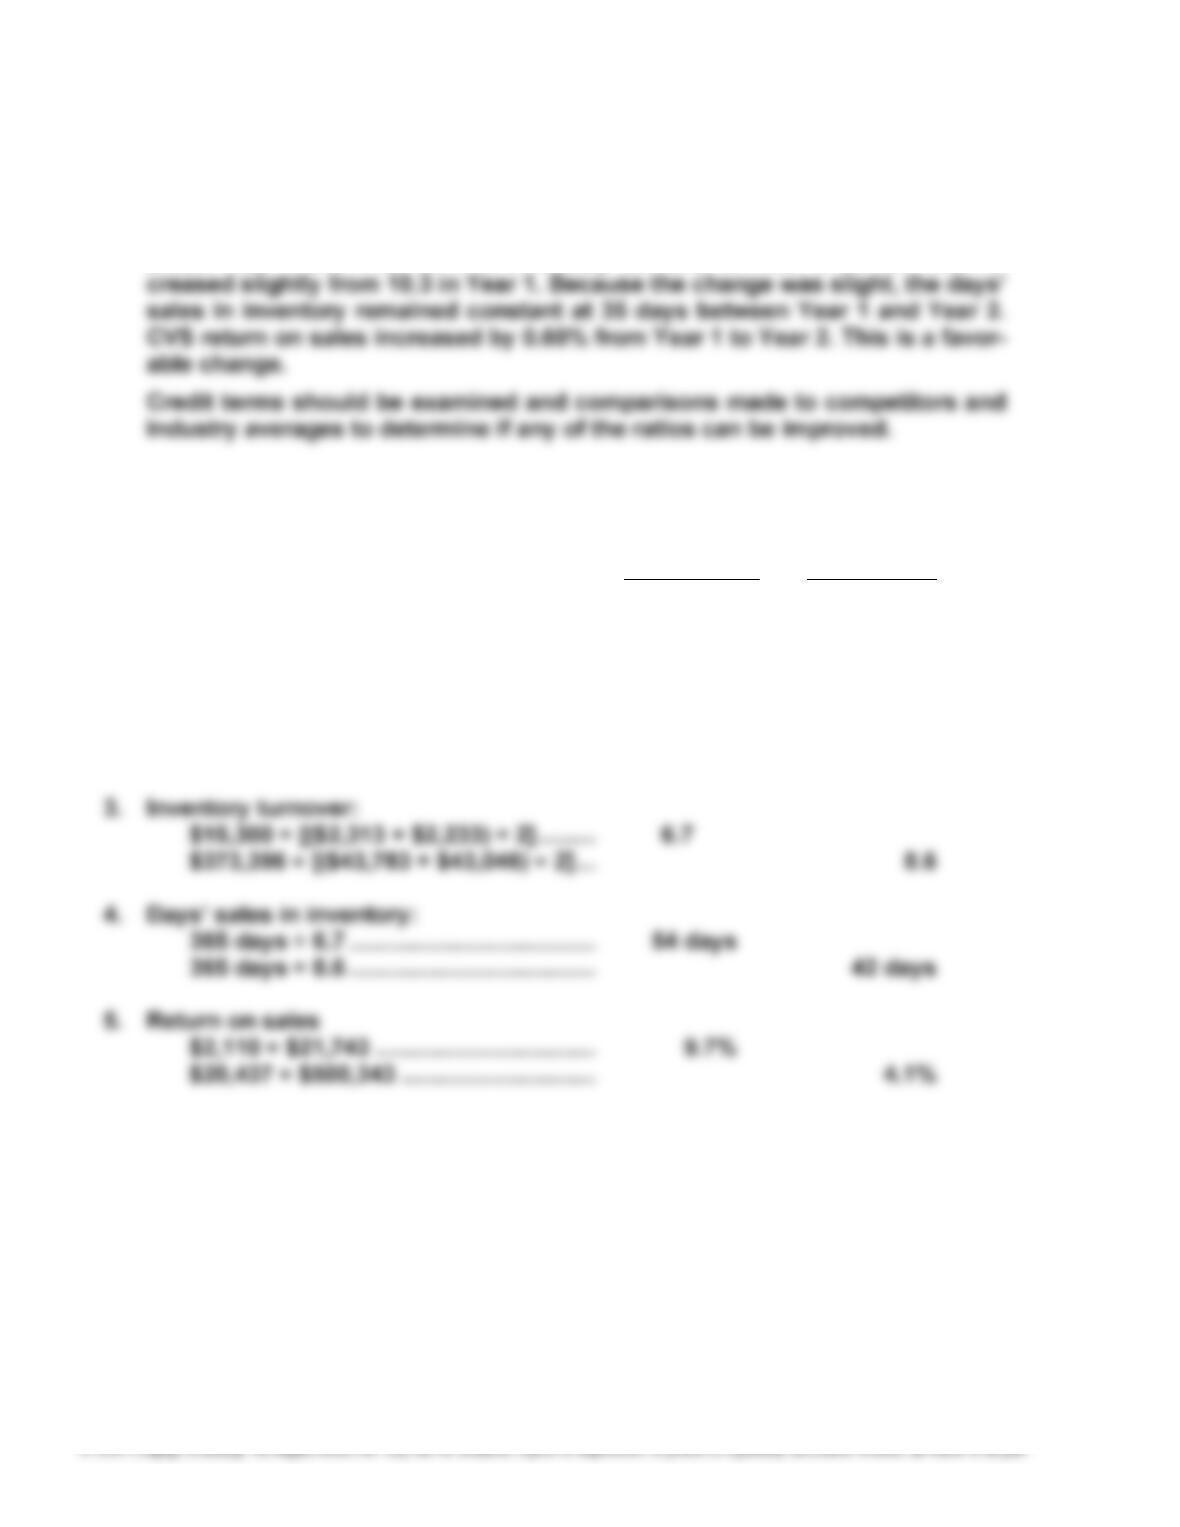
6. CVS accounts receivable turnover in Year 2 of 14.6 has decreased from 14.8
in Year 1. The days’ sales in receivables remained constant at 25 days be-
tween Year 1 and Year 2. CVS inventory turnover in Year 2 of 10.4 has in-
MBA 6–10
1. International
Paper Walmart
Accounts receivable turnover:
$21,743 ÷ [($3,287 + $2,852) ÷ 2] ......... 7.1
$500,343 ÷ [($5,614 + $5,835) ÷ 2] ....... 87.4
2. Days’ sales in receivables:
365 days ÷ 7.1 ...................................... 51 days
365 days ÷ 87.4 .................................... 4 days
201
MBA 6–10, Concluded
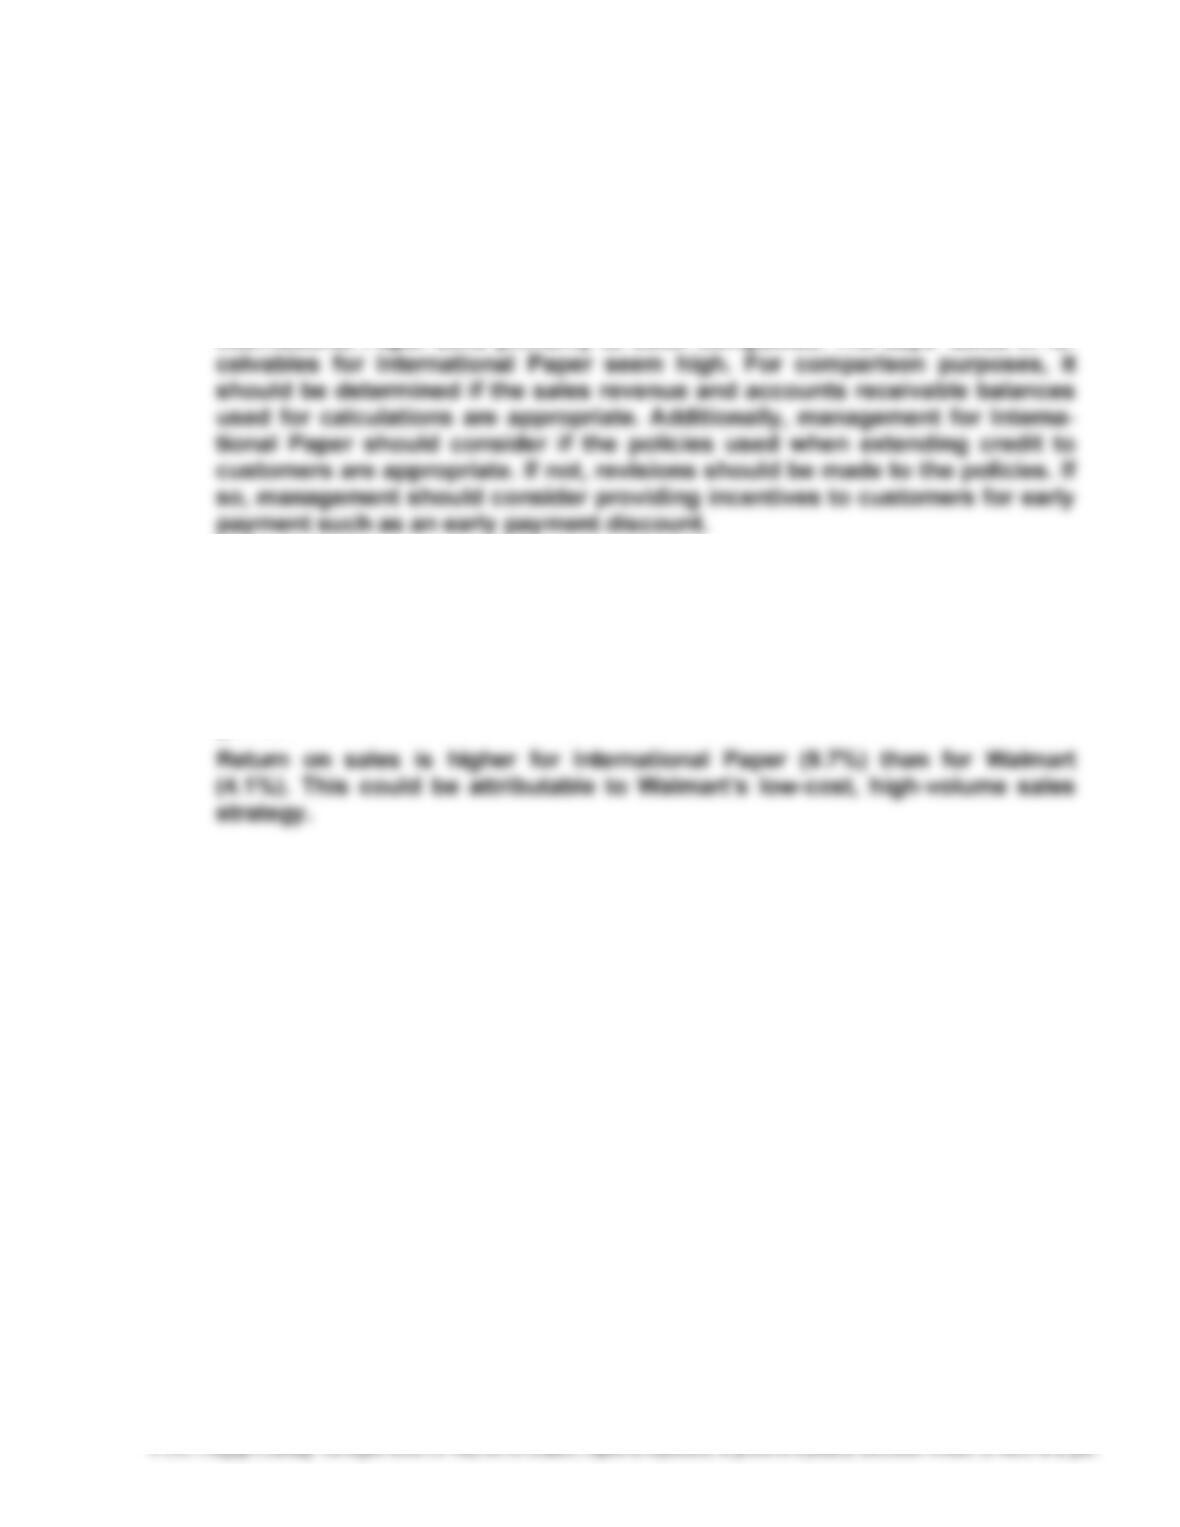
6. International Paper’s accounts receivable turnover of 7.1 is significantly less
than Walmart’s accounts receivable turnover of 87.4. Likewise, International
Paper’s days’ sales in receivables of 51 is significantly more than Walmart’s
days’ sales in receivables of 4. These differences are likely due to Walmart
selling directly to consumers who use cash or credit cards. In contrast,
The inventory turnover and days’ sales in inventory do not differ significantly
between the two companies. International Paper has a slightly lower inventory
turnover (6.7) and more days’ sales in inventory (54 days) than Walmart’s
inventory turnover (8.6) and days’ sales in inventory (42 days). This difference
is probably attributable to the fact that Walmart sells both perishable and
nonperishable goods, whereas International Paper only sells nonperishable
goods.
202
CASES
Case 6–1
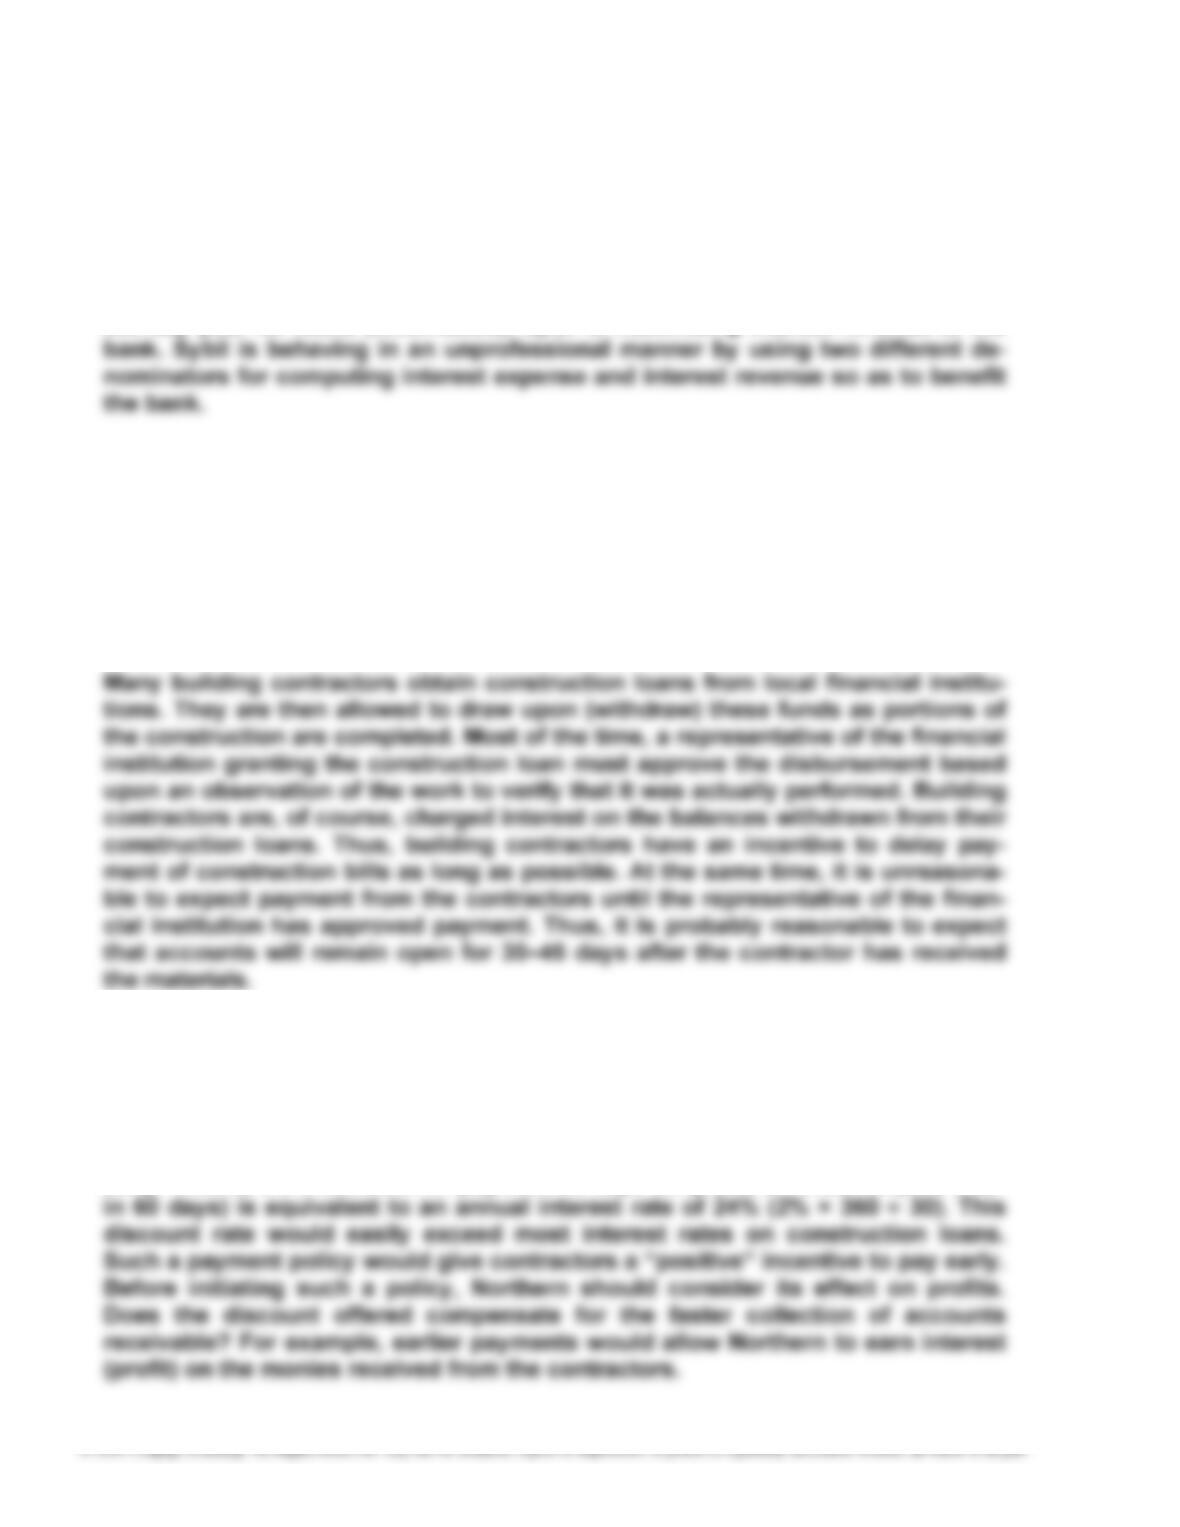
By computing interest using a 365-day year for depository accounts (payables),
Sybil is minimizing interest expense to the bank. By computing interest using a
360-day year for loans (receivables), Sybil is maximizing interest revenue to the
Case 6–2
Because of the size and number of customers’ accounts, it is probably unreason-
able for Northern Construction Supplies Co. not to allow credit to contractors and
to require cash or credit card payment. To do so, as Janet points out, would
probably cost Northern most of its contractor customers. Thus, Northern is faced
with having to allow credit to its contracting customers.
The primary problem that Northern Construction Supplies Co. is facing is that
some contractors are apparently abusing Northern’s liberal credit policy. One al-
ternative would be for Northern to allow a discount for payment within 30 days.
For example, Northern might allow a 2% discount if the bill is paid within 30 days.
Credit then might be discontinued for any contractor with a bill outstanding more
than 60 days. This would provide the contractors an incentive to pay their bills
early. That is, a 2% discount for payment 30 days early (the bill must be paid with-
203
Case 6–2, Concluded
Note: Statement of activity indicates most contractors pay their receivables, but
they just take their time.
An alternative approach would be to charge contractors interest on overdue
accounts. For example, Northern might charge accounts over 60 days past due
interest at 1½% per month (equivalent to approximately 18% per year). This
approach would be more of a “negative” approach to motivating contractors to
pay earlier.
Case 6–3
Since the title to merchandise shipped FOB shipping point passes to the buyer
when the merchandise is shipped, the shipments made before midnight, Decem-
ber 31, 20Y1, should properly be recorded as sales for the fiscal year ending
December 31, 20Y1. Hence, Gene Lumpkin is behaving in a professional manner.
204
Case 6–4
In developing a response to Evan’s concerns, you should probably first empha-
size the practical need for an assumption concerning the flow of cost of goods
purchased and sold. That is, when identical goods are frequently purchased, it
may not be practical to specifically identify each item of inventory. If all the iden-
Next, you should emphasize that accounting principles that allow for the physical
flow of the goods may differ from the flow of costs. Specifically, accounting prin-
ciples allow for three cost flow assumptions: first-in, first-out; last-in, first-out;
and average cost. Each of these methods has advantages and disadvantages.
One primary advantage of the last-in, first-out method is that it better matches
current costs (the cost of goods purchased last) with current revenues. There-


