Unlock document.
This document is partially blurred.
Unlock all pages and 1 million more documents.
Get Access

Chapter 21
Question 1
CFROI is more appropriate in businesses where investments are very “lumpy,” such as for chemical companies.
This is due to large upfront investments that likely generate relatively stable cash flow with little future investment needed.
ROIC is more appropriate for businesses where investments occur in a more regular pattern to keep up with competition.
Here, the depreciated capital base is a reasonable approximation of the ability to generate earnings, making ROIC a better choice.
In a practical sense, ROIC is more easily calculated and understood by management.

Chapter 21
Question 2
The difference between CFROI and ROIC estimates is relatively small for nine of ten large U.S. sectors. For all but the IT
sector, this difference between the average of median firm's CFROI in a sector and the avearge of the median firm's ROIC
in the same sector was 3 percent or less.
Chapter 21
Question 3
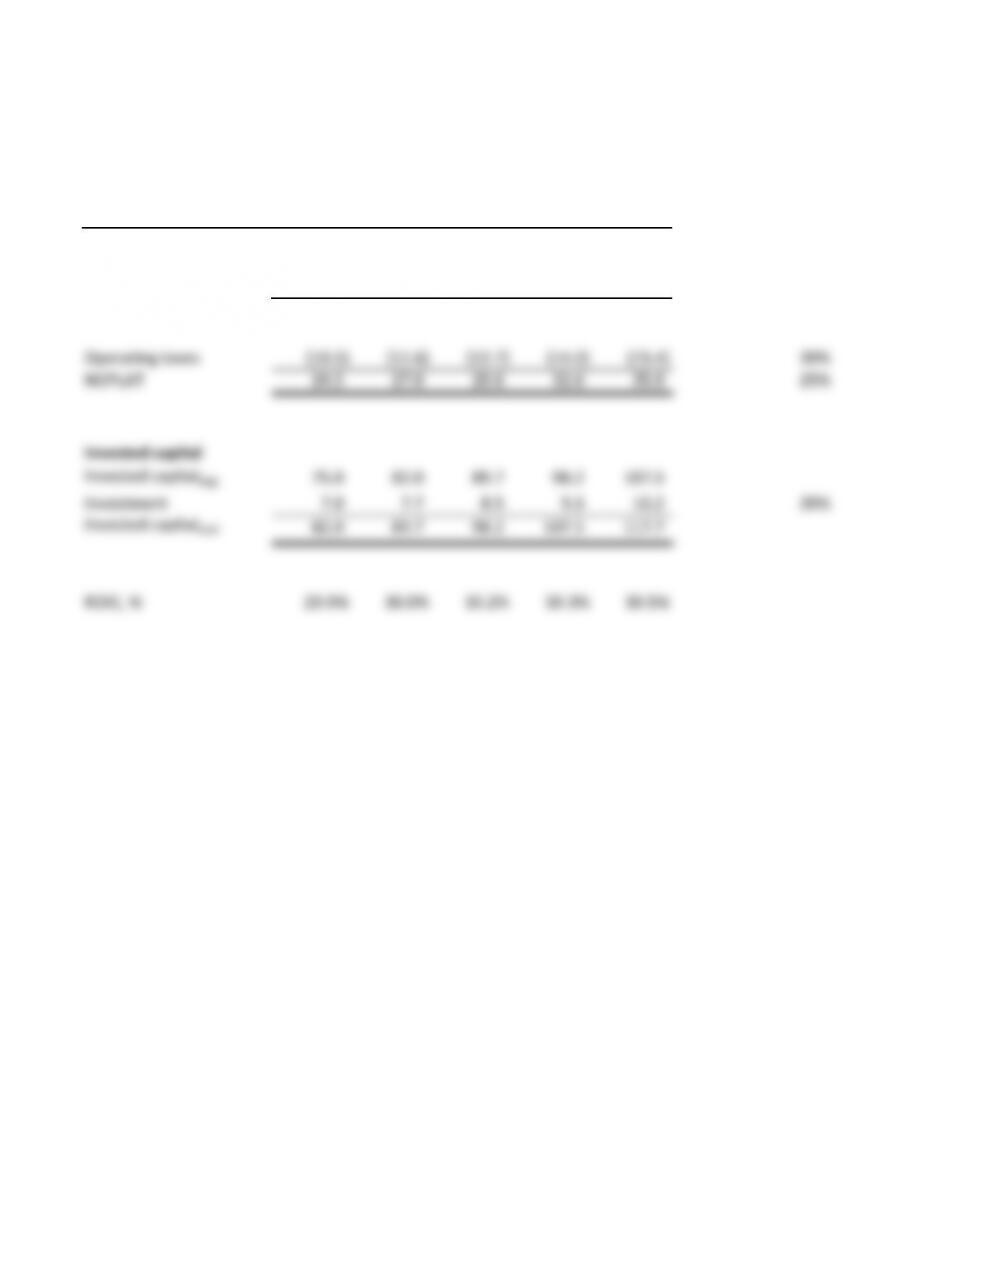
$ million Forecast
Year 1 Year 2 Year 3 Year 4 Year 5 ratio, %
Revenues 100.0 110.0 121.0 133.1 146.4 10%
Operating costs (50.0) (55.0) (60.5) (66.6) (73.2) 50%
R&D expense (15.0) (16.5) (18.2) (20.0) (22.0) 15%
Operating profit 35.0 38.5 42.4 46.6 51.2 35%
Operating taxes (10.5) (11.6) (12.7) (14.0) (15.4) 30%
NOPLAT 24.5 27.0 29.6 32.6 35.9 25%
Invested capital
Invested capitalbeg 75.0 82.0 89.7 98.2 107.5
Investment 7.0 7.7 8.5 9.3 10.2 20%
Invested capitalend 82.0 89.7 98.2 107.5 117.7
ROIC, % 29.9% 30.0% 30.2% 30.3% 30.5%
Chapter 21
Question 4
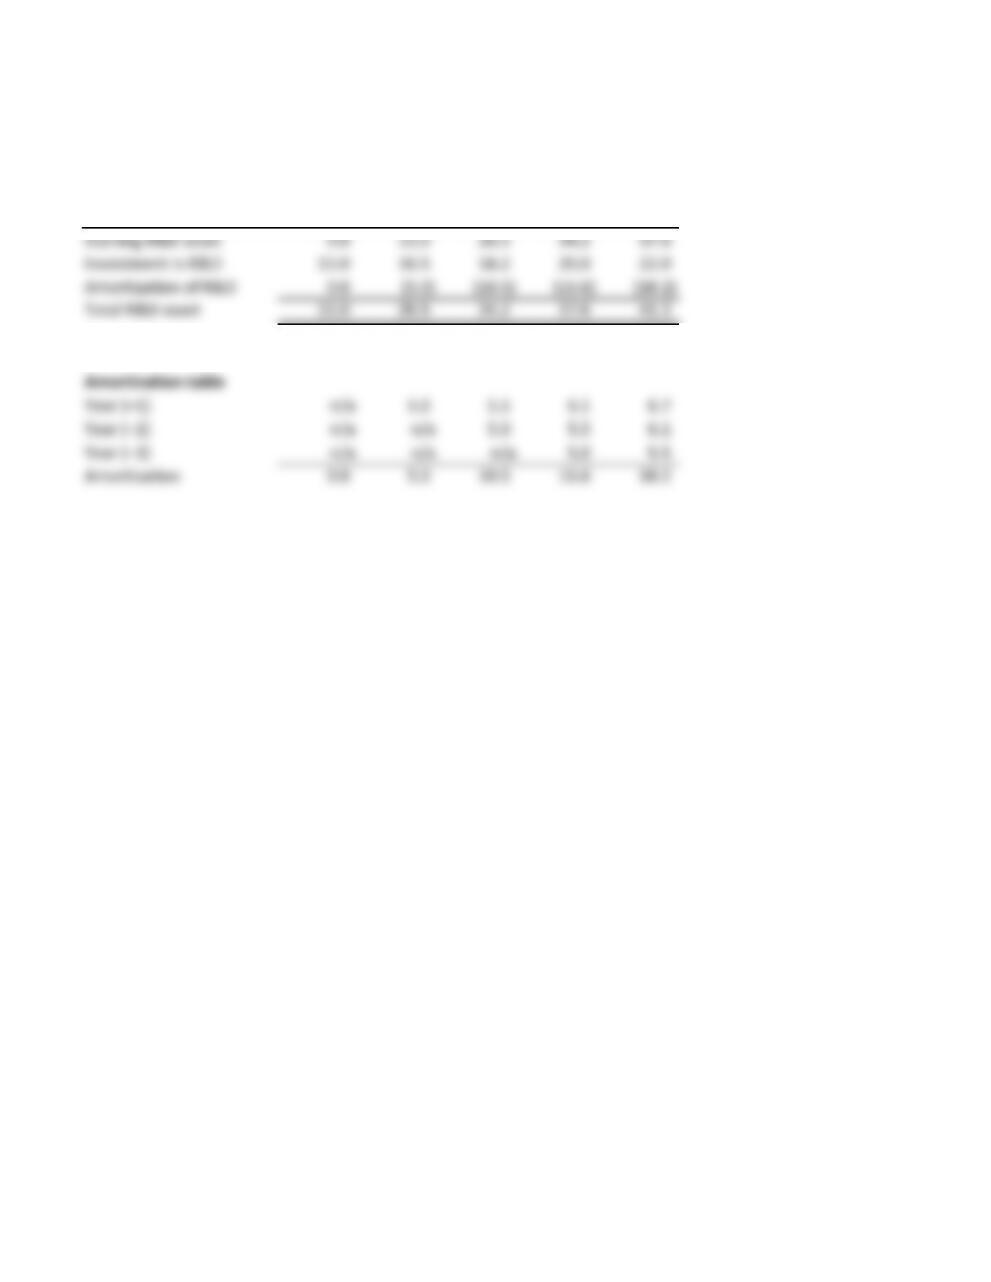
$ million
Year 1 Year 2 Year 3 Year 4 Year 5
Starting R&D asset 0.0 15.0 26.5 34.2 37.6
Investment in R&D 15.0 16.5 18.2 20.0 22.0
Amortization of R&D 0.0 (5.0) (10.5) (16.6) (18.2)
Total R&D asset 15.0 26.5 34.2 37.6 41.3
Amortization table
Year (–1) n/a 5.0 5.5 6.1 6.7
Year (–2) n/a n/a 5.0 5.5 6.1
Year (–3) n/a n/a n/a 5.0 5.5
Amortization 0.0 5.0 10.5 16.6 18.2
Chapter 21
Question 5
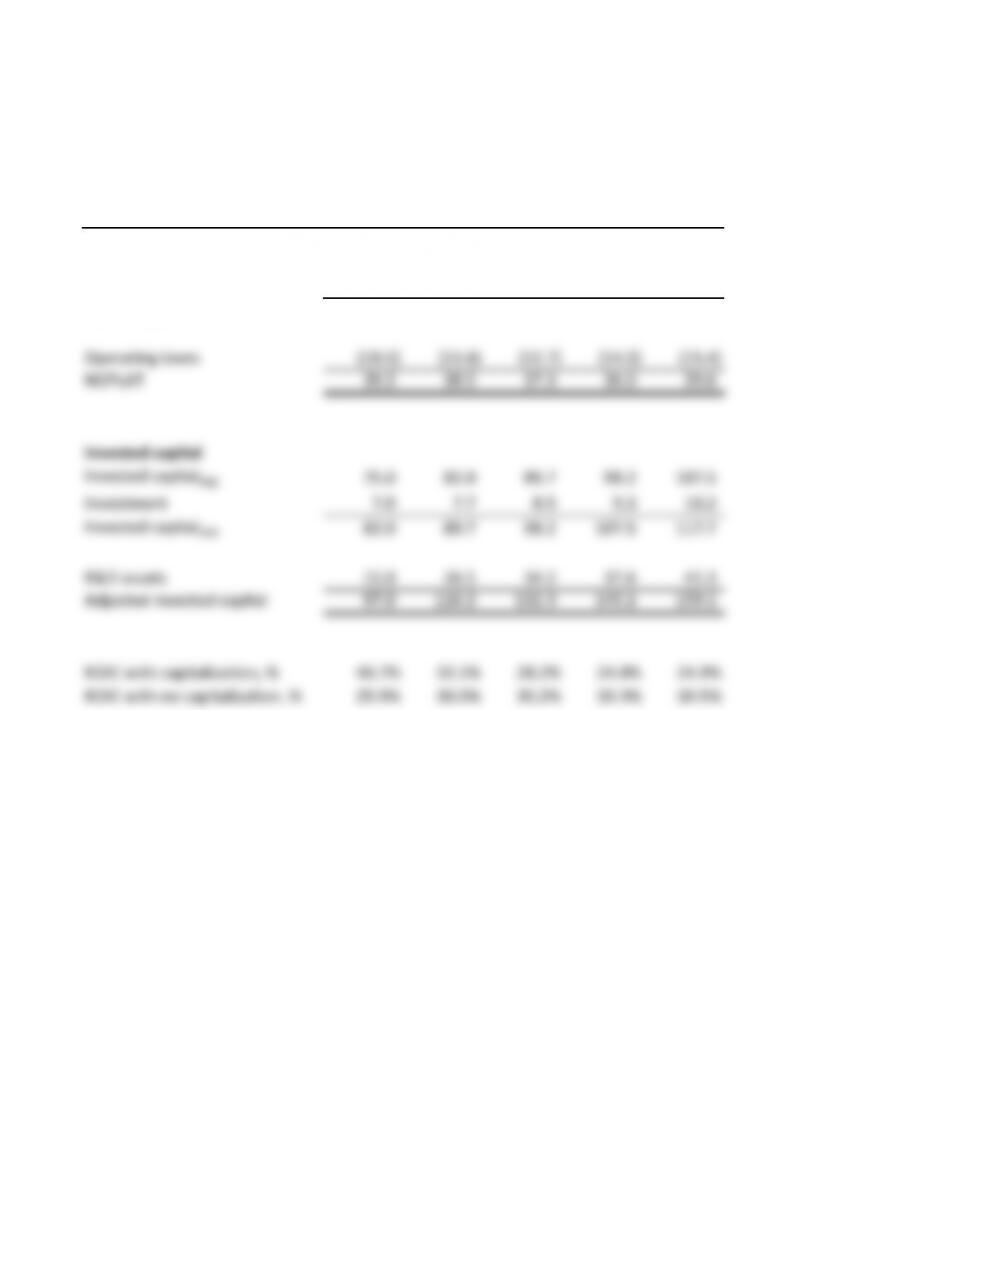
$ million
Year 1 Year 2 Year 3 Year 4 Year 5
Revenues 100.0 110.0 121.0 133.1 146.4
Operating costs (50.0) (55.0) (60.5) (66.6) (73.2)
R&D amortization 0.0 (5.0) (10.5) (16.6) (18.2)
Operating profit 50.0 50.0 50.0 50.0 55.0
Operating taxes (10.5) (11.6) (12.7) (14.0) (15.4)
NOPLAT 39.5 38.5 37.3 36.0 39.6
Invested capital
Invested capitalbeg 75.0 82.0 89.7 98.2 107.5
Investment 7.0 7.7 8.5 9.3 10.2
Invested capitalend 82.0 89.7 98.2 107.5 117.7
R&D assets 15.0 26.5 34.2 37.6 41.3
Adjusted invested capital 97.0 116.2 132.3 145.1 159.1
ROIC with capitalization, % 40.7% 33.1% 28.2% 24.8% 24.9%
ROIC with no capitalization, % 29.9% 30.0% 30.2% 30.3% 30.5%
Comment: Although ROIC with capitalization of R&D is higher initially, it falls below the
ROIC with no capitalization in subsequent years, due to the treatment of R&D as part of invested capital.
Chapter 21
Question 6
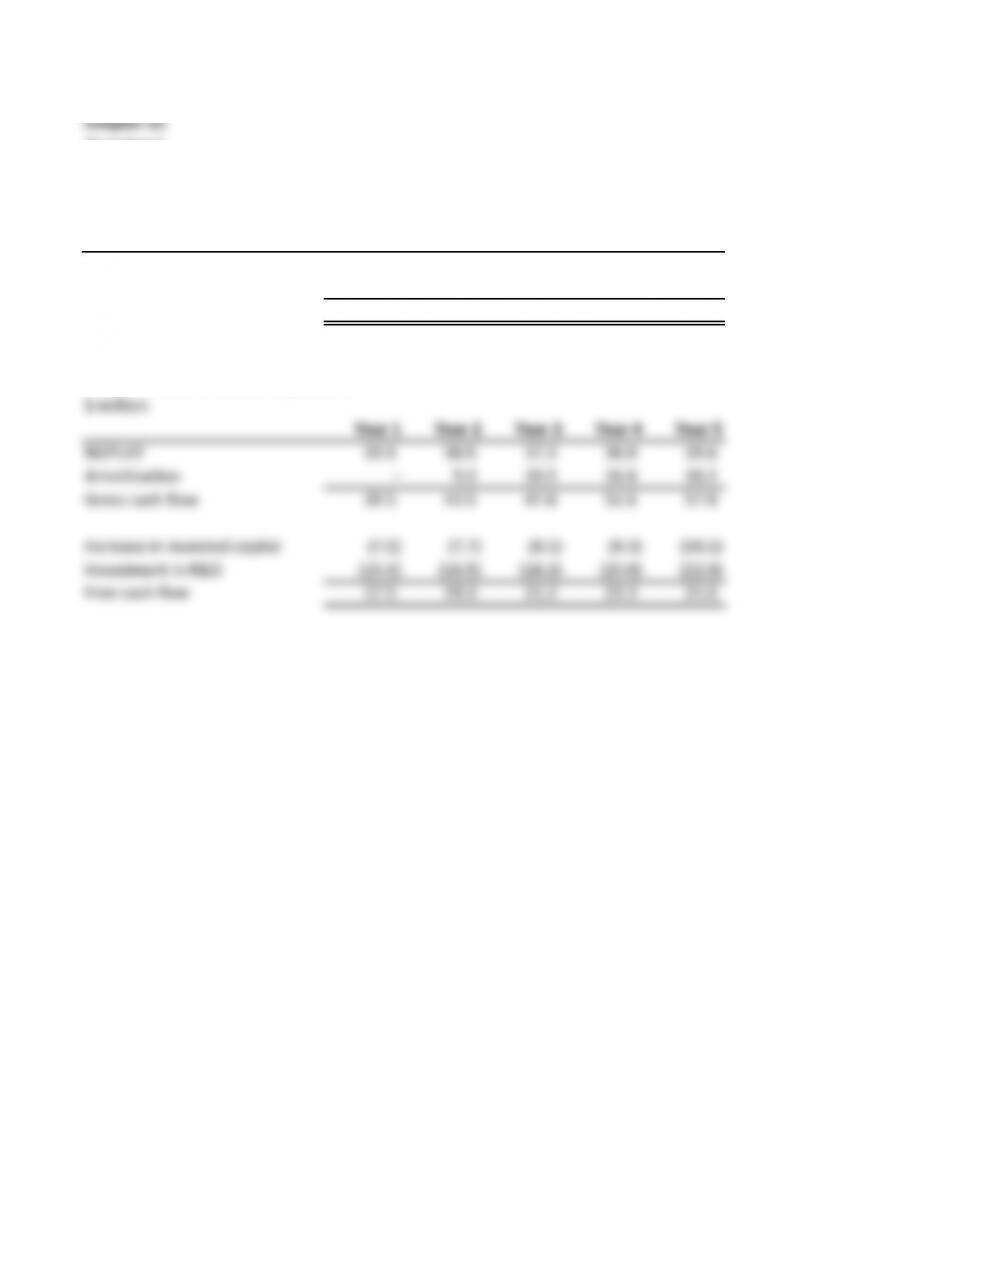
Free cash flow with R&D expensed
$ million
Year 1 Year 2 Year 3 Year 4 Year 5
NOPLAT 24.5 27.0 29.6 32.6 35.9
Increase in invested capital (7.0) (7.7) (8.5) (9.3) (10.2)
Free cash flow 17.5 19.3 21.2 23.3 25.6
Free cash flow with R&D capitalized
$ million
Year 1 Year 2 Year 3 Year 4 Year 5
NOPLAT 39.5 38.5 37.3 36.0 39.6
Amortization –5.0 10.5 16.6 18.2
Gross cash flow 39.5 43.5 47.8 52.6 57.8
Increase in invested capital (7.0) (7.7) (8.5) (9.3) (10.2)
Investment in R&D (15.0) (16.5) (18.2) (20.0) (22.0)
Free cash flow 17.5 19.3 21.2 23.3 25.6
Comment: As you can see, the free cash flows are not affected by the capitalization of R&D.


