Unlock document.
This document is partially blurred.
Unlock all pages and 1 million more documents.
Get Access
Chapter 12
Question 1
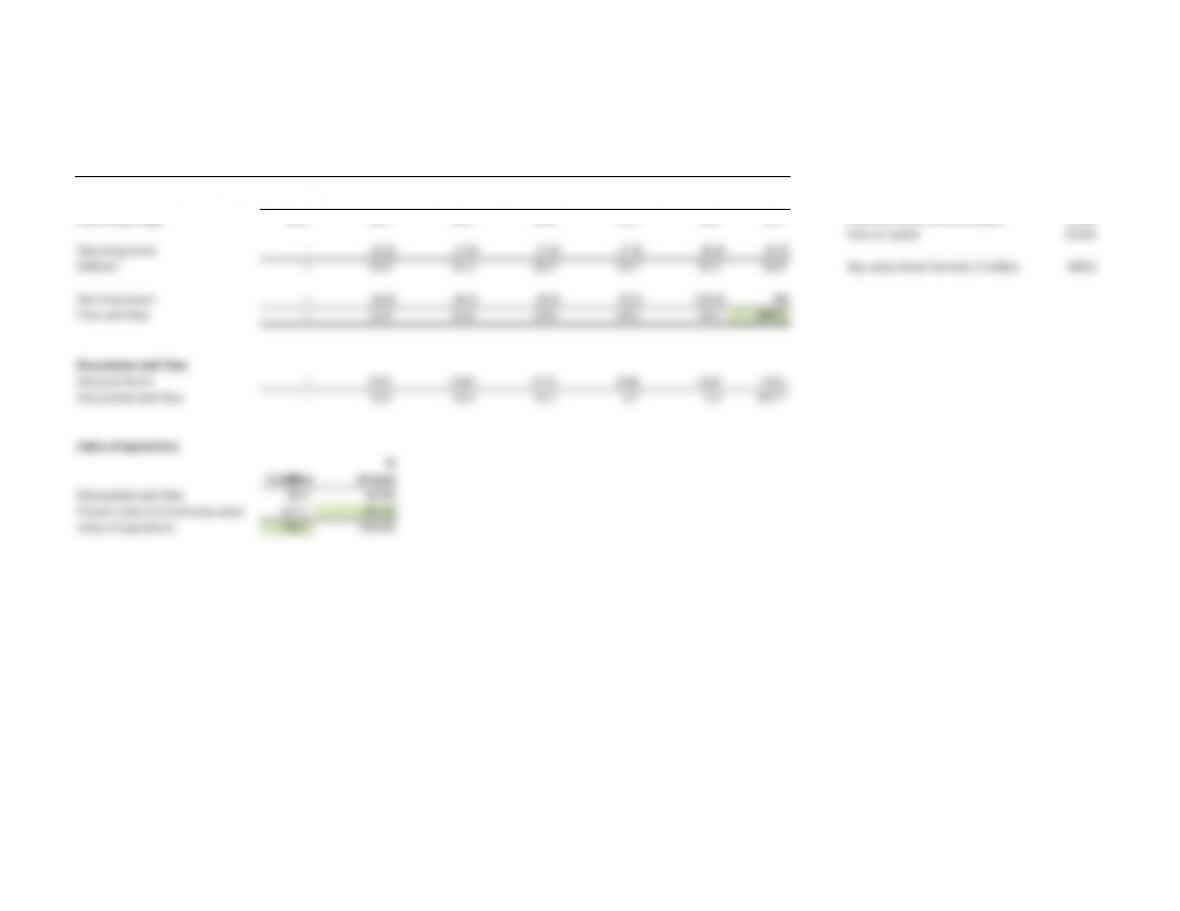
$ million Continuing
Today Year 1 Year 2 Year 3 Year 4 Year 5 value Continuing value
Revenues 250.0 265.0 280.9 297.8 315.6 334.6 354.6 NOPLAT, $ million 26.6
Operating costs (225.0) (238.5) (252.8) (268.0) (284.1) (301.1) (319.2) Growth 6.0%
Operating margin 25.0 26.5 28.1 29.8 31.6 33.5 35.5 Return on new invested capital 15.0%
Cost of capital 10.0%
Operating taxes – (6.6) (7.0) (7.4) (7.9) (8.4) (8.9)
NOPLAT – 19.9 21.1 22.3 23.7 25.1 26.6 Key value driver formula, $ million 399.0
Net investment – (8.0) (8.4) (8.9) (9.5) (10.0) CV
Free cash flow – 11.9 12.6 13.4 14.2 15.1 399.0
Discounted cash flow
Discount factor – 0.91 0.83 0.75 0.68 0.62 0.62
Discounted cash flow – 10.8 10.4 10.1 9.7 9.3 247.7
Value of operations
%
$ million of total
Discounted cash flow 50.4 16.9%
Present value of continuing value 247.7 83.1%
Value of operations 298.1 100.0%
Chapter 12
Question 2
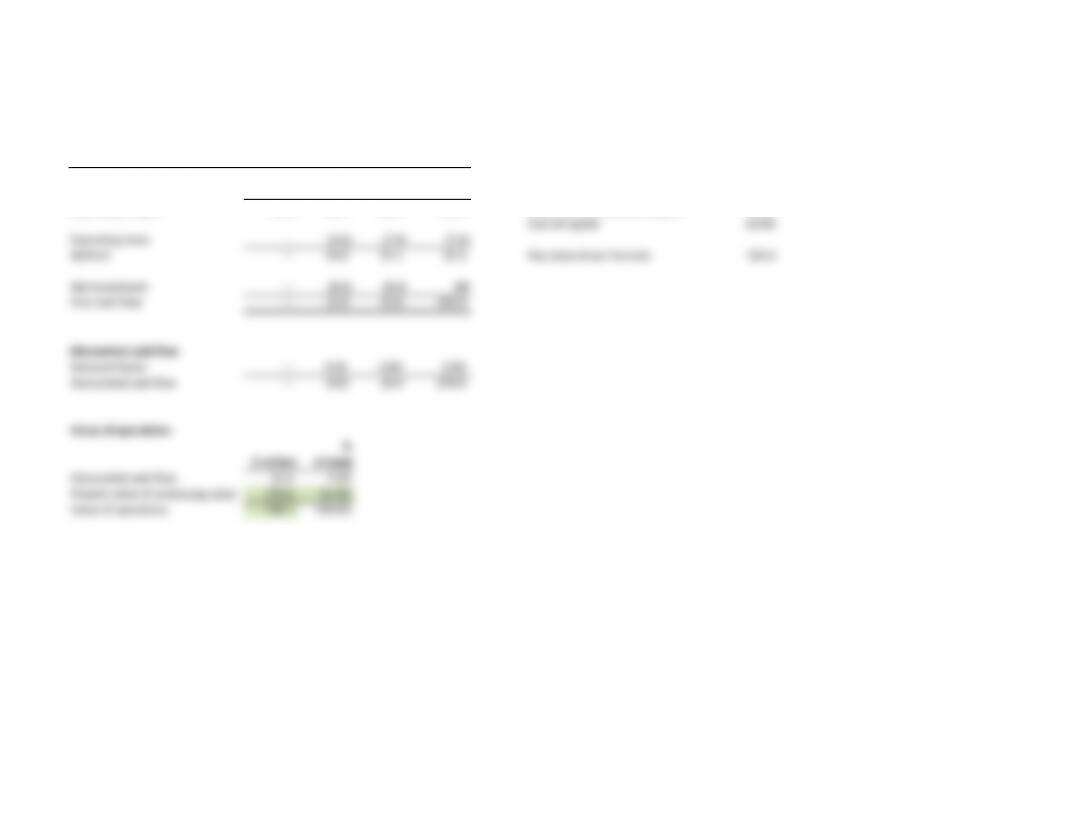
$ million Continuing
Today Year 1 Year 2 value Continuing value, $ million
Revenues 250.0 265.0 280.9 297.8 NOPLAT 22.3
Operating costs (225.0) (238.5) (252.8) (268.0) Growth 6.0%
Operating margin 25.0 26.5 28.1 29.8 Return on new invested capital 15.0%
Cost of capital 10.0%
Operating taxes – (6.6) (7.0) (7.4)
NOPLAT – 19.9 21.1 22.3 Key value driver formula 335.0
Net investment – (8.0) (8.4) CV
Free cash flow – 11.9 12.6 335.0
Discounted cash flow
Discount factor – 0.91 0.83 0.83
Discounted cash flow – 10.8 10.4 276.8
Value of operations
%
$ million of total
Discounted cash flow 21.3 7.1%
Present value of continuing value 276.8 92.9%
Value of operations 298.1 100.0%
The continuing value here represents about 93 percent of the overall operating value of ApparelCo, while it represented only 83 percent of overall operating value in Question 1.
This is due to the earlier calculation of continuing value (in year 2 versus in year 5 in Question 1).
Chapter 12
Question 3
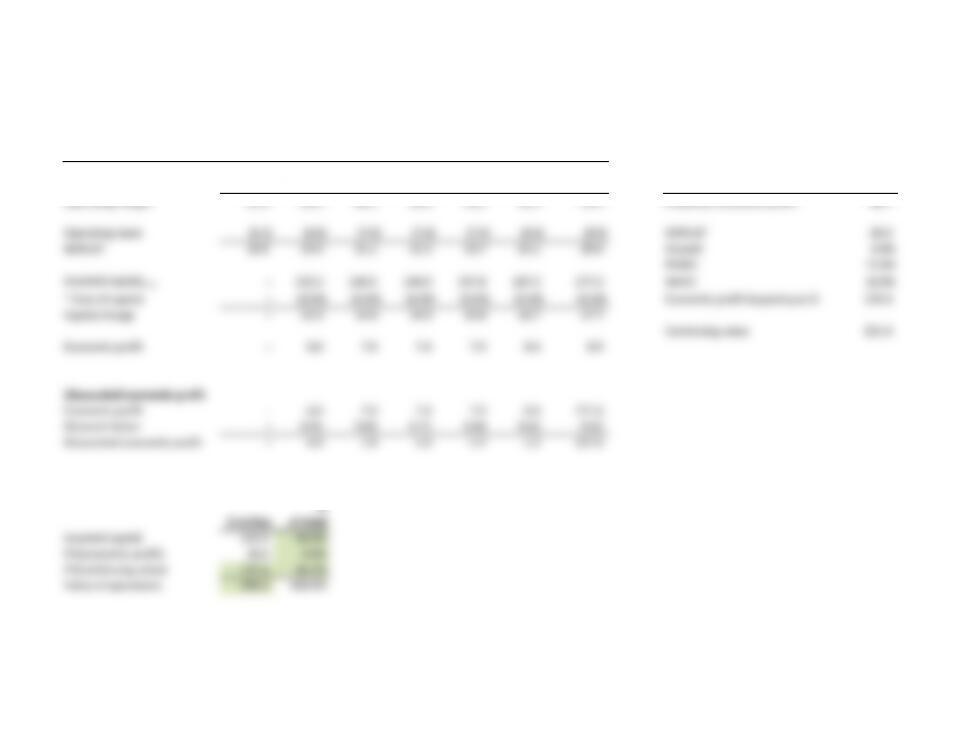
$ million Continuing
Today Year 1 Year 2 Year 3 Year 4 Year 5 value Continuing value
Revenues 250.0 265.0 280.9 297.8 315.6 334.6 354.6 Economic profit 8.9
Operating costs (225.0) (238.5) (252.8) (268.0) (284.1) (301.1) (319.2) ÷ Cost of capital 10.0%
Operating margin 25.0 26.5 28.1 29.8 31.6 33.5 35.5 Perpetual economic profit 88.7
Operating taxes (6.3) (6.6) (7.0) (7.4) (7.9) (8.4) (8.9) NOPLAT 26.6
NOPLAT 18.8 19.9 21.1 22.3 23.7 25.1 26.6 Growth 6.0%
RONIC 15.0%
Invested capitalt–1 –132.5 140.5 148.9 157.8 167.3 177.3 WACC 10.0%
* Cost of capital –10.0% 10.0% 10.0% 10.0% 10.0% 10.0% Economic profit beyond year 6 133.0
Capital charge –13.3 14.0 14.9 15.8 16.7 17.7
Continuing value 221.6
Economic profit –6.6 7.0 7.4 7.9 8.4 8.9
Discounted economic profit
Economic profit –6.6 7.0 7.4 7.9 8.4 221.6
Discount factor –0.91 0.83 0.75 0.68 0.62 0.62
Discounted economic profit –6.0 5.8 5.6 5.4 5.2 137.6
Value of operations
%
$ million of total
Invested capital 132.5 44.4%
PV(economic profit) 28.0 9.4%
PV(continuing value) 137.6 46.2%
Value of operations 298.1 100.0%
Chapter 12
Question 4
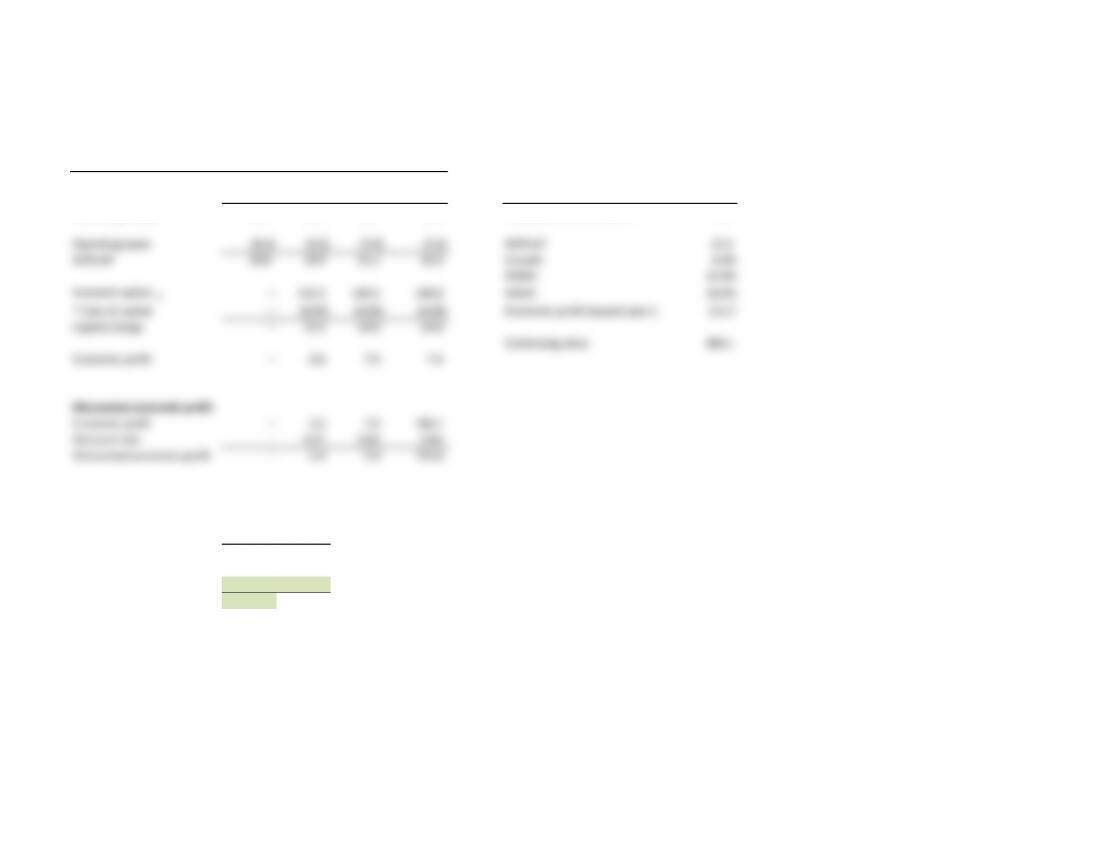
$ million Continuing
Today Year 1 Year 2 value Continuing value
Revenues 250.0 265.0 280.9 297.8 Economic profit 7.4
Operating costs (225.0) (238.5) (252.8) (268.0) ÷ Cost of capital 10.0%
Operating margin 25.0 26.5 28.1 29.8 Perpetual economic profit 74.4
Operating taxes (6.3) (6.6) (7.0) (7.4) NOPLAT 22.3
NOPLAT 18.8 19.9 21.1 22.3 Growth 6.0%
RONIC 15.0%
Invested capitalt–1 –132.5 140.5 148.9 WACC 10.0%
* Cost of capital –10.0% 10.0% 10.0% Economic profit beyond year 1 111.7
Capital charge –13.3 14.0 14.9
Continuing value 186.1
Economic profit –6.6 7.0 7.4
Discounted economic profit
Economic profit –6.6 7.0 186.1
Discount rate –0.91 0.83 0.83
Discounted economic profit –6.0 5.8 153.8
Value of operations
%
$ million of total
Invested capital 132.5 44.4%
PV(economic profit) 11.8 4.0%
PV(continuing value) 153.8 51.6%
Value of operations 298.1 100.0%
Note that the continuing value here represents about 52 percent of the overall operating value of ApparelCo, while it represented 93 percent of overall operating value in Question 2.
This is due to the fact that a large amount of the value of operations using the economic profit approach is included in the base level of invested capital.
Chapter 12
Question 5 & 6
Question 5
In this example, because the suggested growth exceeds the cost of capital, cash flows grow
faster than they can be discounted, and consequently value is infinite. From an economic perspective, growth
must eventually fall as the company grows larger (a $250 billion company cannot continually grow faster than
10 percent). Therefore, perpetuity formulas cannot be used when growth exceeds the cost of capital.
To avoid this problem, extend the forecast period until growth stabilizes at a real growth rate no higher than 5 percent.
Question 6
As Exhibit 12.6 demonstrates, return on total capital does not necessarily equal return on new invested capital. Return
on total capital is a blend between return on existing capital (i.e., capital that existed at the start of the continuing-
value period) and return on new invested capital. As the company adds new capital, return on total capital will
trend toward return on new invested capital. Therefore, SuperiorCo will have a return on total capital above
the cost of capital, even during the continuing-value period.
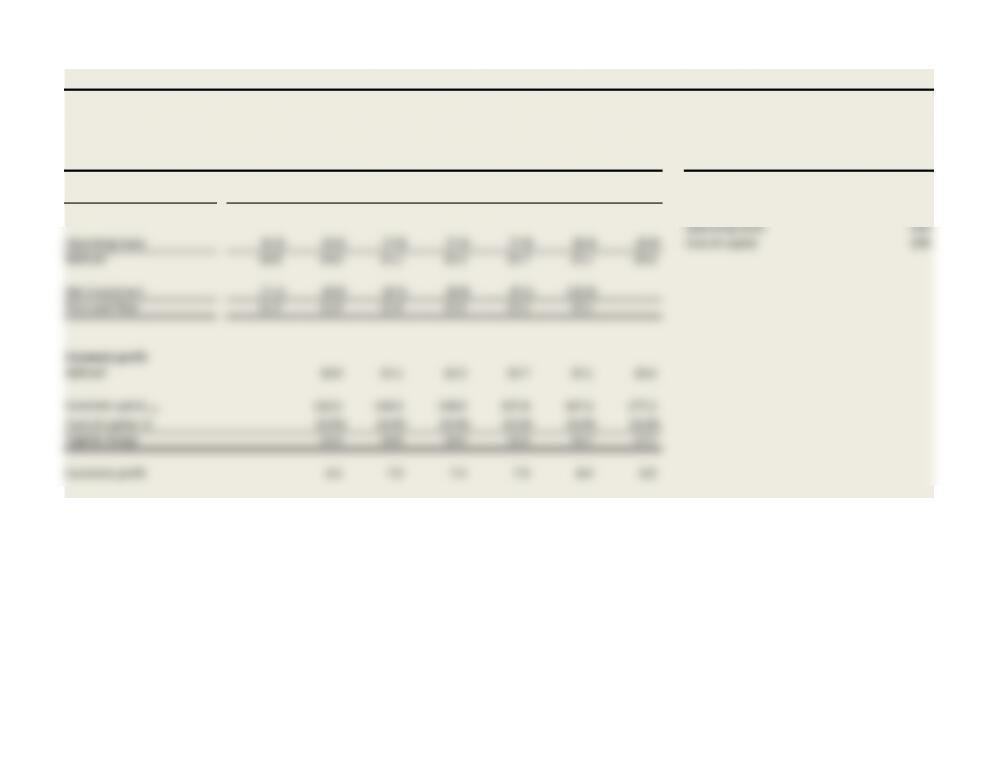
Exhibit 12.13 ApparelCo: Free Cash Flows and Economic Profit
$ million
Continuing
Today Year 1 Year 2 Year 3 Year 4 Year 5 value Key value drivers, %
Revenues 250.0 265.0 280.9 297.8 315.6 334.6 354.6
Operating costs (225.0) (238.5) (252.8) (268.0) (284.1) (301.1) (319.2) Return on new invested capital 15%
Operating margin 25.0 26.5 28.1 29.8 31.6 33.5 35.5 Growth rate 6%
Operating taxes 25%
Operating taxes (6.3) (6.6) (7.0) (7.4) (7.9) (8.4) (8.9) Cost of capital 10%
NOPLAT 18.8 19.9 21.1 22.3 23.7 25.1 26.6
Net investment (7.5) (8.0) (8.4) (8.9) (9.5) (10.0)
Free cash flow 11.3 11.9 12.6 13.4 14.2 15.1
Economic profit
NOPLAT 19.9 21.1 22.3 23.7 25.1 26.6
Invested capitalt–1 132.5 140.5 148.9 157.8 167.3 177.3
Cost of capital, % 10.0% 10.0% 10.0% 10.0% 10.0% 10.0%
Capital charge 13.3 14.0 14.9 15.8 16.7 17.7
Economic profit 6.6 7.0 7.4 7.9 8.4 8.9


