Unlock document.
This document is partially blurred.
Unlock all pages and 1 million more documents.
Get Access
Problem 22-2B (Continued)
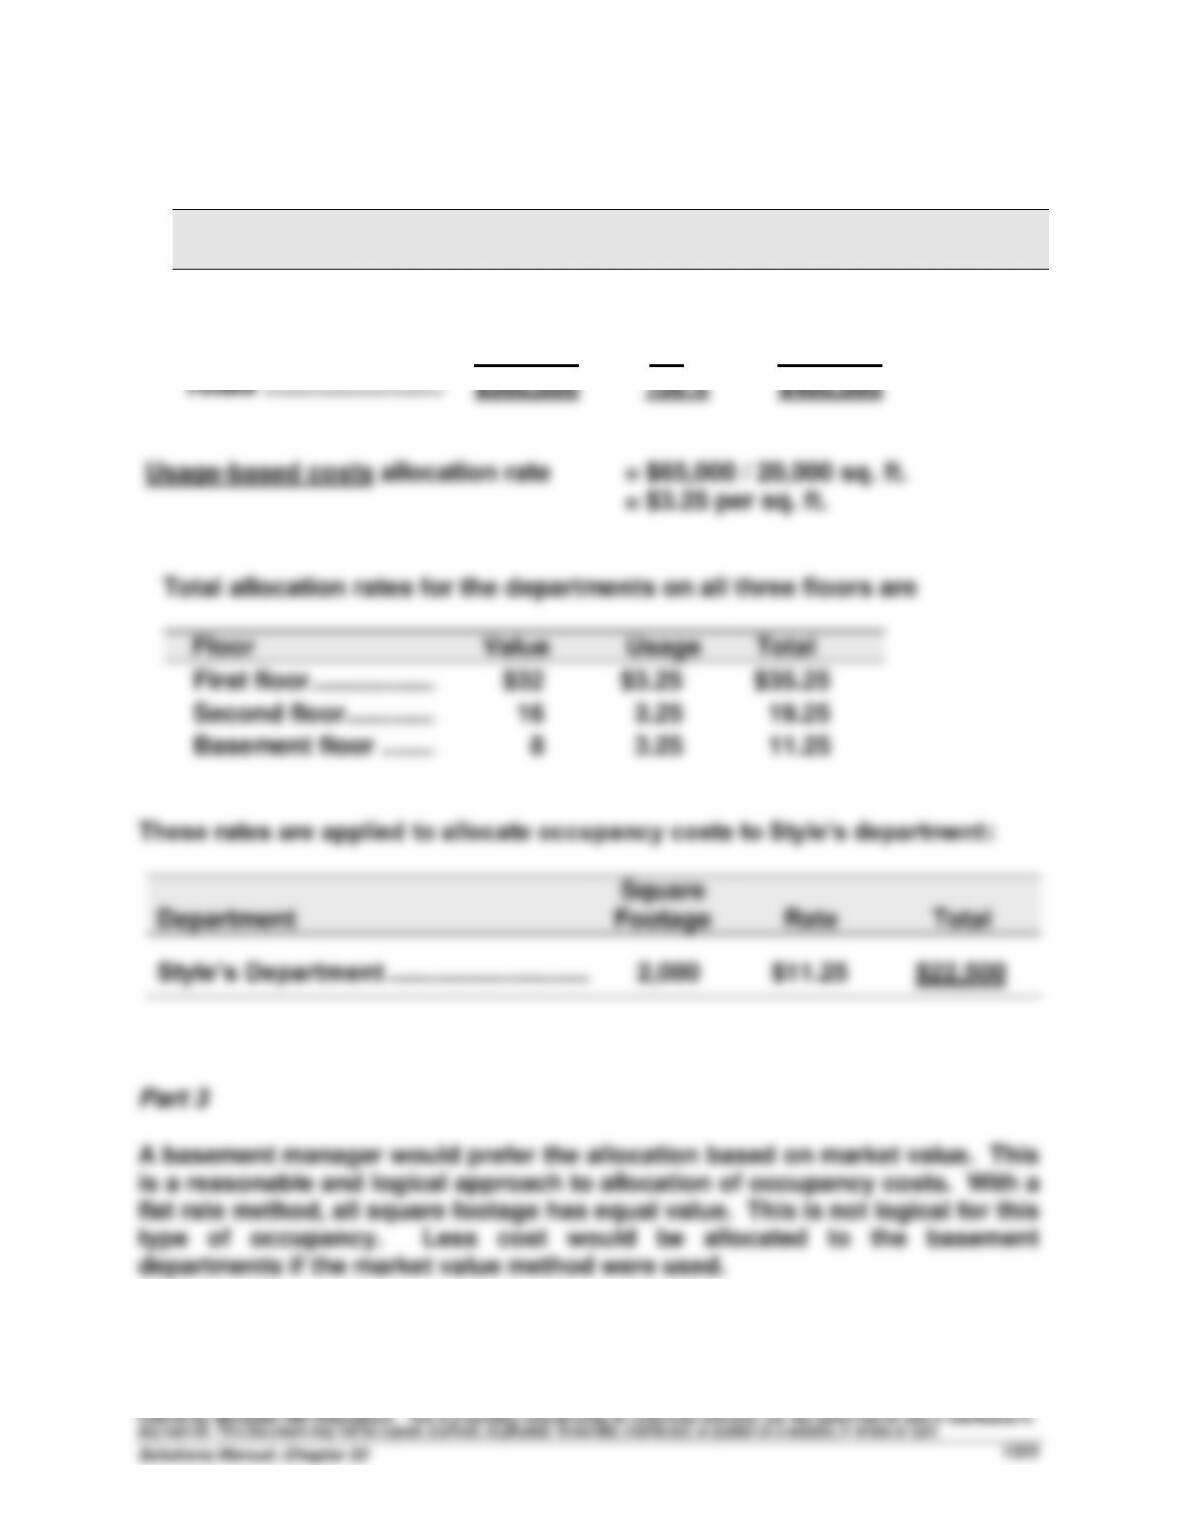
(ii) Allocate the $400,000 to each floor based on its percent of market value
Floor
Market
Value
% of
Total
Allocated
Cost
Cost per
Sq. Ft.
First floor ................................
$300,000
60%
$240,000
$32.00
Second floor ...........................
150,000
30
120,000
16.00
Basement floor .......................
50,000
10
40,000
8.00
Totals ................................
$500,000
100%
$400,000
Usage-based costs allocation rate = $65,000 / 20,000 sq. ft.
= $3.25 per sq. ft.
Total allocation rates for the departments on all three floors are
Floor
Value
Usage
Total
First floor ..............................
$32
$3.25
$35.25
Second floor .........................
16
3.25
19.25
Basement floor ....................
8
3.25
11.25
These rates are applied to allocate occupancy costs to Style’s department:
Department
Square
Footage
Rate
Total
Style’s Department ................................
2,000
$11.25
$22,500
Part 3
A basement manager would prefer the allocation based on market value. This
is a reasonable and logical approach to allocation of occupancy costs. With a
flat rate method, all square footage has equal value. This is not logical for this
type of occupancy. Less cost would be allocated to the basement
departments if the market value method were used.
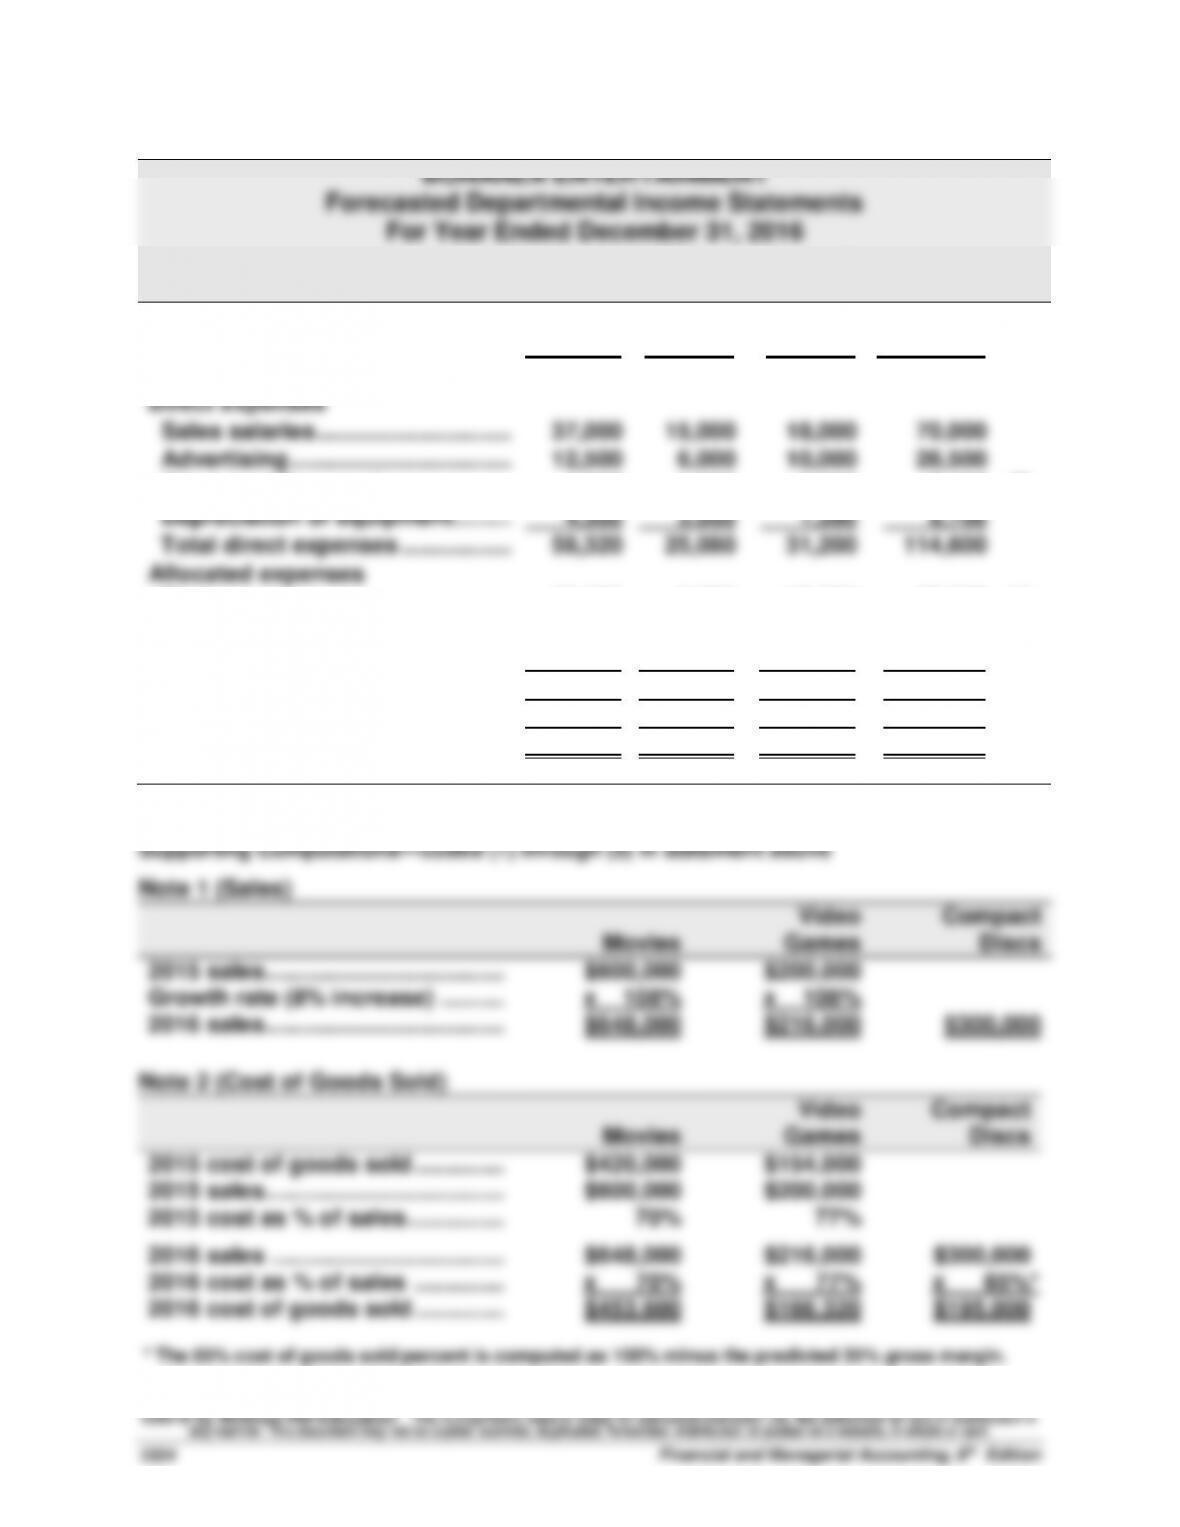
Problem 22-3B (70 minutes)
BONANZA ENTERTAINMENT
Forecasted Departmental Income Statements
For Year Ended December 31, 2016
Movies
Video
Games
Compact
Discs
Combined
Sales ...............................................
$648,000
$216,000
$300,000
$1,164,000
(1)
Cost of goods sold ........................
453,600
166,320
195,000
814,920
(2)
Gross profit ....................................
194,400
49,680
105,000
349,080
Direct expenses
Sales salaries ...............................
37,000
15,000
18,000
70,000
Advertising ...................................
12,500
6,000
10,000
28,500
Store supplies used .....................
4,320
1,080
2,000
7,400
(3)
Depreciation of equipment..........
4,500
3,000
1,200
8,700
Total direct expenses ..................
58,320
25,080
31,200
114,600
Allocated expenses
Rent expense ...............................
30,750
6,000
13,250
50,000
(4)
Utilities expense ..........................
5,535
1,080
2,385
9,000
(4)
Share of office dept. expenses ...
47,345
15,725
21,930
85,000
(5)
Total allocated expenses ............
83,630
22,805
37,565
144,000
Total expenses ...............................
141,950
47,885
68,765
258,600
Net income .....................................
$ 52,450
$ 1,795
$ 36,235
$ 90,480
Problem 22-3B (Continued)
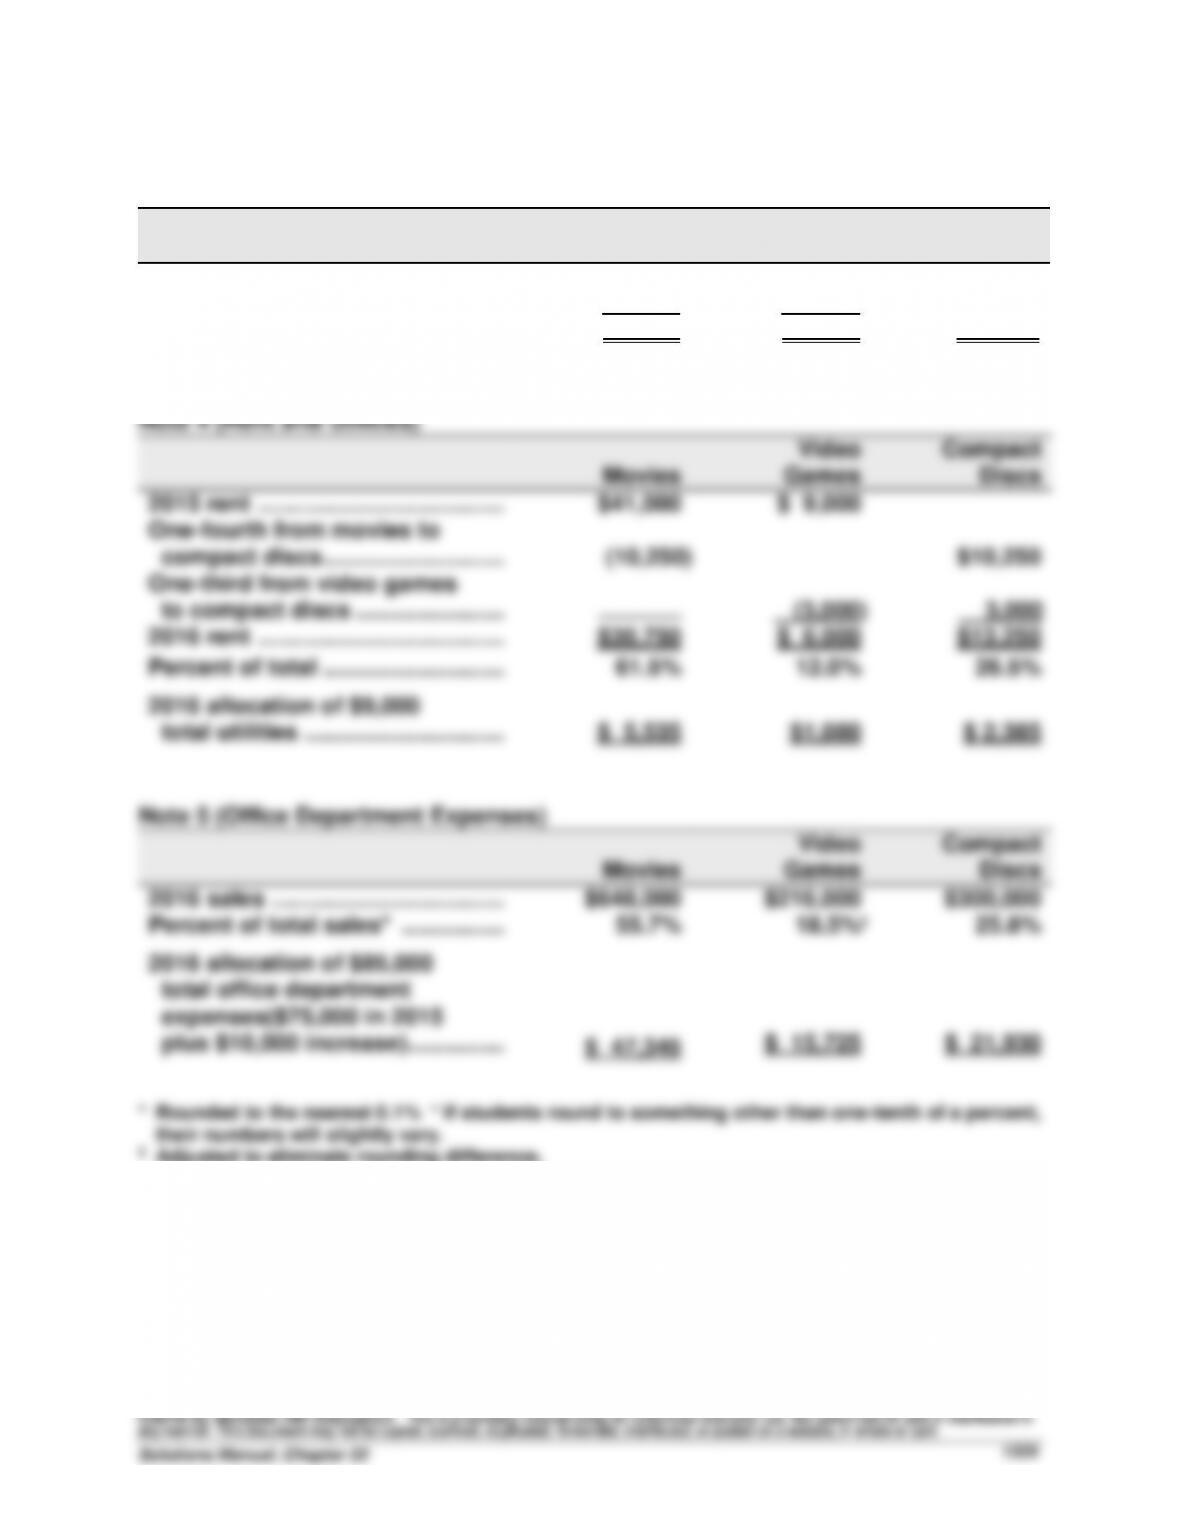
Note 3 (Store Supplies Used)
Movies
Video
Games
Compact
Discs
2015 store supplies used ...........
$ 4,000
$ 1,000
Growth rate (8% increase) ..........
x 108%
x 108%
2016 store supplies ....................
$ 4,320
$ 1,080
$ 2,000
Problem 22-4B (45 minutes)
Part 1
SADAR COMPANY
Departmental Contribution Statements
Videos
Music
Sales ........................................
$370,500
$279,500
Cost of goods sold ................
320,000
175,000
Gross profit ............................
50,500
104,500
Direct expenses
Salaries ...................................
35,000
25,000
Maintenance ...........................
Utilities ....................................
Insurance ................................
12,000
5,000
4,200
10,000
4,500
3,700
Total direct expenses ............
56,200
43,200
Departmental contributions to
overhead ...............................
Allocated indirect expenses
(5,700)
61,300
Advertising* ............................
8,550
6,450
Salaries** ................................
16,200
10,800
Office**** .................................
Total indirect expenses .........
2,000
26,750
1,200
18,450
Operating income ..................
$ (32,450)
$ 42,850
*
Advertising allocation:
Sales
%
Amount
Allocated
Videos
$370,500
57%
$15,000
$ 8,550
Music
279,500
43%
15,000
6,450
Total
$650,000
100%
$15,000
**
Salaries allocation:
Employees
%
Amount
Allocated
Videos
3
60%
$27,000
$16,200
Music
2
40%
27,000
10,800
Total
5
100%
$27,000
***
Office expenses allocation:
Sq. ft.
%
Amount
Allocated
Videos
5,000
62.5%
$3,200
$2,000
Music
3,000
37.5%
3,200
1,200
Total
8,000
100.0%
$3,200
Problem 22-4B (Concluded)
Part 2
The videos department has both a negative contribution to overhead and a
negative departmental net income. It is not even covering its own direct
Problem 22-5BB (60 minutes)
Part 1
Allocations of joint cost on the basis of sales values
Land preparation, seeding, and cultivating: $700,000
Grade
Sales
Value
Percent of
Total
Allocated
Cost
No. 1 ...............................
$ 900,000
62.5%
$437,500
No. 2 ...............................
500,000
34.7
242,900
No. 3 ...............................
40,000
2.8
19,600
Total ...............................
$1,440,000
100.0%
$700,000
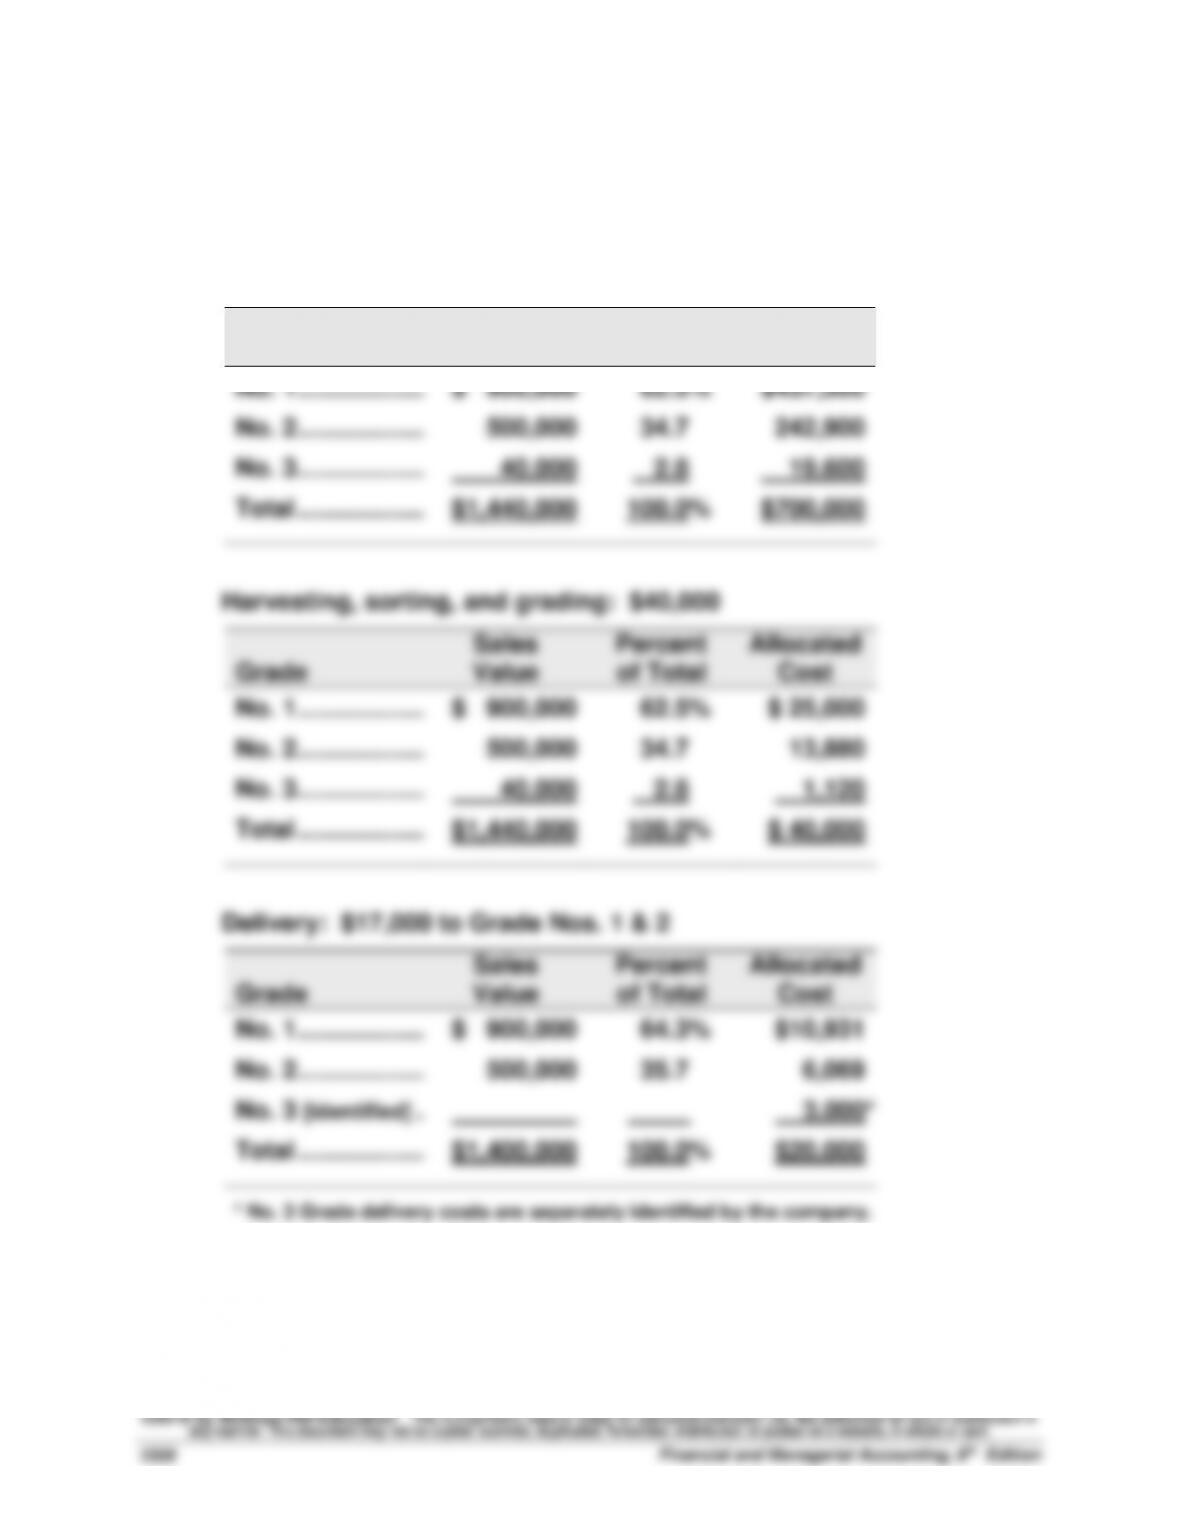
Harvesting, sorting, and grading: $40,000
Grade
Sales
Value
Percent
of Total
Allocated
Cost
No. 1 ...............................
$ 900,000
62.5%
$ 25,000
No. 2 ...............................
500,000
34.7
13,880
No. 3 ...............................
40,000
2.8
1,120
Total ...............................
$1,440,000
100.0%
$ 40,000
Delivery: $17,000 to Grade Nos. 1 & 2
Grade
Sales
Value
Percent
of Total
Allocated
Cost
No. 1 ...............................
$ 900,000
64.3%
$10,931
No. 2 ...............................
500,000
35.7
6,069
No. 3 [identified] ..............
3,000*
Total ...............................
$1,400,000
100.0%
$20,000
* No. 3 Grade delivery costs are separately identified by the company.
Problem 22-5B (Continued)
Part 2
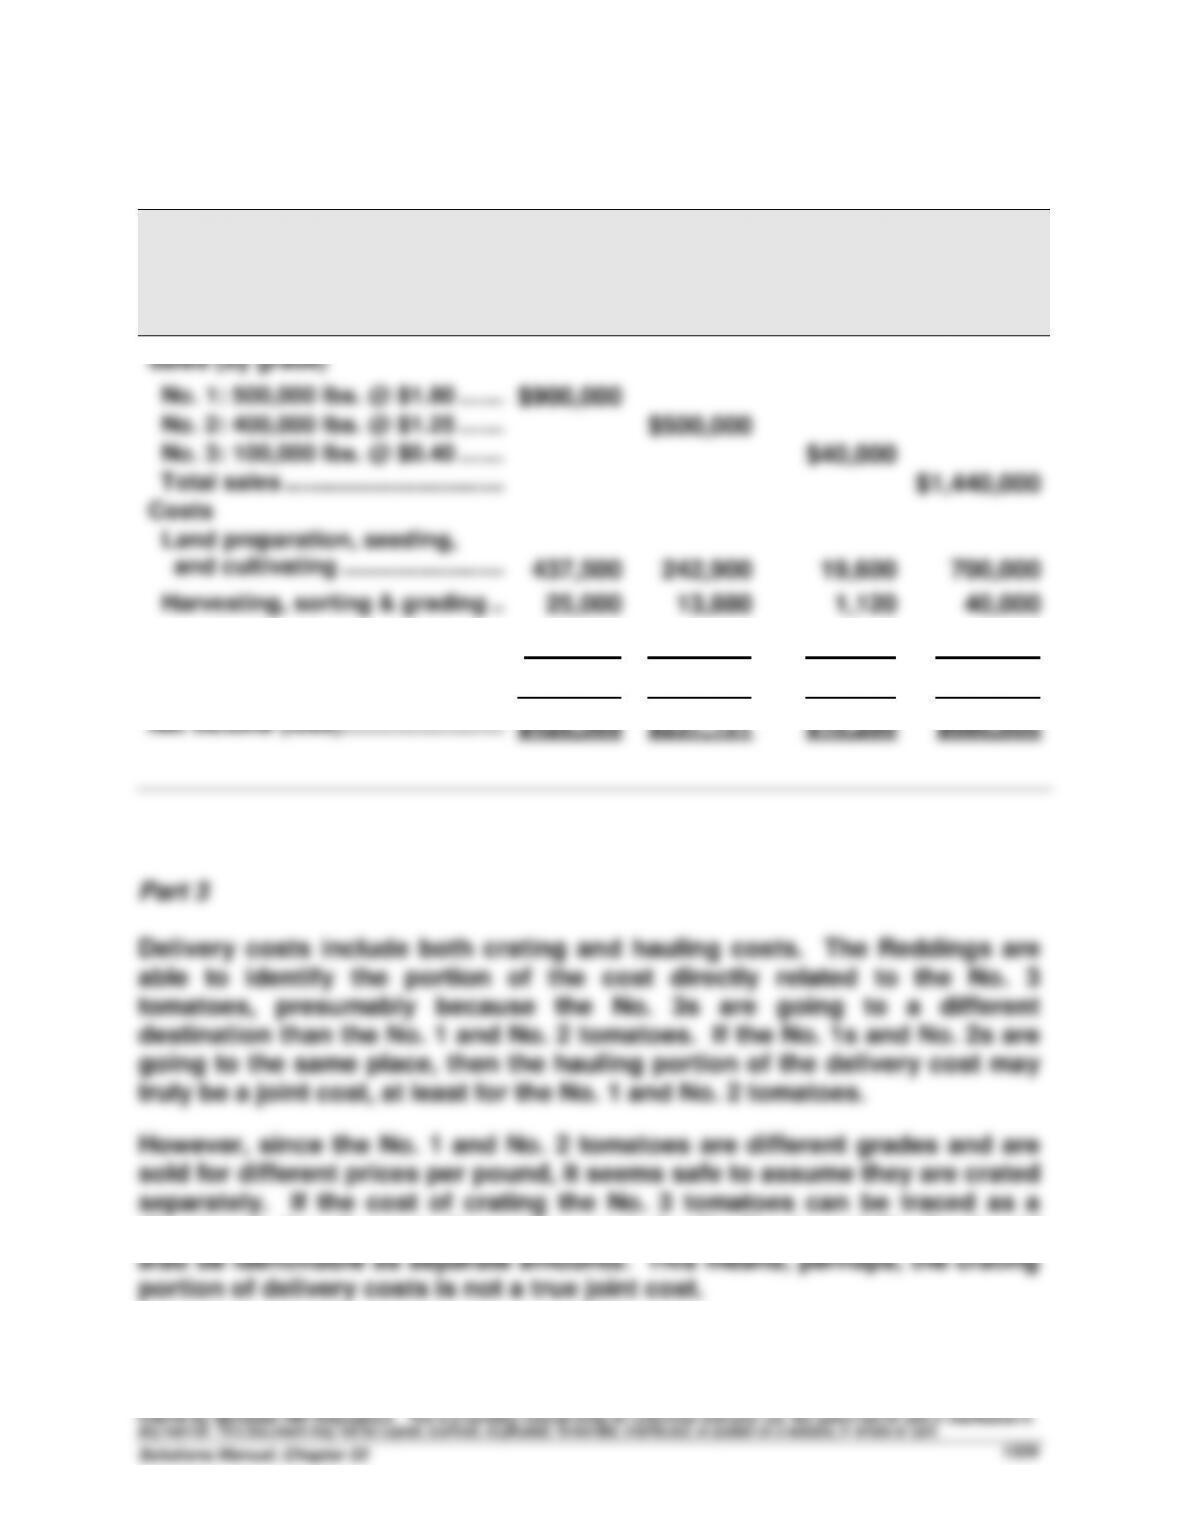
RITA AND RICK REDDING
Income Statement
For Year Ended December 31, 2015
No. 1
No. 2
No. 3
Combined
Sales (by grade)
No. 1: 500,000 lbs. @ $1.80 ..........
$900,000
No. 2: 400,000 lbs. @ $1.25 ..........
$500,000
No. 3: 100,000 lbs. @ $0.40 ..........
$40,000
Total sales .....................................
$1,440,000
Costs
Land preparation, seeding,
and cultivating ............................
437,500
242,900
19,600
700,000
Harvesting, sorting & grading .....
25,000
13,880
1,120
40,000
Delivery ..........................................
10,931
6,069
3,000
20,000
Total costs .....................................
473,431
262,849
23,720
760,000
Net income (loss) ............................
$426,569
$237,151
$16,280
$680,000
Part 3
Delivery costs include both crating and hauling costs. The Reddings are
able to identify the portion of the cost directly related to the No. 3
tomatoes, presumably because the No. 3s are going to a different
destination than the No. 1 and No. 2 tomatoes. If the No. 1s and No. 2s are
going to the same place, then the hauling portion of the delivery cost may
truly be a joint cost, at least for the No. 1 and No. 2 tomatoes.
However, since the No. 1 and No. 2 tomatoes are different grades and are
sold for different prices per pound, it seems safe to assume they are crated
separately. If the cost of crating the No. 3 tomatoes can be traced as a
direct cost, then it seems the crating costs for the No. 1s and No. 2s should
1. The balanced scorecard is a system of performance measures that
requires managers to think of their company from four perspectives:
Customer, internal process, innovation and learning, and financial.
2. Below are some examples of balanced scorecard measures that
Santana could use. Other examples are possible:
Customer: Percentage of computer workstations returned, number of
on-time workstation deliveries, number of on-time


