Unlock document.
This document is partially blurred.
Unlock all pages and 1 million more documents.
Get Access
Chapter 14 - Financial Statement Analysis
CHAPTER FOURTEEN
FINANCIAL STATEMENT ANALYSIS
CHAPTER OVERVIEW
This chapter discusses the income statement, balance sheet and the statement of cash flows. The
text stresses the differences between accounting and economic income and provides good detail
on return on equity (ROE), the decomposition of the ROE into component ratios for the purpose
of financial analysis, and other ratios relevant for financial analysis. Financial statement
comparability problems are also presented.
LEARNING OBJECTIVES
After studying this chapter, the student should be able to analyze a firm using the basic financial
statements to perform ratio analysis. The student should be able to identify the source of
problems over time by decomposing the return on equity using the Du Pont procedure. Several
examples are provided in the text. The effects of leverage on returns is also discussed and the
CHAPTER OUTLINE
1. The Major Financial Statements
PPT 14-2 through PPT 14-5
Financial statement analysis uses the firm’s accounting data. The financial statements are the
starting point of a financial analysis. The income statement contains flows that occur during the
current period that relate to profitability primarily. The balance sheet gives an analyst a snapshot
for the firm’s financial position and a broad overview of the level of investments in major asset
categories. Analysts typically work with common size statements to remove size distortions.
Indexed or trend statements are used to analyze changes over time.
Chapter 14 - Financial Statement Analysis
Net Operating Sources of Funds
= Working capital operating sources of funds – working capital operating uses of funds
1
Cash Flow from Investing would include net investments in fixed assets and Cash Flow from
Financing will contain changes in debt and equity accounts and dividends. Note that interest
expense is not included in Cash Flow from Financing and is also not added back to Operating
Cash Flow.
2. Measuring Firm Performance
PPT 14-6 through PPT 14-7
Two broad activities are the responsibility of a firm’s financial managers: investment decisions
and financing decisions. Investment, or capital budgeting, decisions pertain to the firm’s use of
capital, while financial decisions pertain to the firm’s sources of capital. Aspects of both
of each of these two concepts can be measured with an array of statistics.
3. Profitability Measures
PPT 14-8 through PPT 14-12
Return on equity and return on assets are total earnings expressed on a per-dollar invested basis.
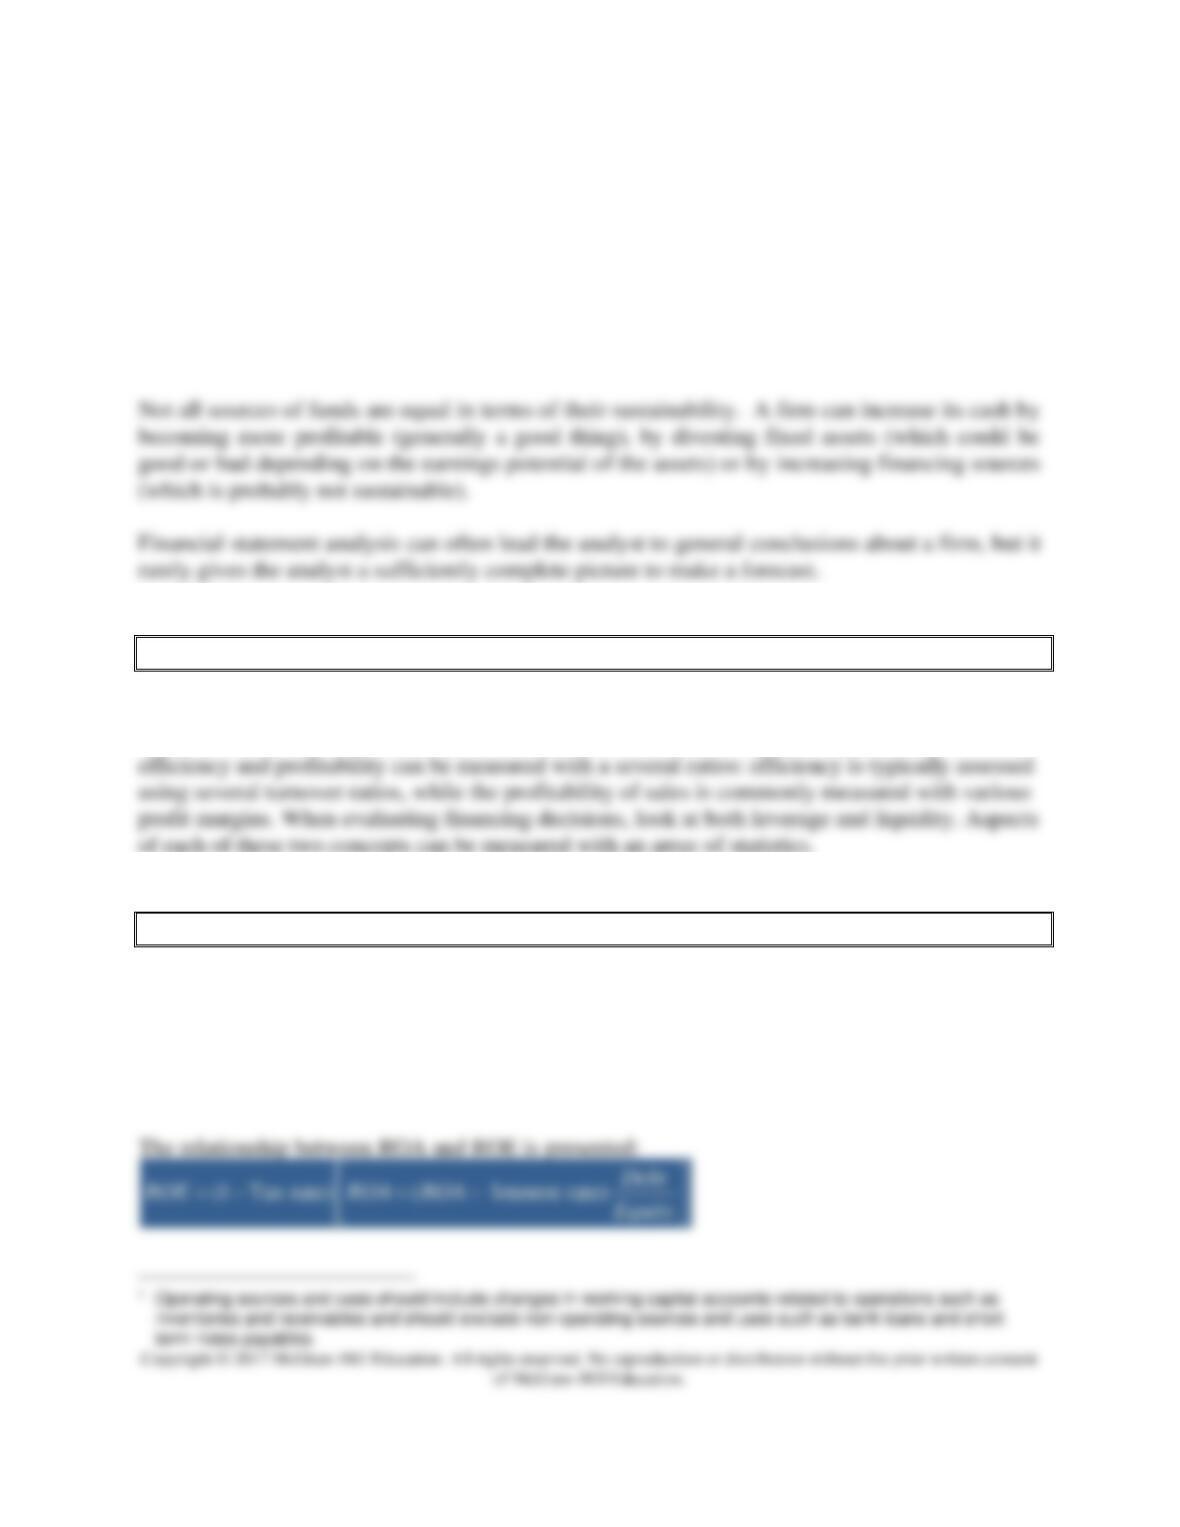
The firm’s financial policies affect how ROA and ROE are linked because ROE is after tax and
ROA is before interest and taxes. Note that the text uses ROA = EBIT / Assets, whereas many
other texts calculate ROA = NI / Assets. It is crucial that the instructor make this point with the
students. In concept the text uses a measure of operating return on assets rather than an overall
return on assets.
Chapter 14 - Financial Statement Analysis
This relationship can be used to illustrate a key point about leverage and the return on equity.
Using debt in the capital structure can increase the ROE if the ROA is greater than the interest
rate on the debt. Hence, the choice of the optimal capital structure will be dependent on
4. Ratio Analysis
PPT 14-13 through PPT 14-26
Ratio analysis is used to highlight specific aspects of performance. All ratios require a
benchmark (although ‘rules of thumb’ have been developed for some) for comparison. The
benchmark may be the same ratio in a different time period or the value of a competitor or group
of competitors. Ratios are very important to the investment community and are used extensively
in security analysis. They are also used by credit rating agencies to establish security ratings.
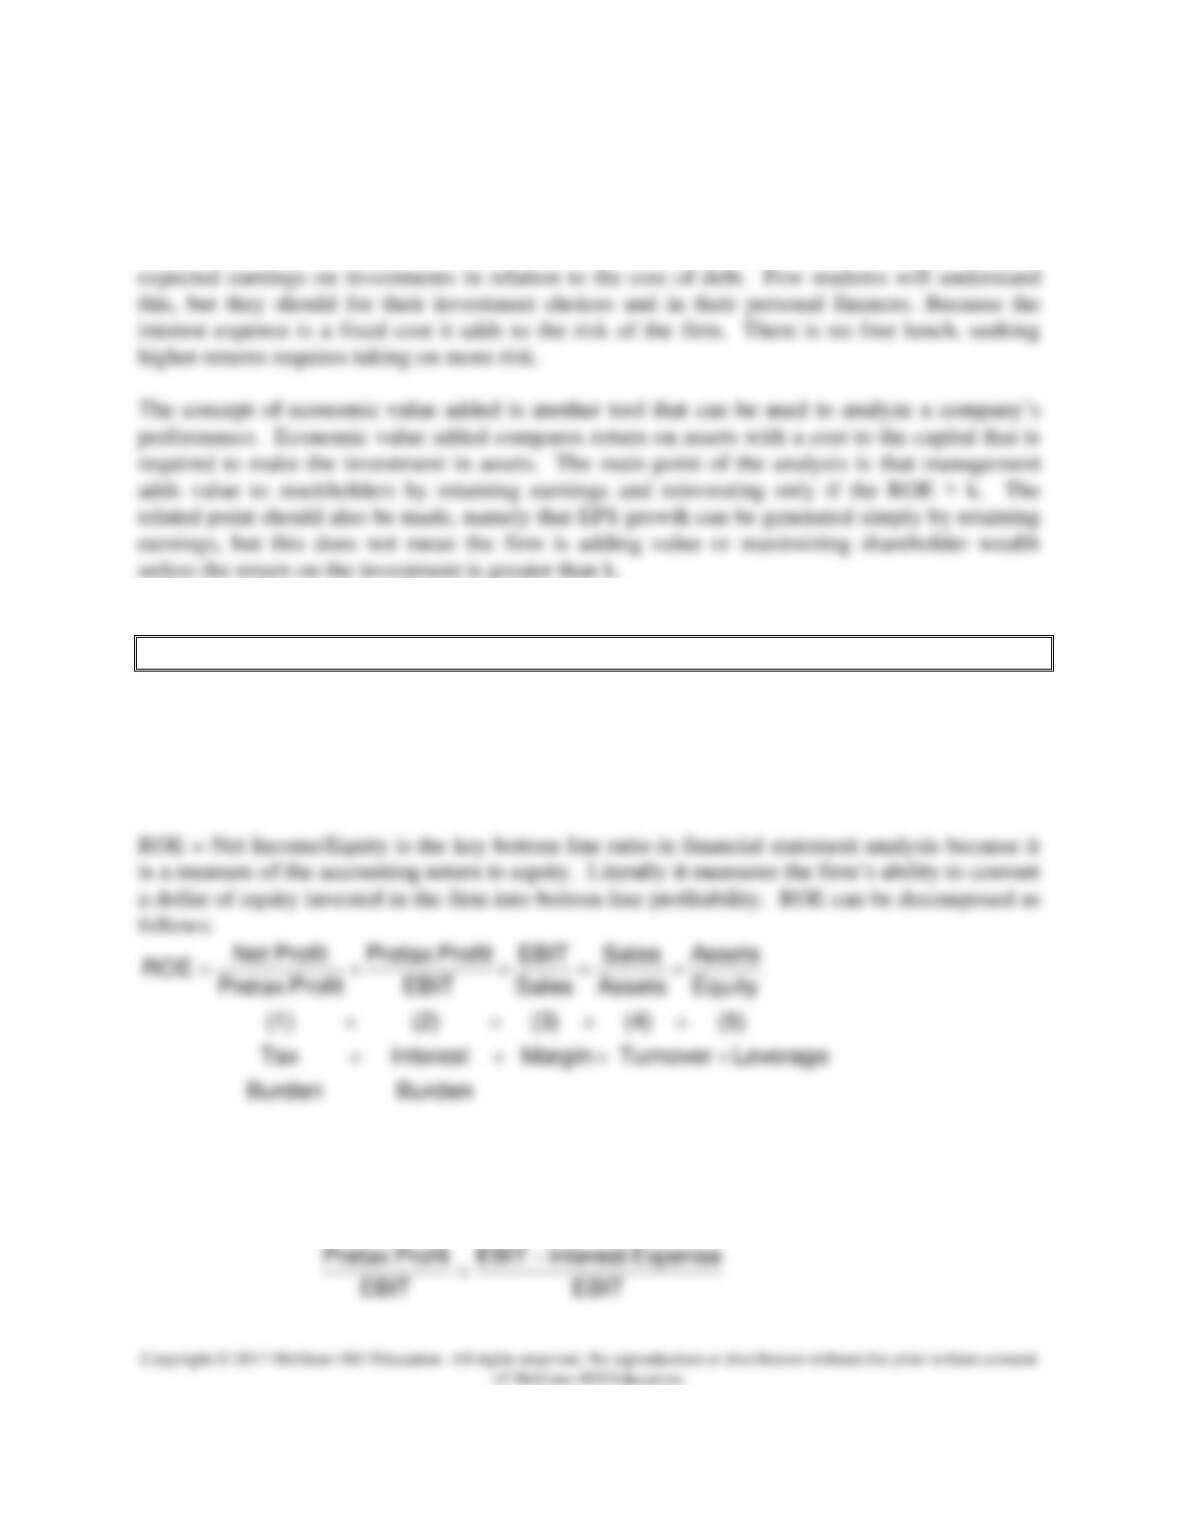
Ratio (1) Tax Burden (TB) measures the percentage of pretax profit that the firm keeps after
paying taxes. Ratio (2) Interest Burden (IB) measures the percent of EBIT kept after paying
interest expense. This ratio is 1 if the firm has no debt. One can see this by restating the
relationship as follows:
invested in the assets. The Margin x ATO = ROA.
Ratio (5) Leverage ratio = 1 + Debt / Equity. The leverage ratio is a measure of the percentage
of debt in total capitalization. Note that it appears that using more debt as a percent of capital
will increase ROE, but using more debt also reduces the interest burden ratio.
The various debt ratios are all algebraically equivalent. Knowing the Debt / Asset ratio, one can
firm while inventory turnover is critical for a manufacturer.
Profitability ratios measure profits to sales, assets or equity. All profitability measures that
include net income are subject to potential problems in comparability. Since net income is
influenced by financial leverage, if firms use different amounts of borrowing, it is difficult to
compare the profitability directly. We would expect firms with more leverage to have higher
charge-coverage ratios are used to assess the firm’s ability to service debt. Debt to assets and
debt to equity are used to assess how much debt financing the firm is using.
The price-to-earnings and market-to-book ratios are presented. These ratios are regularly
reported and discussed in the financial press. The relevance of the market to book ratio varies
with industries. The relevance depends on how accurately the book value reflects economic
5. An Illustration of Financial Statement Analysis
PPT 14-27 through PPT 14-29
Some of the issues that short-term borrowing brings to analysis are illustrated by the example
6. Comparability Problems
PPT 14-30 through PPT 14-36
Since financial ratios are based on accounting data, an analyst must be aware of differences in
accounting methods that could affect comparison of ratios. Some of the key problems of
comparability include different inventory valuation methods. This is an important factor since it
influences cost of goods sold, which is the major component of costs on most income statements.
categories: Level 1: Assets that are traded in active markets and should be valued at market
prices, Level 2: Asset that are not actively traded, but their values may be estimated from market
data on similar assets, Level 3: Assets that can only be valued with inputs that are difficult to
observe. Level 2 and Level 3 assets may be valued using pricing models and the values may be
‘marked to model.’
real issue.
International accounting conventions are presented in the final part of this section. Quality of
earnings refers to the realism and sustainability of reported earnings. This implies that
• Allowance for bad debts must be realistic
• Extraordinary and Non-recurring items are sometimes pretty ordinary and common
financial statements and U.S. firms do not, so foreign firms have lower reported earnings, ceteris
paribus. Treatment of intangibles varies widely between countries as well, increasing
comparability problems. The International Financial Reporting Standards (IFRS) have been
adopted by the European Union and by over 100 countries.
In 2007 the SEC began allowing foreign firms to list their securities in U.S. markets if they
7. Value Investing: The Graham Technique
Chapter 14 - Financial Statement Analysis


