Unlock document.
This document is partially blurred.
Unlock all pages and 1 million more documents.
Get Access
Financial Analysis: The Big Picture
FOR INSTRUCTOR USE ONLY
13-61
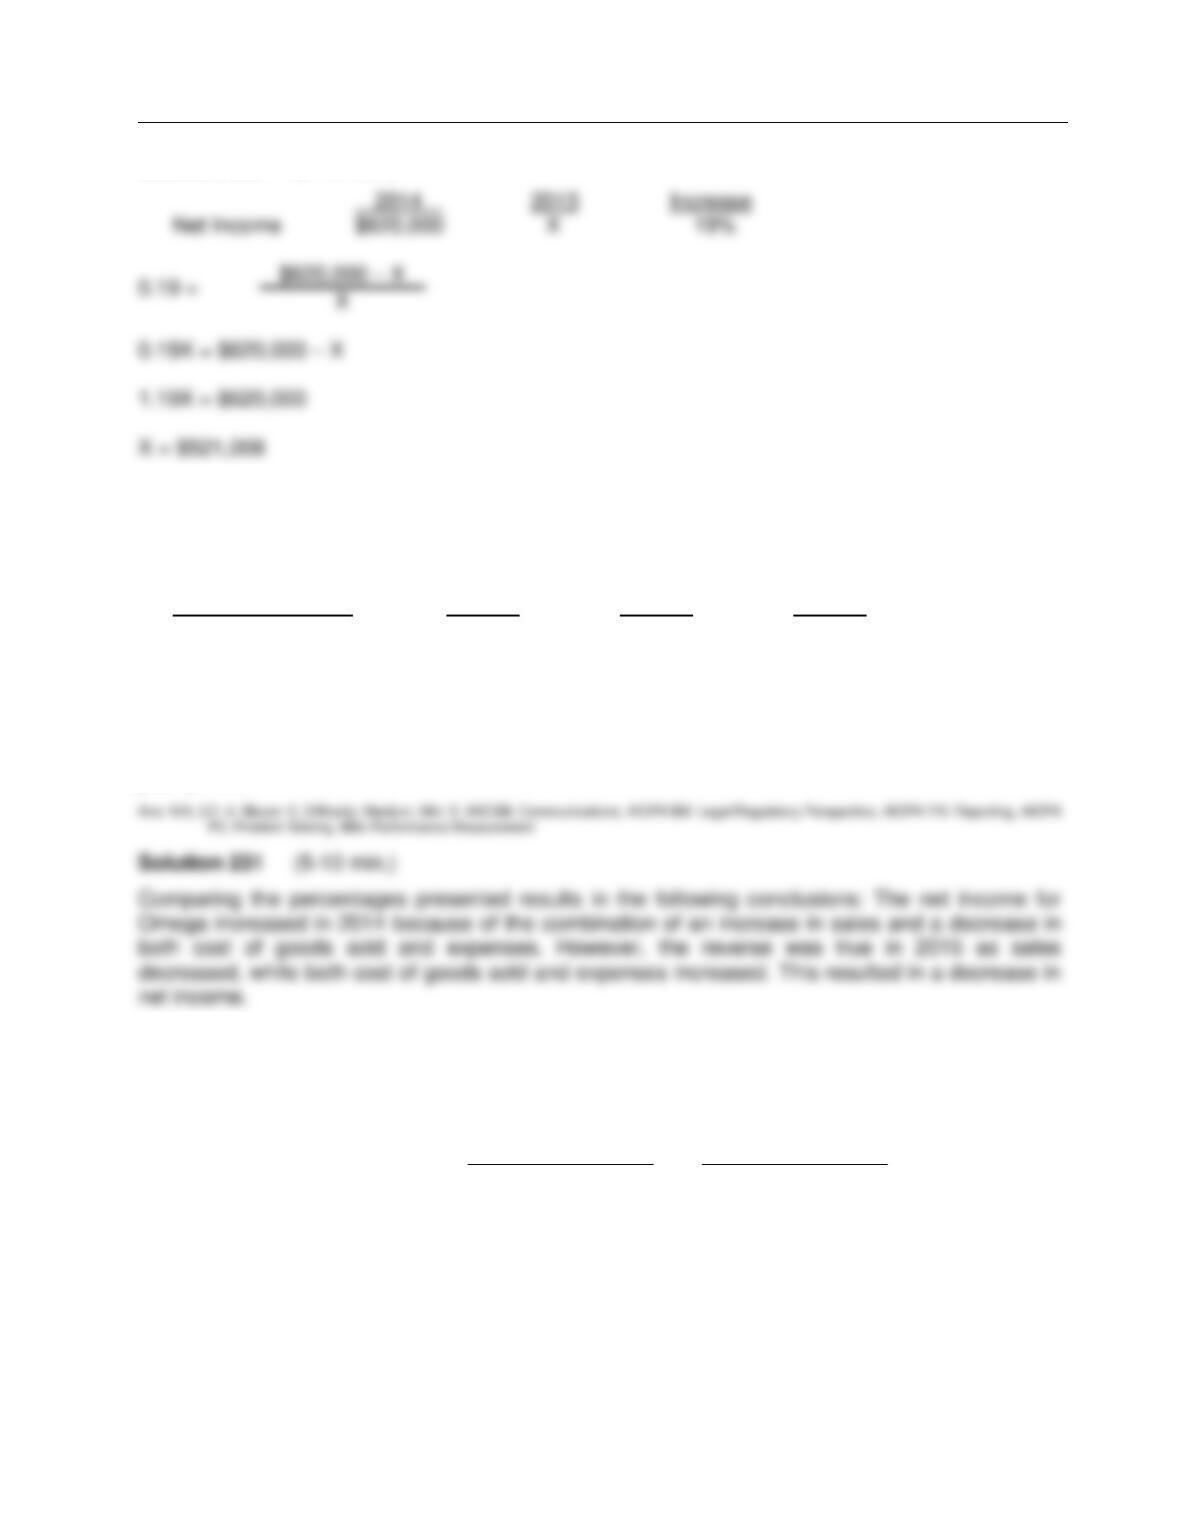
Solution 230 (5-10 min.)
Be. 231
Horizontal analysis (trend analysis) percentages for Omega Company’s sales, cost of goods sold,
and expenses are listed here.
Horizontal Analysis 2015 2014 2013
Sales revenue 98.2% 104.8% 100.0%
Cost of goods sold 103.1 97.5 100.0
Expenses 108.6 96.4 100.0
Instructions
Explain whether Omega’s net income increased, decreased, or remained unchanged over the 3-
year period.
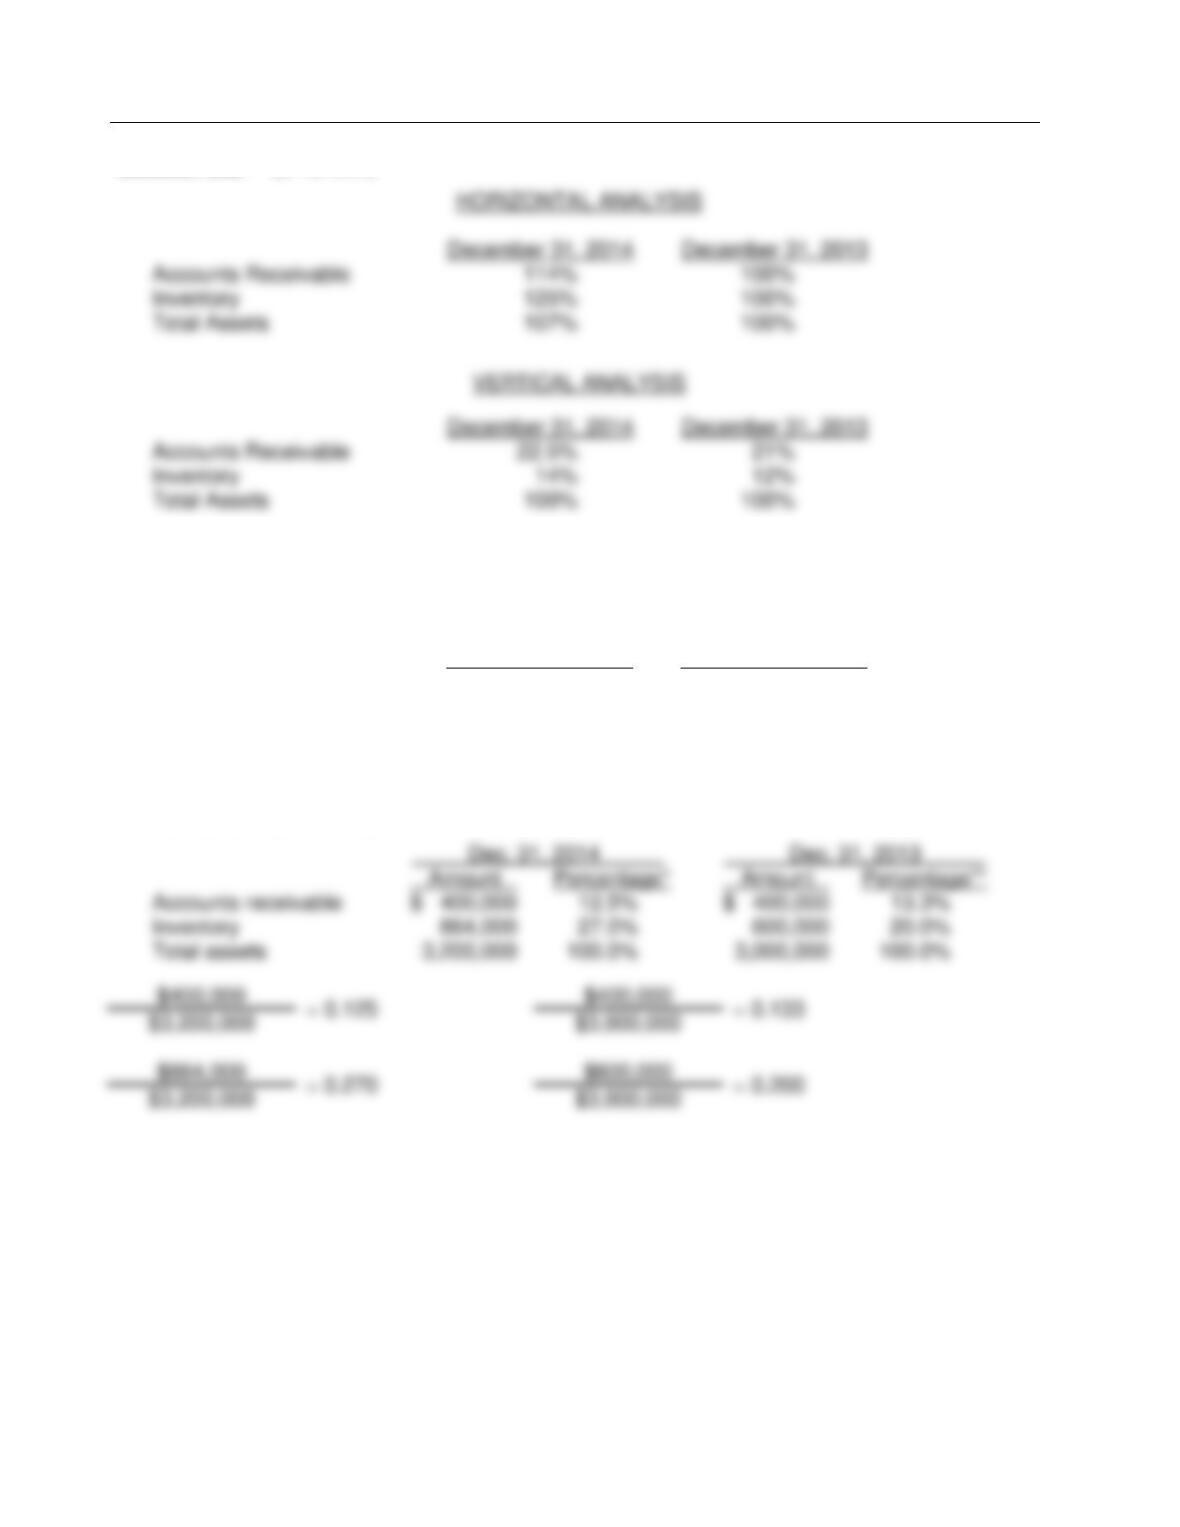
Be. 232
Using the following selected items from the comparative balance sheet of Kato Company, illustrate
horizontal and vertical analysis.
December 31, 2014 December 31, 2013
Accounts Receivable $ 720,000 $ 630,000
Inventory 450,000 360,000
Total Assets 3,200,000 3,000,000
Ans: N/A, LO: 4, 5, Bloom: AP, Difficulty: Medium, Min: 8, AACSB: Analytic, AICPA BB: Legal/Regulatory Perspective, AICPA FN: Reporting, AICPA PC:
Problem Solving, IMA: Performance Measurement
Test Bank for Accounting: Tools for Business Decision Making, Fifth Edition
FOR INSTRUCTOR USE ONLY
13-62
Solution 232 (8-12 min.)
Be. 233
Using these data from the comparative balance sheet of K. Leen Company, perform vertical
analysis.
December 31, 2014 December 31, 2013
Accounts receivable $ 400,000 $ 400,000
Inventory 864,000 600,000
Total assets 3,200,000 3,000,000
Ans: N/A, LO: 5, Bloom: AP, Difficulty: Medium, Min: 5, AACSB: Analytic, AICPA BB: Legal/Regulatory Perspective, AICPA FN: Reporting, AICPA PC:
Problem Solving, IMA: Performance Measurement
Solution 233 (5-10 min.)
Financial Analysis: The Big Picture
FOR INSTRUCTOR USE ONLY
13-63
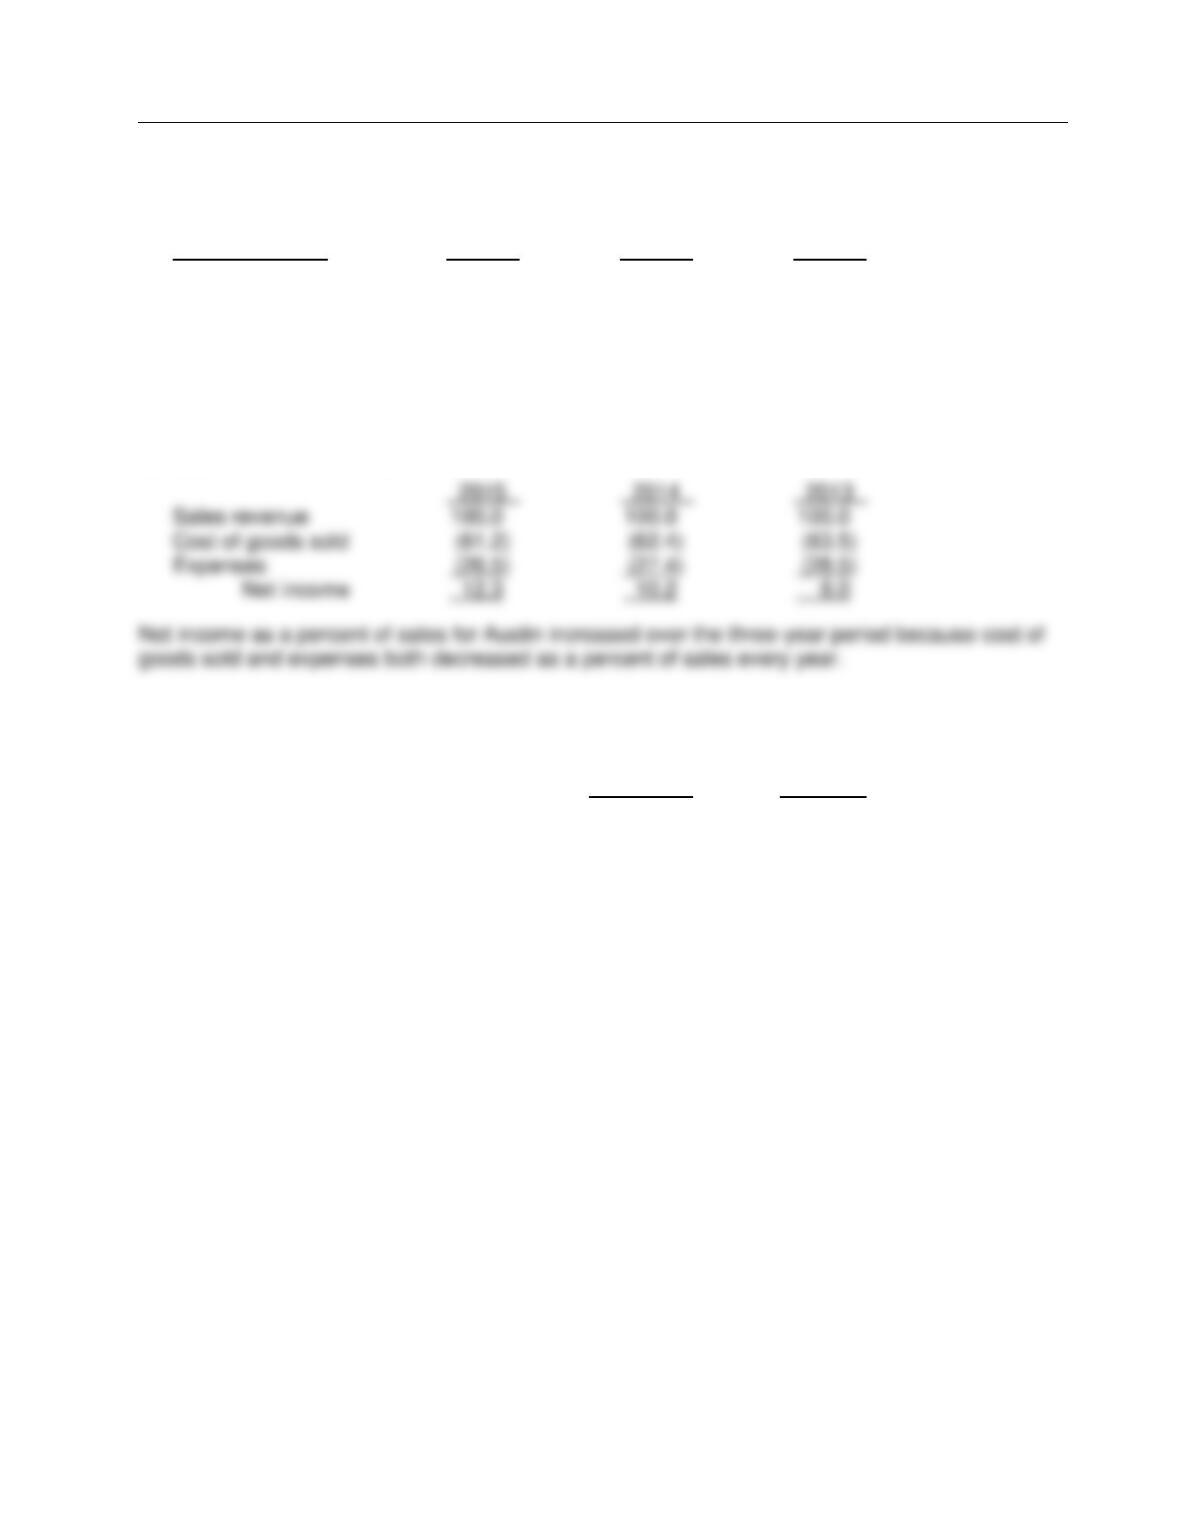
Be. 234
Vertical analysis (common-size) percentages for Austin Company’s sales, cost of goods sold, and
expenses are listed here.
Vertical Analysis 2015 2014 2013
Sales revenue 100.0% 100.0% 100.0%
Cost of goods sold 61.2 62.4 63.5
Expenses 26.5 27.4 28.5
Did Austin Company’s net income as a percent of sales increase, decrease, or remain unchanged
over the 3-year period? Provide numerical support for your answer.
Ans: N/A, LO: 5, Bloom: AP, Difficulty: Medium, Min: 5, AACSB: Analytic, AICPA BB: Legal/Regulatory Perspective, AICPA FN: Reporting, AICPA PC:
Problem Solving, IMA: Performance Measurement
Solution 234 (5-10 min.)
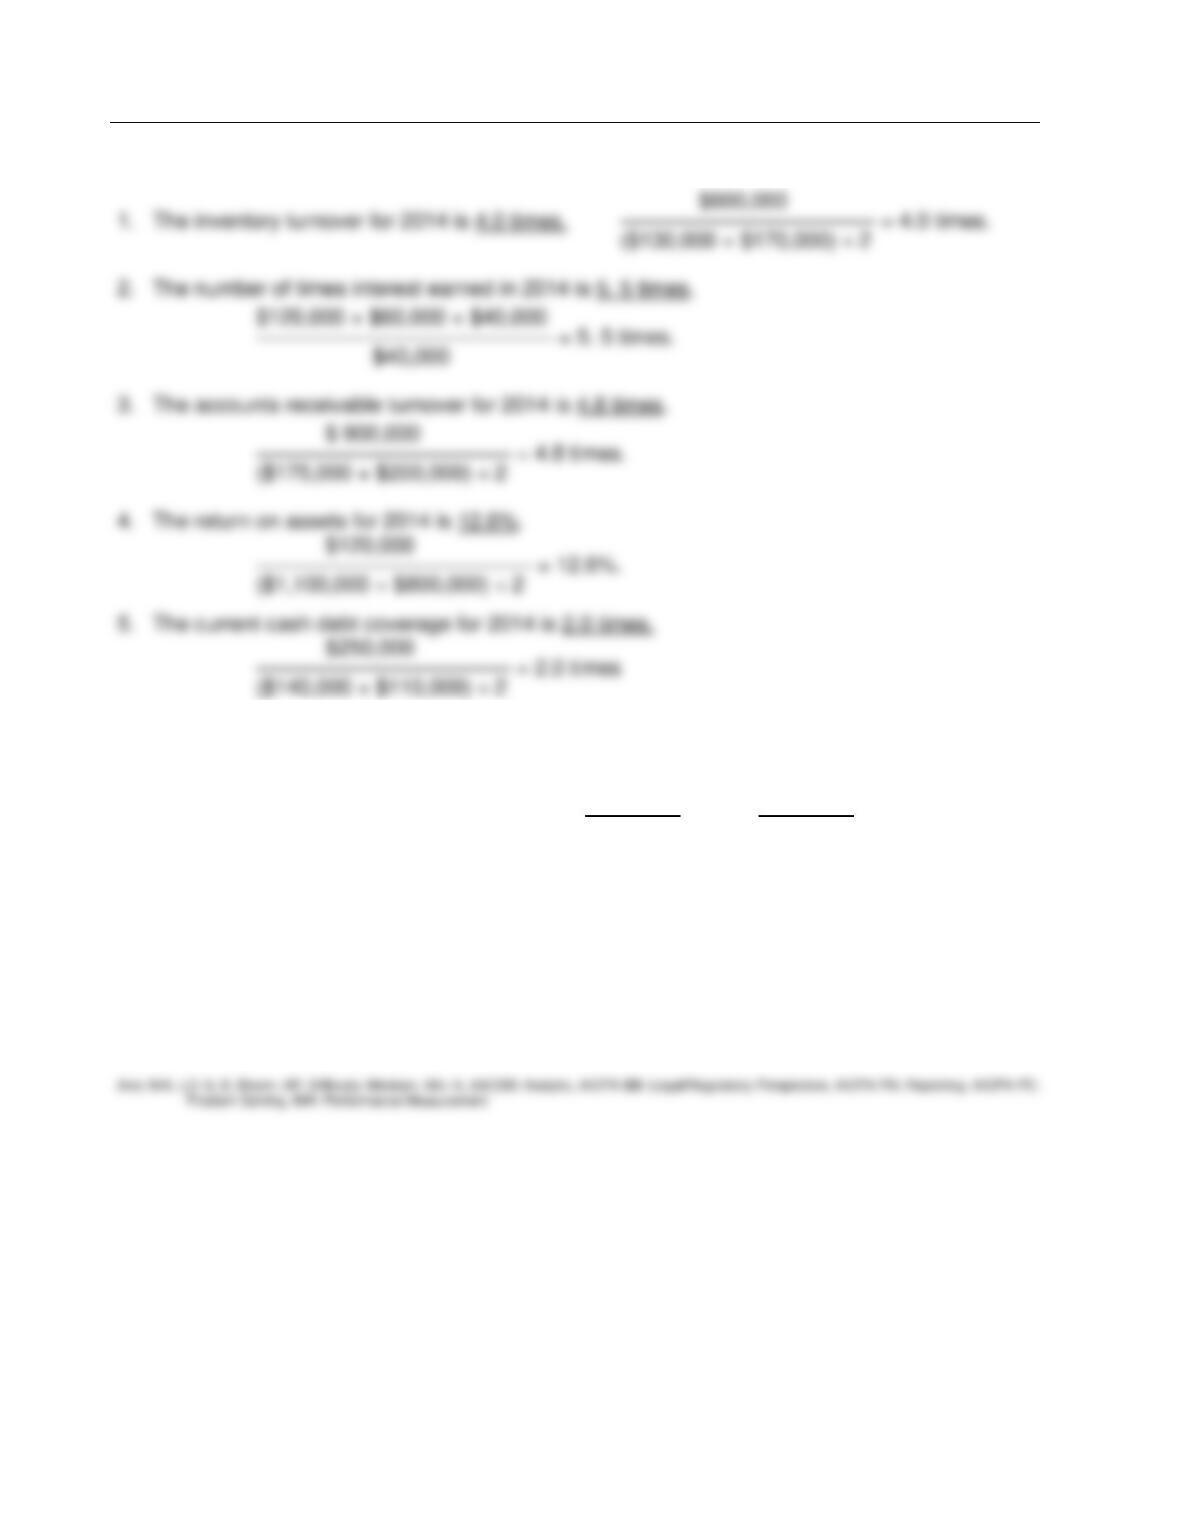
Be. 235
Selected information from the comparative financial statements of Barcelona Company for the
year ended December 31 appears below:
2014 2013
Accounts receivable (net) $ 175,000 $200,000
Inventory 130,000 170,000
Total assets 1,100,000 800,000
Current liabilities 140,000 110,000
Long-term debt 410,000 300,000
Net credit sales 900,000 700,000
Cost of goods sold 600,000 530,000
Interest expense 40,000 25,000
Income tax expense 60,000 29,000
Net income 120,000 85,000
Net cash provided by operating activities 250,000 135,000
Instructions
Answer the following questions relating to the year ended December 31, 2014. Show
computations.
1. The inventory turnover for 2014 is __________.
2. The number of times interest earned in 2014 is __________.
3. The accounts receivable turnover for 2014 is __________.
4. The return on assets for 2014 is __________.
5. The current cash debt coverage for 2014 is __________.
Ans: N/A, LO: 6, 8, Bloom: AP, Difficulty: Medium, Min: 10, AACSB: Analytic, AICPA BB: Legal/Regulatory Perspective, AICPA FN: Reporting, AICPA PC:
Problem Solving, IMA: Performance Measurement
Test Bank for Accounting: Tools for Business Decision Making, Fifth Edition
FOR INSTRUCTOR USE ONLY
13-64
Solution 235 (10-15 min.)
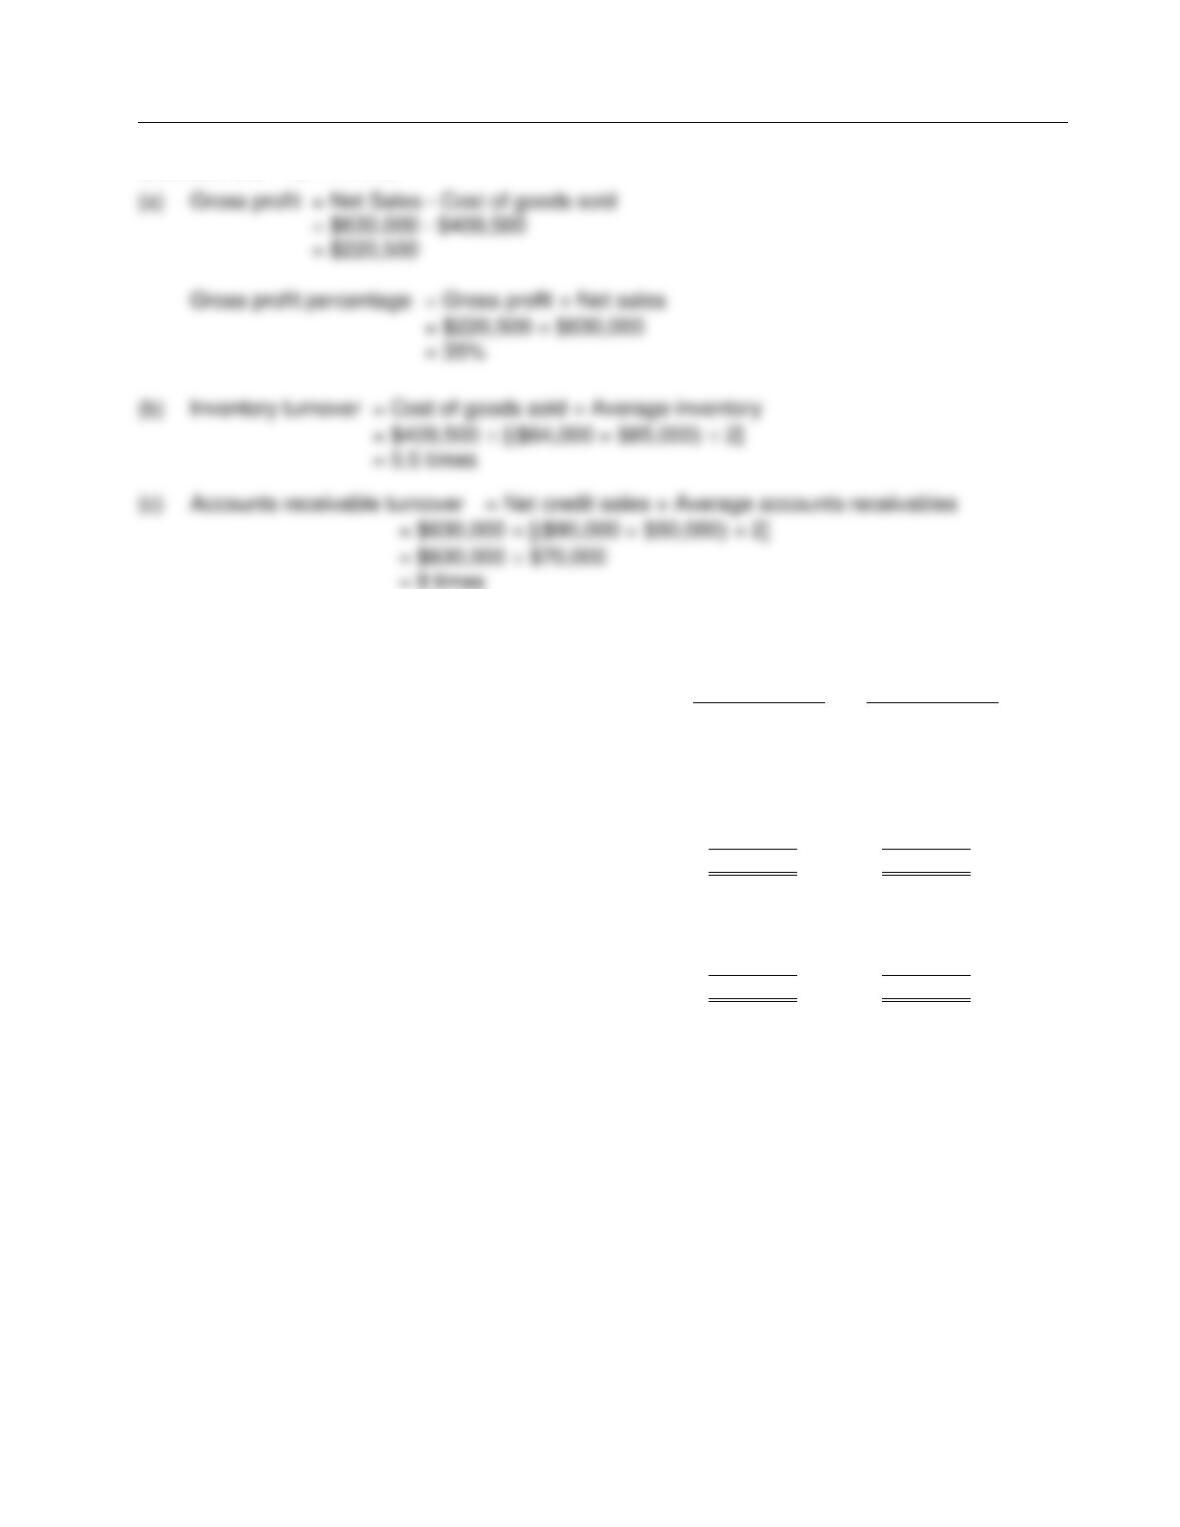
Be. 236
Selected data for Buechner Corporation appear below.
2014 2013
Net credit sales $630,000 $520,000
Cost of goods sold 409,500 312,000
Inventory at end of year 64,000 85,000
Accounts receivable at end of year 90,000 50,000
Instructions
Compute the following for 2014:
(a) Gross profit percentage
(b) Inventory turnover
(c) Accounts receivable turnover
Financial Analysis: The Big Picture
FOR INSTRUCTOR USE ONLY
13-65
Solution 236 (6-10 min.)
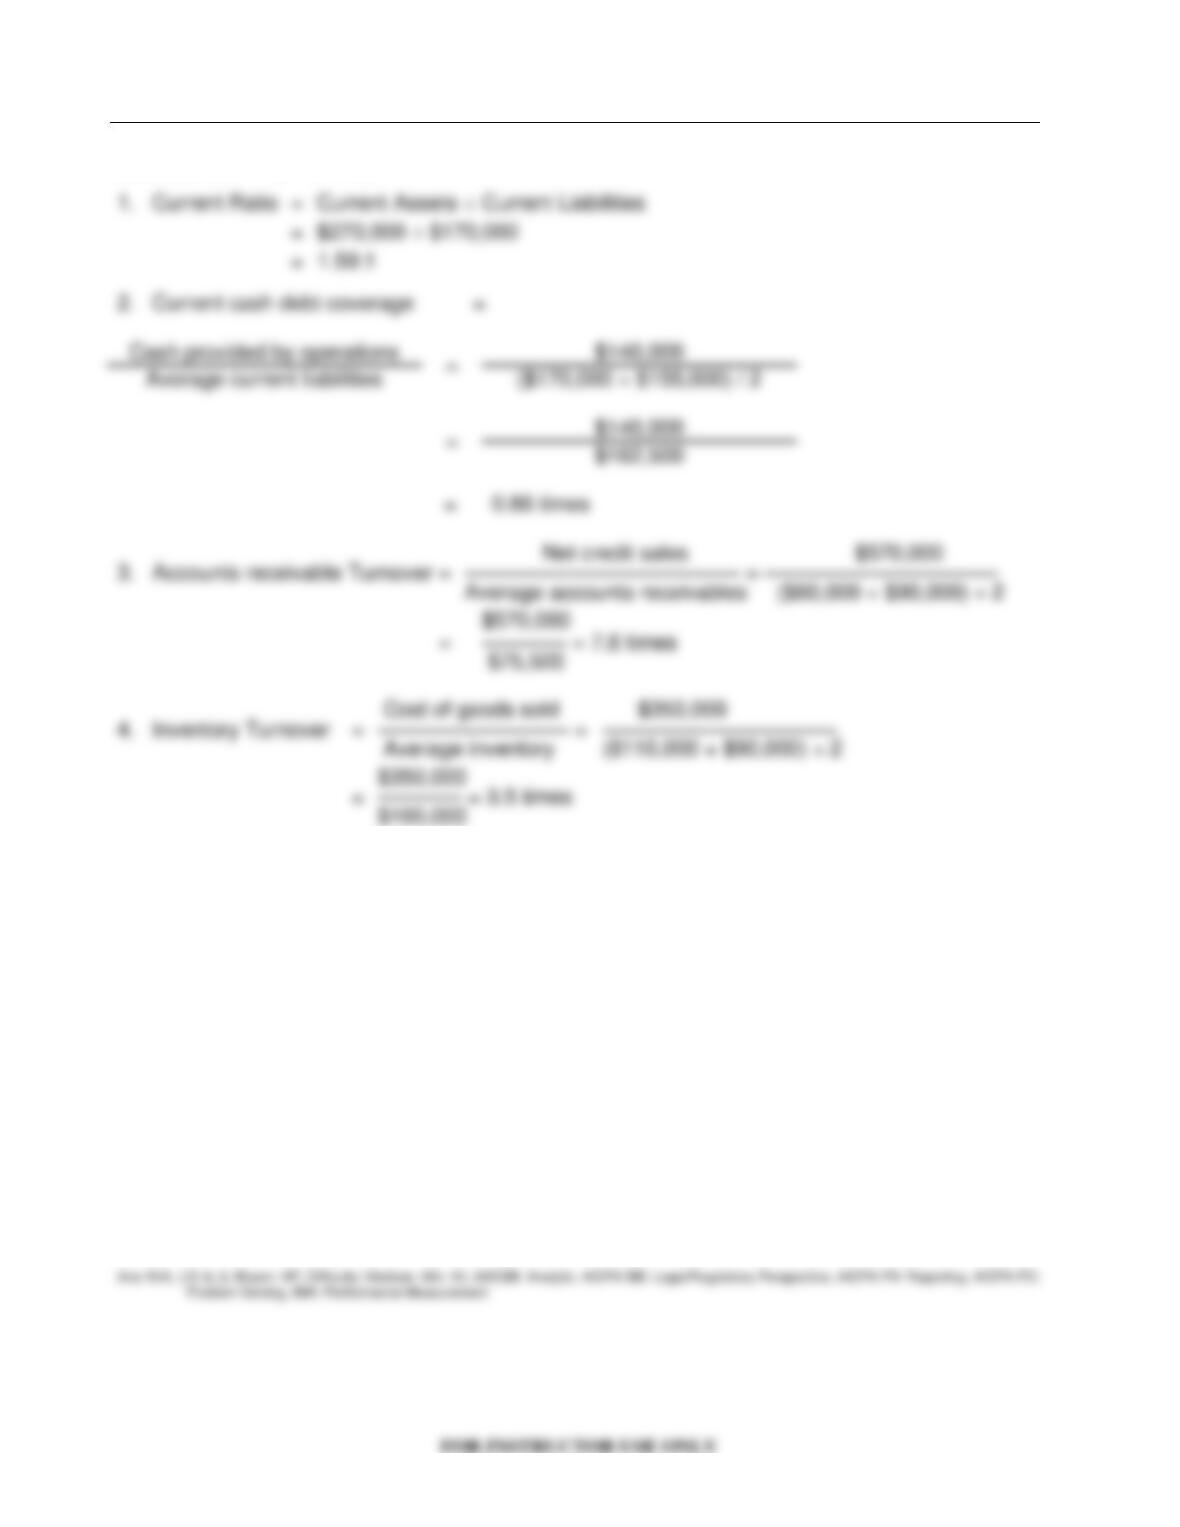
Be. 237
Corsig Corporation had the following comparative current assets and current liabilities:
Dec. 31, 2014 Dec. 31, 2013
Current assets
Cash $ 25,000 $ 30,000
Debt investments 40,000 10,000
Accounts receivable 60,000 90,000
Inventory 110,000 90,000
Prepaid expenses 35,000 25,000
Total current assets $270,000 $245,000
Current liabilities
Accounts payable $120,000 $110,000
Salaries and wages payable 40,000 30,000
Income tax payable 10,000 15,000
Total current liabilities $170,000 $155,000
During 2014, net credit sales and cost of goods sold were $570,000 and $350,000, respectively.
Net cash provided by operating activities for 2014 was $140,000.
Instructions
Compute the following liquidity measures for 2014:
1. Current ratio
2. Current cash debt coverage
3. Accounts receivable turnover
4. Inventory turnover
Ans: N/A, LO: 6, 8, Bloom: AP, Difficulty: Medium, Min: 8, AACSB: Analytic, AICPA BB: Legal/Regulatory Perspective, AICPA FN: Reporting, AICPA PC:
Problem Solving, IMA: Performance Measurement
Test Bank for Accounting: Tools for Business Decision Making, Fifth Edition
13-66
Solution 237 (8-12 min.)
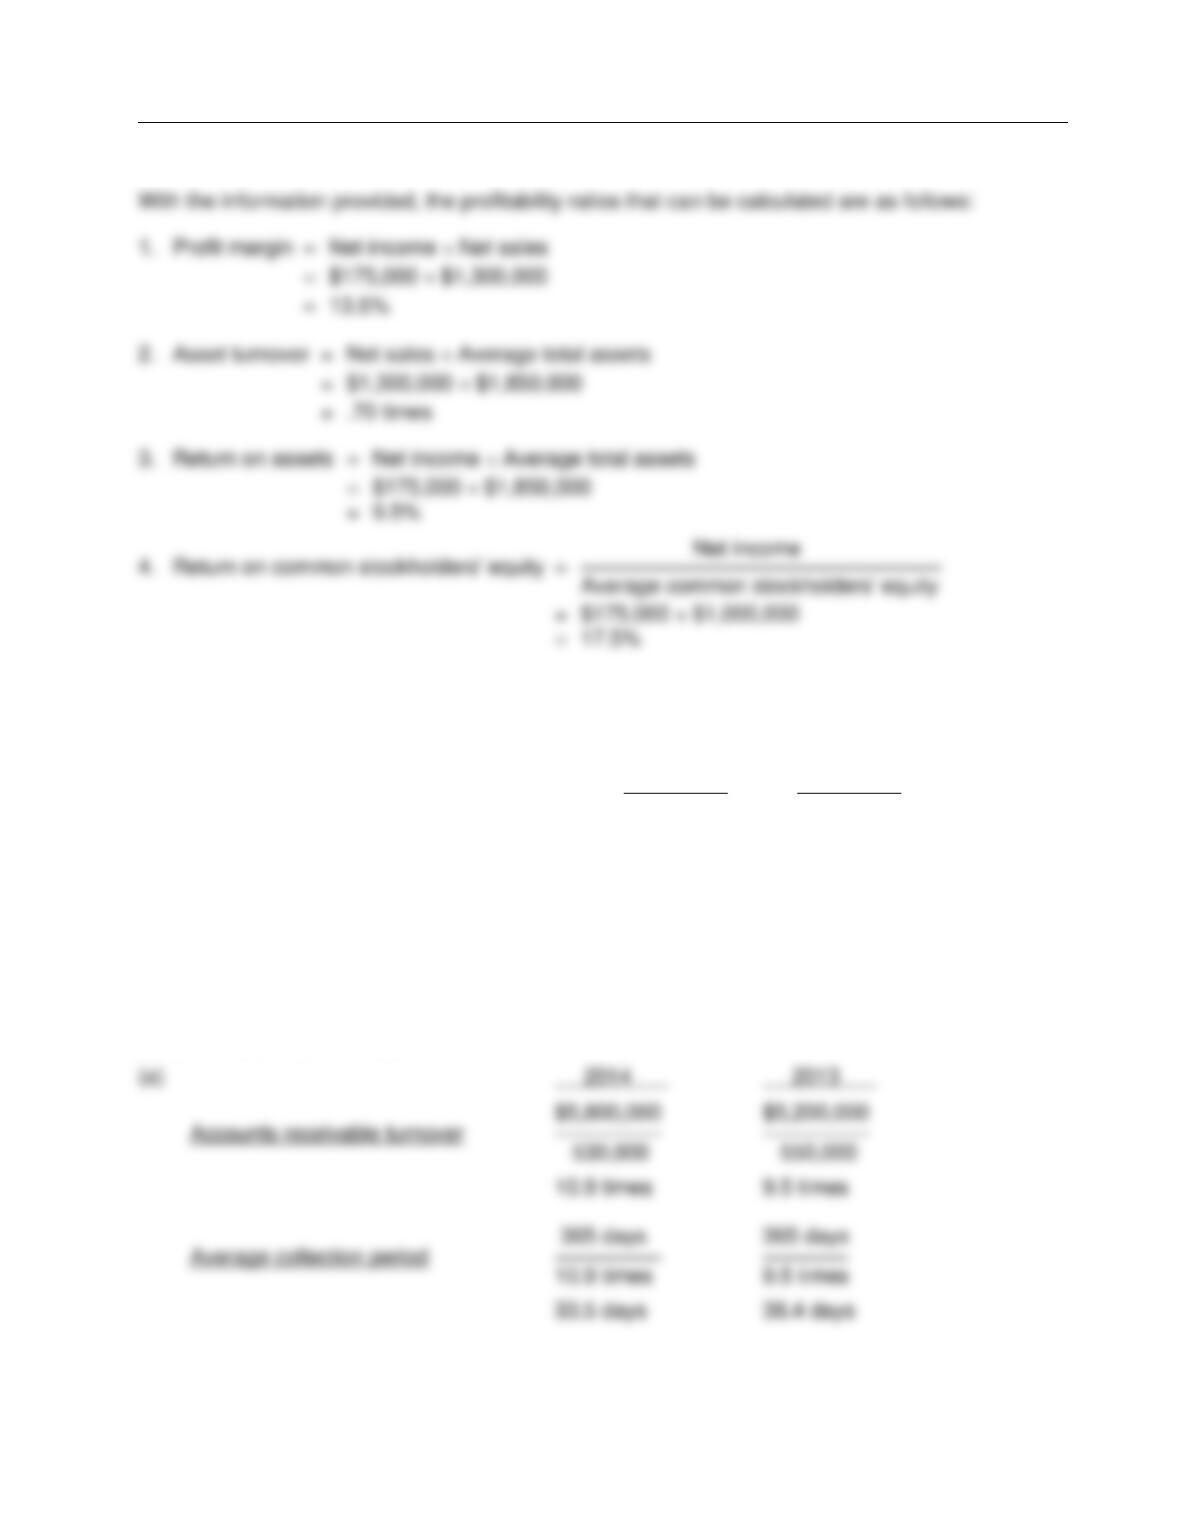
Be. 238
Selected data from the Florida Fruit Company are presented below:
Total assets $1,500,000
Average total assets 1,850,000
Net income 175,000
Net sales 1,300,000
Average common stockholders' equity 1,000,000
Net cash provided by operating activities 275,000
Instructions
Assuming that no dividends were declared or paid during the period, calculate the following
profitability ratios from the above information:
1. Profit margin
2. Asset turnover
3. Return on assets
4. Return on common stockholders’ equity
Financial Analysis: The Big Picture
FOR INSTRUCTOR USE ONLY
13-67
Solution 238 (10-15 min.)
Be. 239
The following data are taken from the financial statements of Bar Harbor Company:
2014 2013
Average accounts receivable $ 530,000 $ 550,000
Net sales on account 5,800,000 5,200,000
Terms for all sales are 2/10, n/30
Instructions
(a) Compute the accounts receivable turnover and the average collection period for both years.
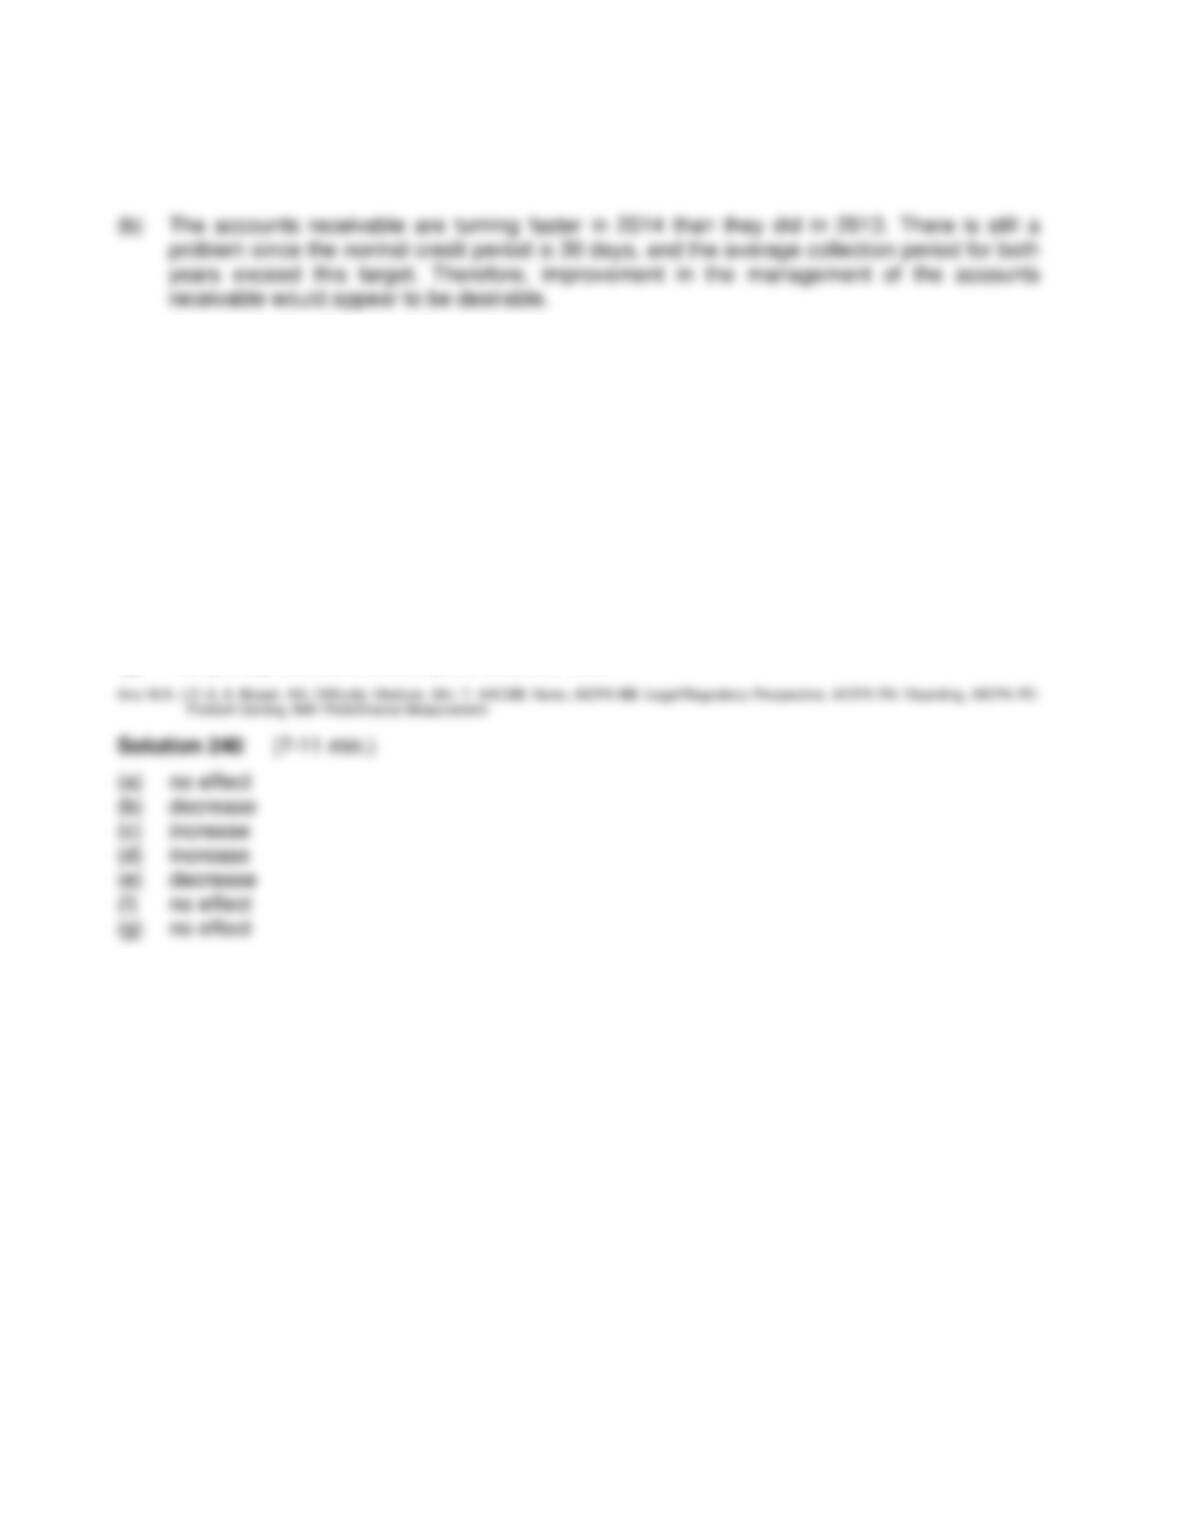
(b) What conclusion can an analyst draw about the management of the accounts receivable?
Ans: N/A, LO: 6, 8, Bloom: AP, Difficulty: Medium, Min: 8, AACSB: Analytic, AICPA BB: Legal/Regulatory Perspective, AICPA FN: Reporting, AICPA PC:
Problem Solving, IMA: Performance Measurement
Solution 239 (8-12 min.)
Test Bank for Accounting: Tools for Business Decision Making, Fifth Edition
FOR INSTRUCTOR USE ONLY
13-68
Solution 239 (Cont.)
Be. 240
State the effect of the following transactions on the current ratio. Use increase, decrease, or no
effect for your answer.
(a) Collection of an accounts receivable
(b) Declaration of cash dividends
(c) Additional stock is sold for cash
(d) Accounts payable are paid
(e) Equipment is purchased for cash
(f) Inventory purchases are made for cash
(g) Temporary investments are purchased for cash
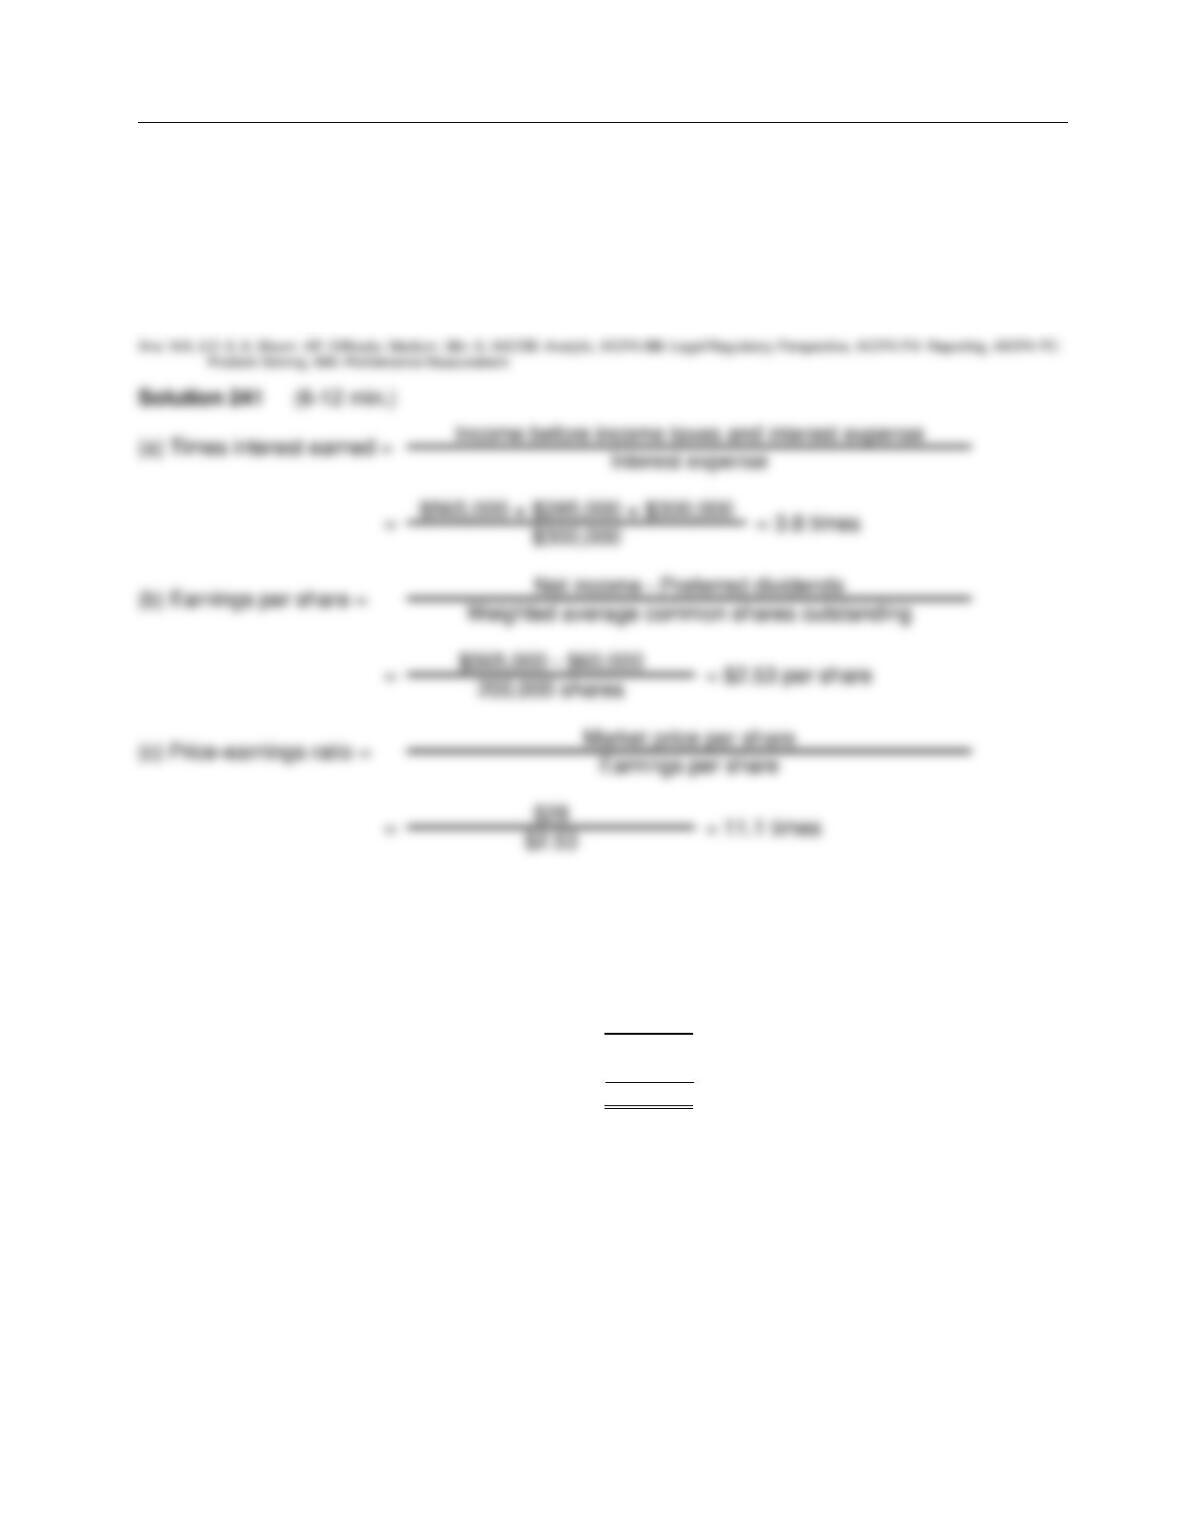
Be. 241
The balance sheet for Appalachian Corporation at the end of the current year includes the
following:
Bonds payable, 6% ........................................................ $5,000,000
6% Preferred stock, $100 par ........................................ 1,000,000
Common stock, $10 par ................................................ 2,000,000
Net income was $565,000 and income tax expense for the current year amounted to $285,000.
Cash dividends paid on common stock were $200,000, and the common stock was selling for $28
per share at the end of the year. There were no ownership changes during the year.
Financial Analysis: The Big Picture
FOR INSTRUCTOR USE ONLY
13-69
Be. 241 (Cont.)
Instructions
Determine each of the following:
(a) Number of times that bond interest was earned.
(b) Earnings per share for common stock.
(c) Price-earnings ratio.
Be. 242
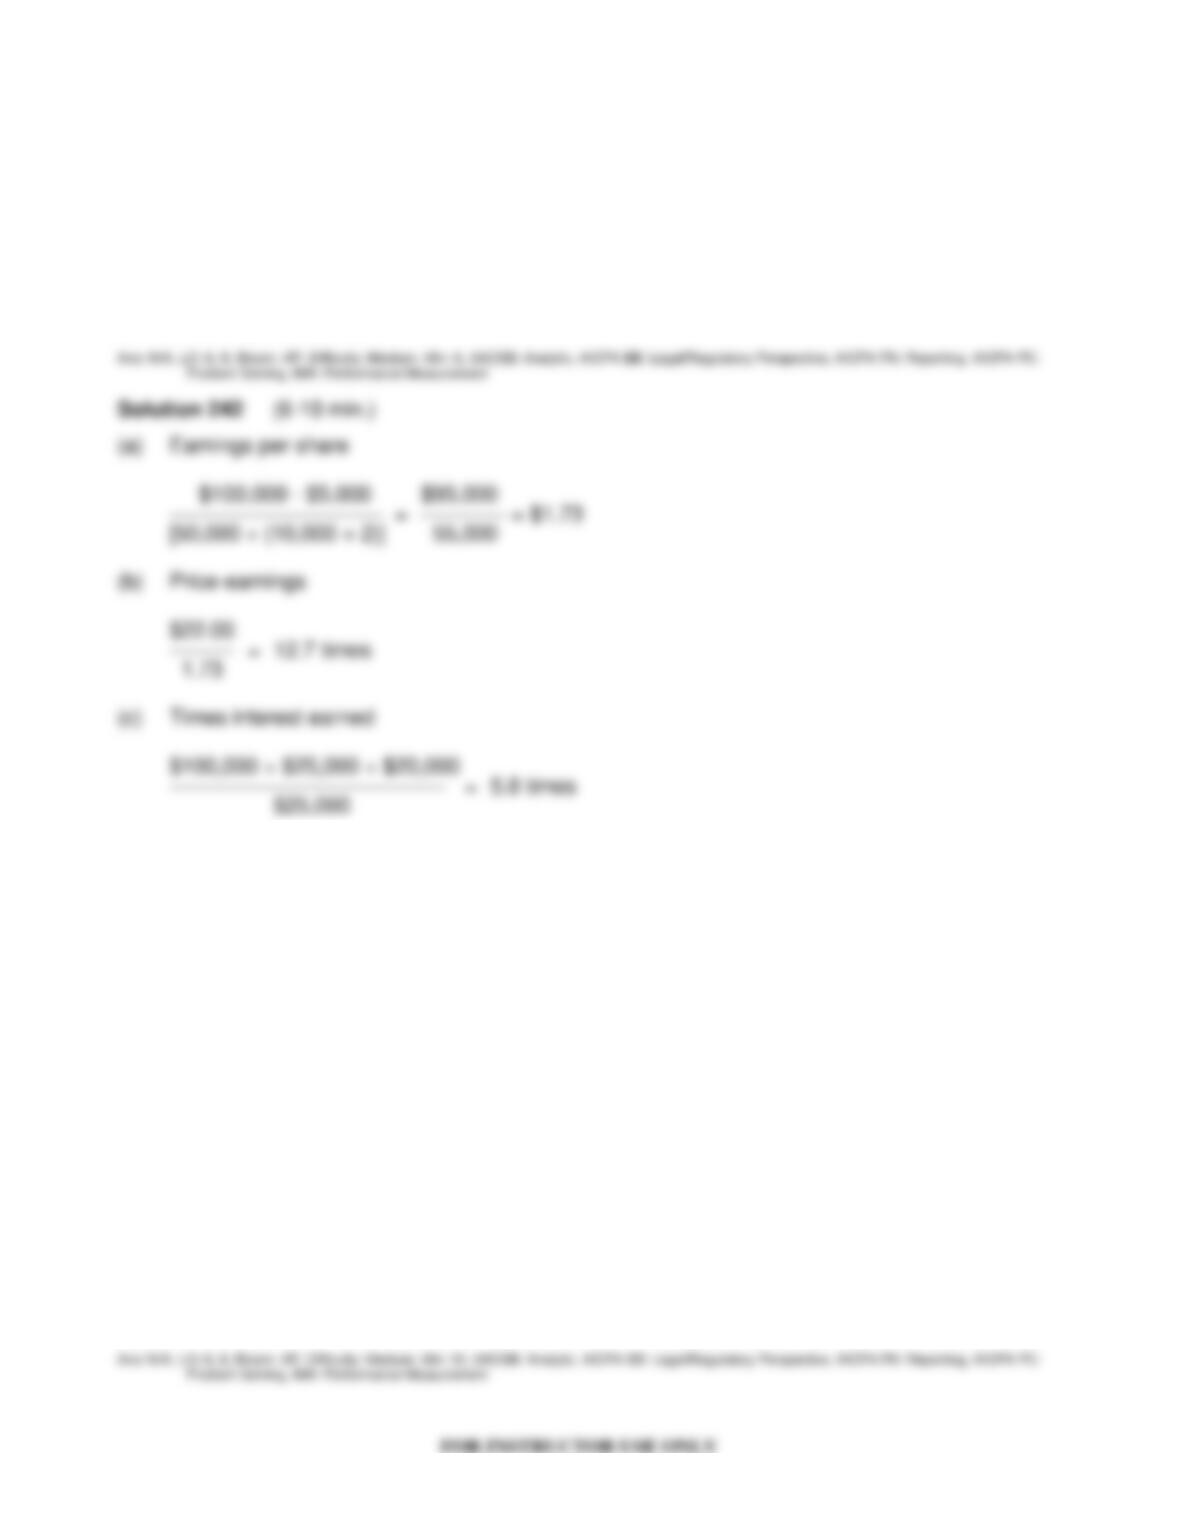
The income statement for the Carolina Service Company for the year ended December 31, 2014,
appears below.
Sales revenue $670,000
Cost of goods sold 390,000
Gross profit 280,000
Expenses 180,000*
Net income $100,000
*Includes $25,000 of interest expense and $20,000 of income tax expense.
Additional information:
1. Common stock outstanding on January 1, 2014, was 50,000 shares. On July 1, 2014, 10,000
more shares were issued.
2. The market price of Carolina's stock was $22 at the end of 2014.
3. Cash dividends of $35,000 were paid, $5,000 of which were paid to preferred stockholders.
Test Bank for Accounting: Tools for Business Decision Making, Fifth Edition
13-70
Be. 242 (Cont.)
Instructions
Compute the following ratios for 2014:
(a) Earnings per share.
(b) Price-earnings.
(c) Times interest earned.
Be. 243
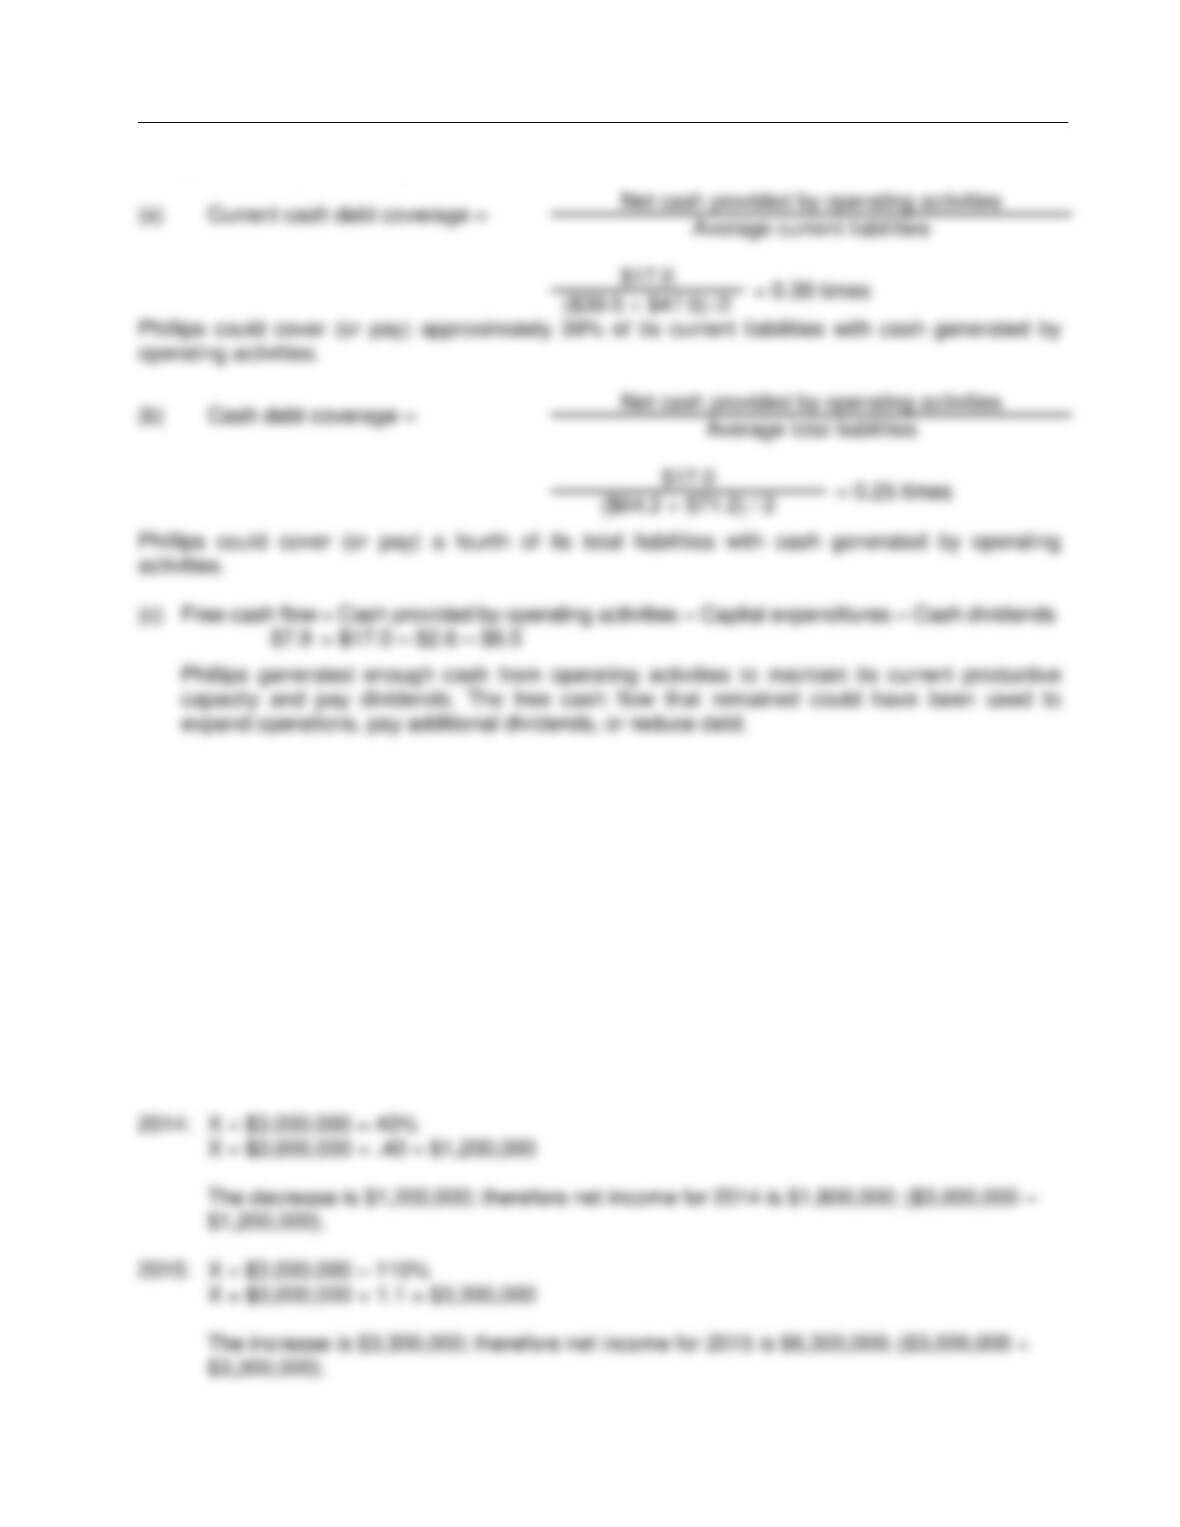
Selected data taken from the 2014 financial statements of Phillips Card Company, Inc. are as
follows (in millions).
Net sales $295.9
Current liabilities, February 28, 2013 39.5
Current liabilities, February 28, 2014 47.5
Net cash provided by operating activities 17.0
Total liabilities, February 28, 2013 64.2
Total liabilities, February 28, 2014 71.2
Capital expenditures 2.6
Cash dividends 6.5
Instructions
Compute these ratios at February 20, 2014:
(a) Current cash debt coverage
(b) Cash debt coverage
(c) Free cash flow
Provide a brief interpretation of your results.
Financial Analysis: The Big Picture
FOR INSTRUCTOR USE ONLY
13-71
Solution 243 (10-15 min.)
EXERCISES
Ex. 244
Exeter Corporation had net income of $3,000,000 in 2013. Using 2013 as the base year, net
income decreased by 40% in 2014 and increased by 110% in 2015.
Instructions
Compute the net income reported by Exeter Corporation for 2014 and 2015.
Ans: N/A, LO: 4, Bloom: AN, Difficulty: Hard, Min: 8, AACSB: Analytic, AICPA BB: Legal/Regulatory Perspective, AICPA FN: Reporting, AICPA PC:
Problem Solving, IMA: Performance Measurement
Solution 244 (8-12 min.)
Test Bank for Accounting: Tools for Business Decision Making, Fifth Edition
FOR INSTRUCTOR USE ONLY
13-72
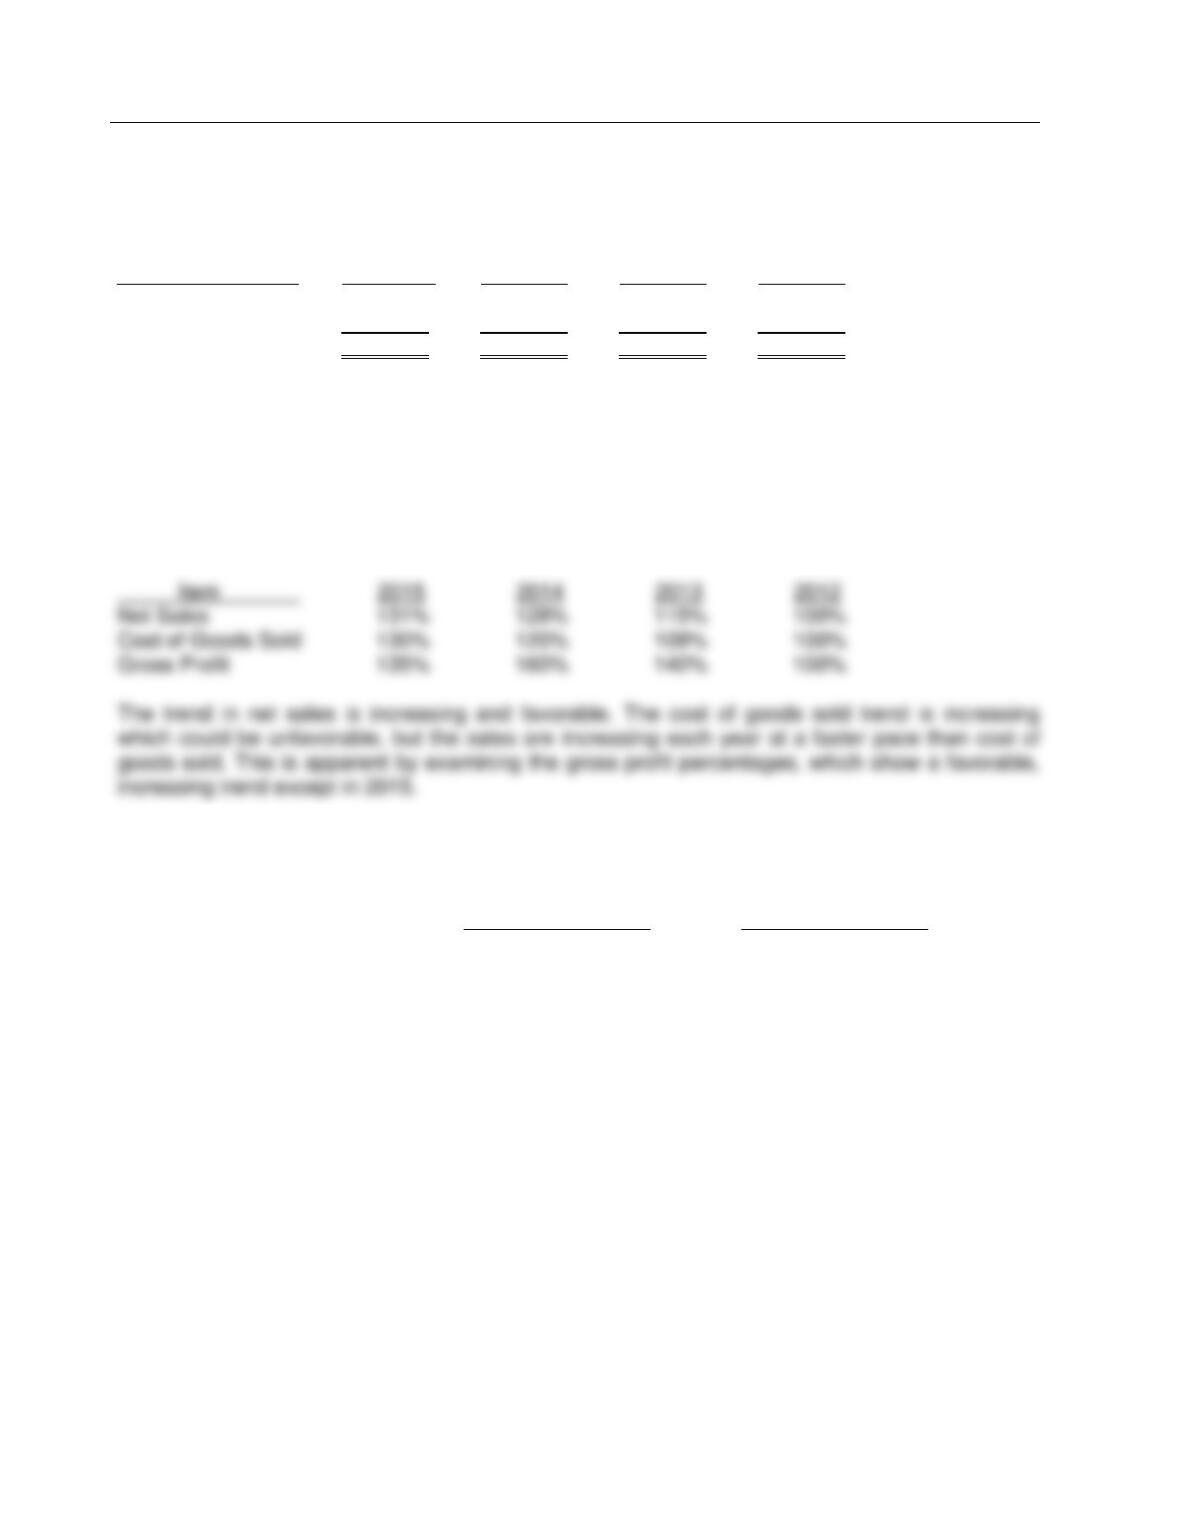
Ex. 245
The following items were taken from the financial statements of St. Johns, Inc., over a four-year
period:
Item 2015 2014 2013 2012
Net Sales $655,000 $640,000 $575,000 $500,000
Cost of Goods Sold 520,000 480,000 435,000 400,000
Gross Profit $135,000 $160,000 $140,000 $100,000
Instructions
Using horizontal analysis and 2012 as the base year, compute the trend percentages for net
sales, cost of goods sold, and gross profit. Explain whether the trends are favorable or
unfavorable for each item.
Ans: N/A, LO: 4, Bloom: AP, Difficulty: Medium, Min: 10, AACSB: Analytic, AICPA BB: Legal/Regulatory Perspective, AICPA FN: Reporting, AICPA PC:
Problem Solving, IMA: Performance Measurement
Solution 245 (10-15 min.)
Ex. 246
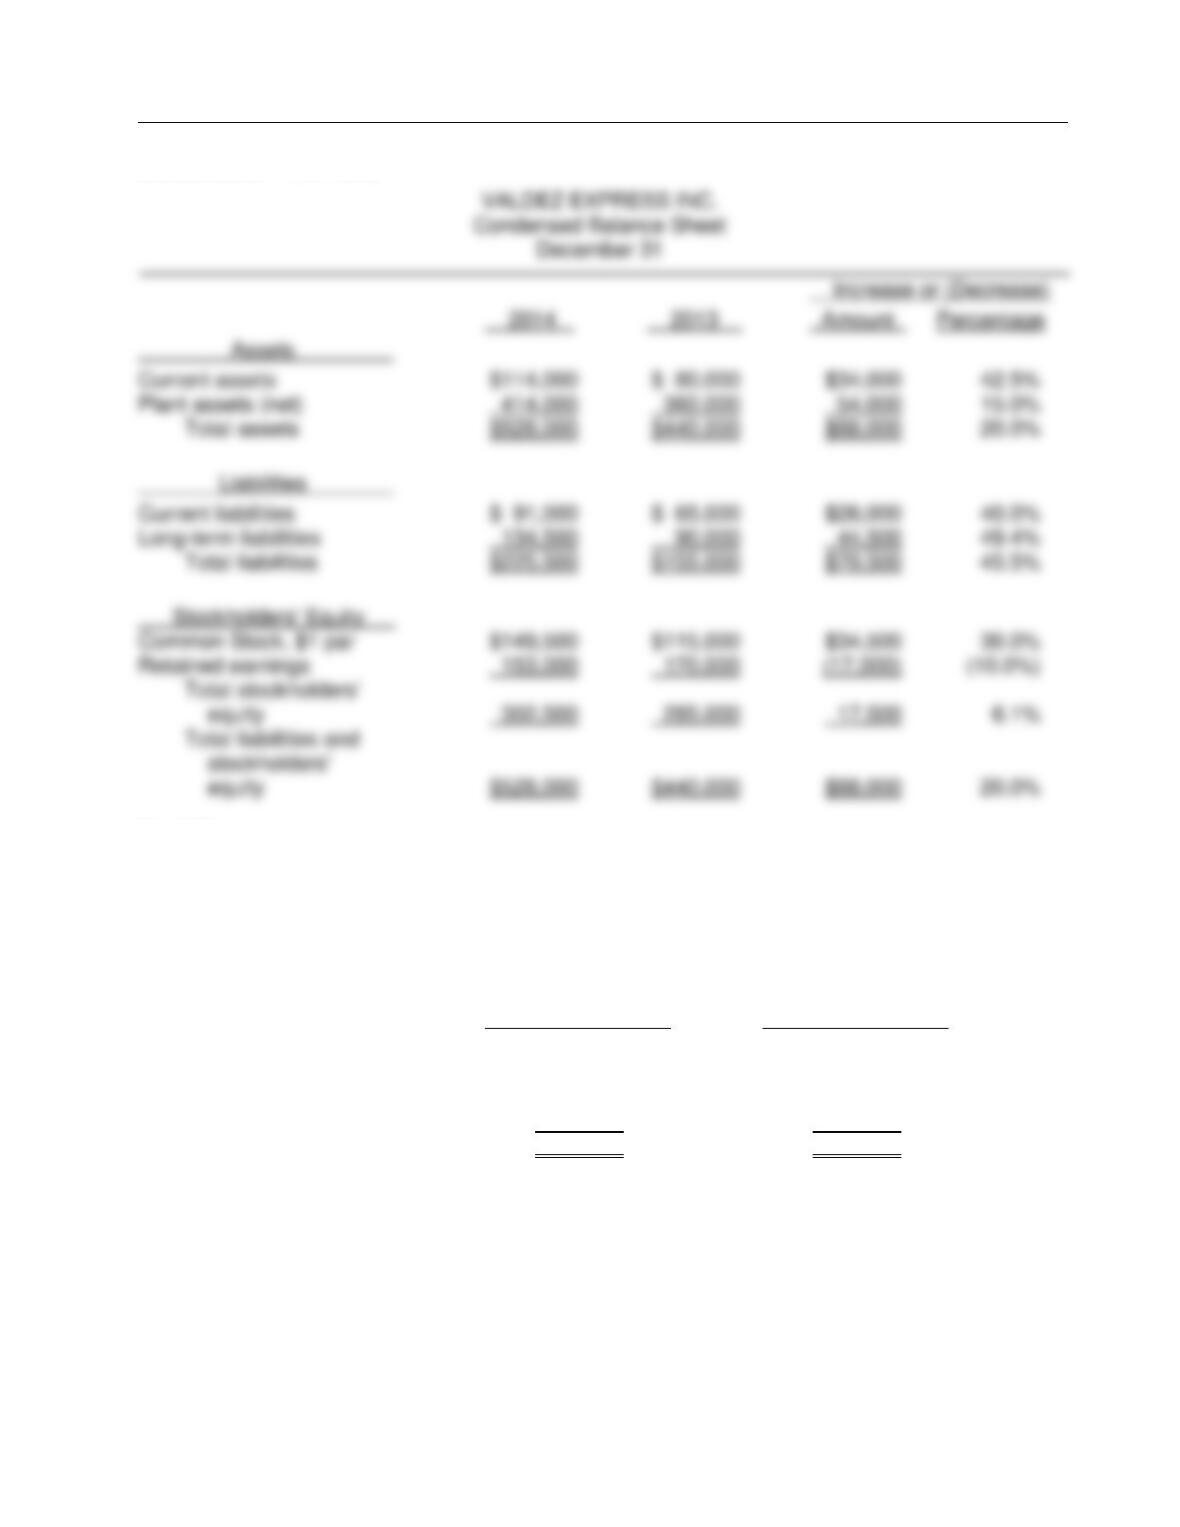
Here is financial information for Valdez Express Inc.
December 31, 2014 December 31, 2013
Current assets $114,000 $80,000
Plant assets (net) 414,000 360,000
Current liabilities 91,000 65,000
Long-term liabilities 134,500 90,000
Common stock, $1 par 149,500 115,000
Retained earnings 153,000 170,000
Instructions
Prepare a schedule showing a horizontal analysis for 2014 using 2013 as the base year.
Ans: N/A, LO: 4, Bloom: AP, Difficulty: Medium, Min: 10, AACSB: Analytic, AICPA BB: Legal/Regulatory Perspective, AICPA FN: Reporting, AICPA PC:
Problem Solving, IMA: Performance Measurement
Financial Analysis: The Big Picture
FOR INSTRUCTOR USE ONLY
13-73
Solution 246 (10 min.)
Ex. 247
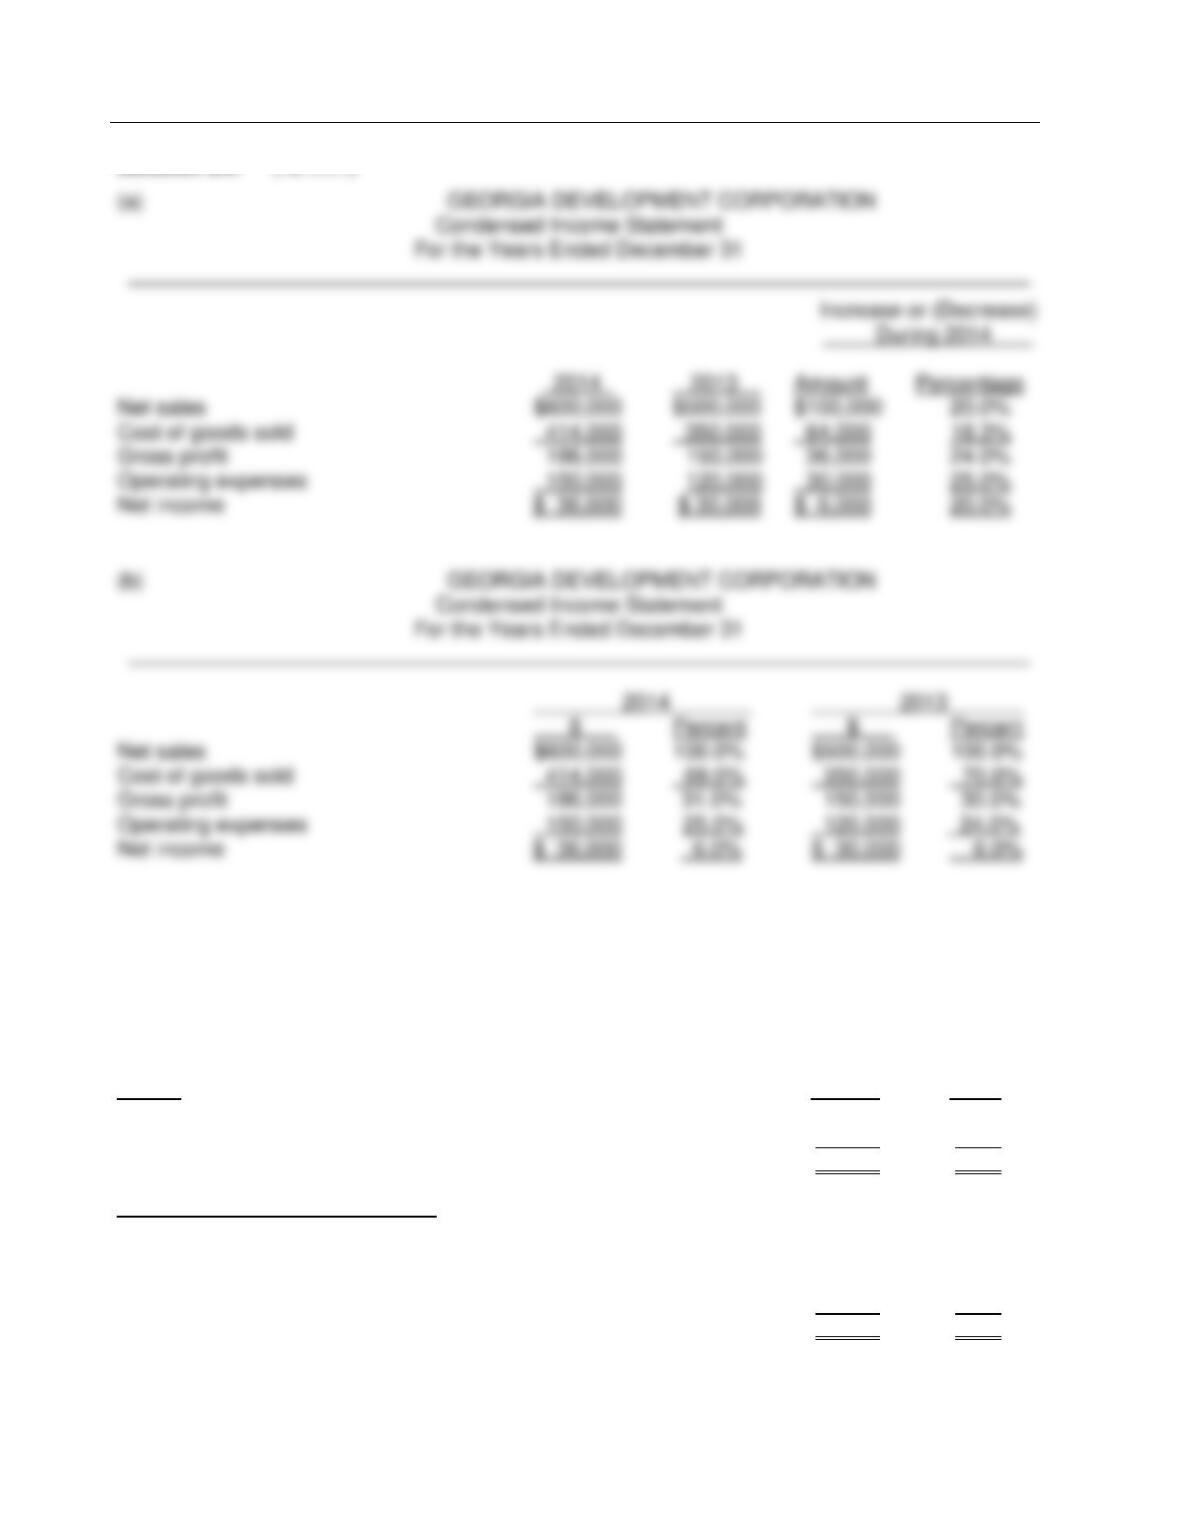
Here are the comparative income statements of Georgia Development Corporation.
GEORGIA DEVELOPMENT CORPORATION
Comparative Income Statements
For the Years Ended December 31
December 31, 2014 December 31, 2013
Net sales $600,000 $500,000
Cost of goods sold 414,000 350,000
Gross profit 186,000 150,000
Operating expenses 150,000 120,000
Net income $36,000 $30,000
Instructions
(a) Prepare a horizontal analysis of the income statement data for Georgia Development
Corporation using 2013 as a base. (Show the amounts of increase of decrease.)
(b) Prepare a vertical analysis of the income statement data for Georgia Development Corporation
for both years.
Ans: N/A, LO: 4,5, Bloom: AP, Difficulty: Medium, Min: 12, AACSB: Analytic, AICPA BB: Legal/Regulatory Perspective, AICPA FN: Reporting, AICPA PC:
Problem Solving, IMA: Performance Measurement
Test Bank for Accounting: Tools for Business Decision Making, Fifth Edition
FOR INSTRUCTOR USE ONLY
13-74
Solution 247 (12 min.)
Ex. 248
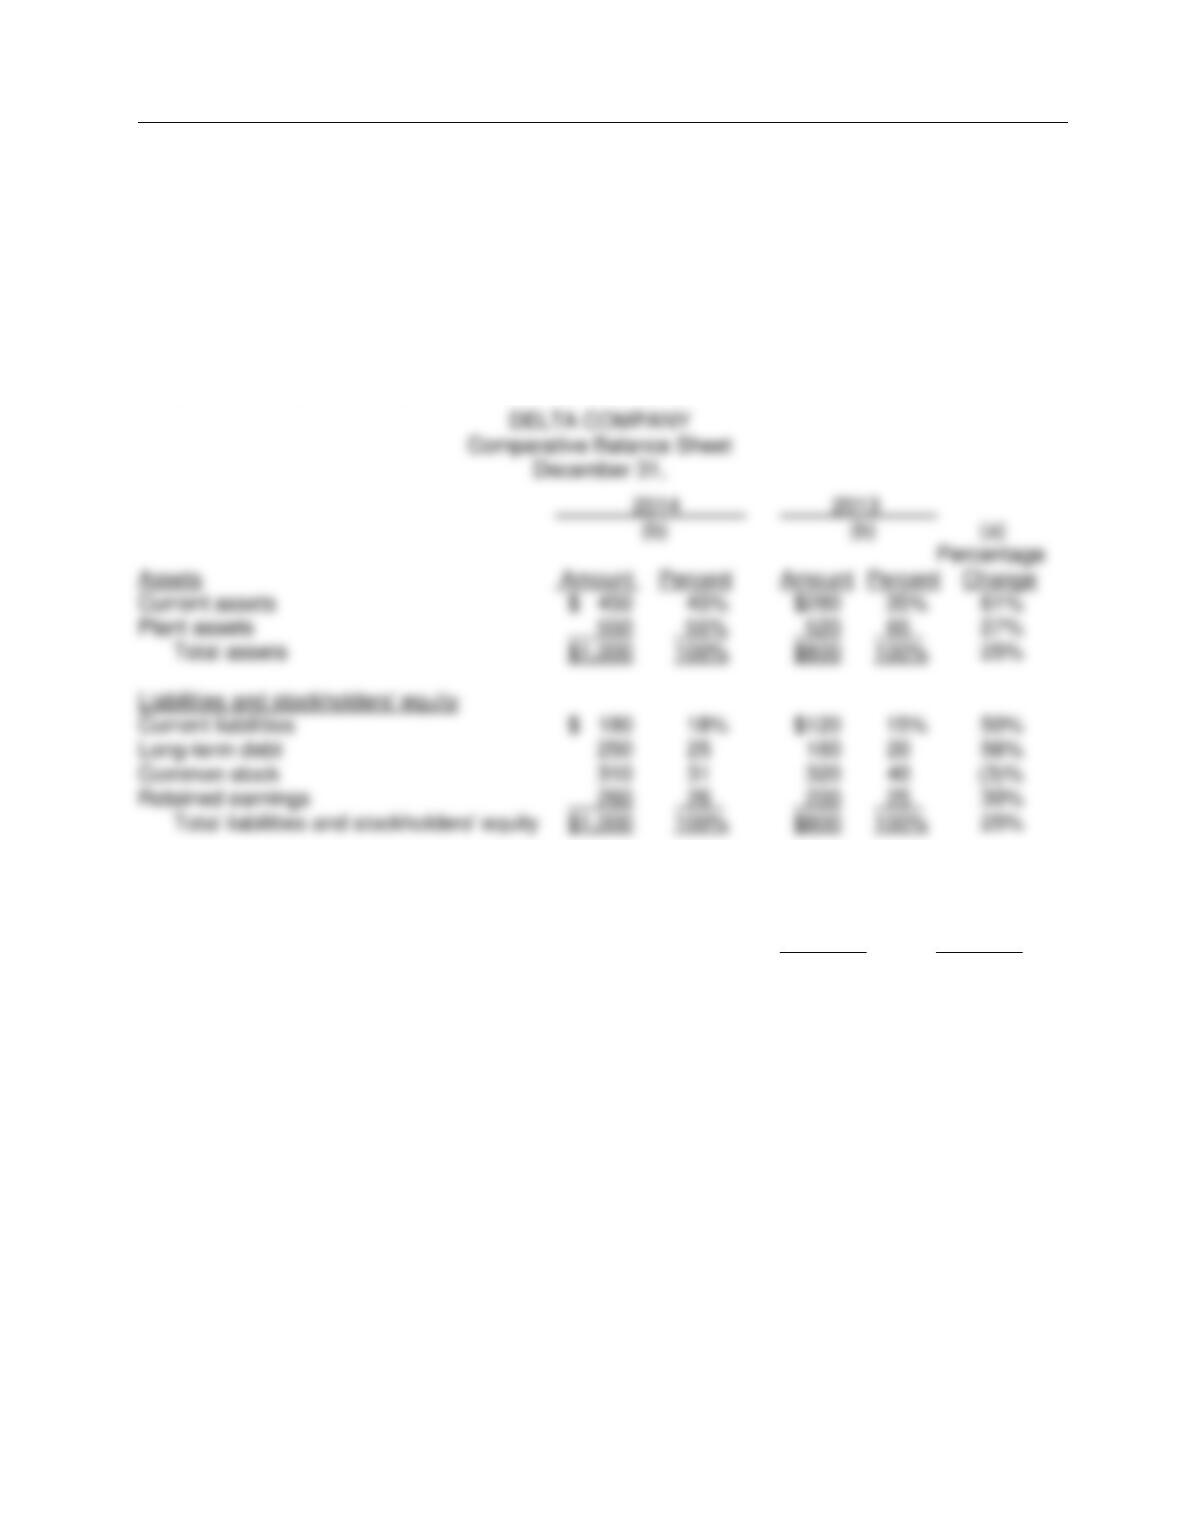
The comparative balance sheet of Delta Company appears below:
Delta COMPANY
Comparative Balance Sheet
December 31,
___________________________________________________________________________
Assets 2014 2013
Current assets ...................................................................................... $ 450 $280
Plant assets .......................................................................................... 550 520
Total assets .................................................................................... $1,000 $800
Liabilities and stockholders' equity
Current liabilities ................................................................................... $ 180 $120
Long-term debt ..................................................................................... 250 160
Common stock ...................................................................................... 310 320
Retained earnings ................................................................................ 260 200
Total liabilities and stockholders' equity .......................................... $1,000 $800
Financial Analysis: The Big Picture
FOR INSTRUCTOR USE ONLY
13-75
Ex. 248 (Cont.)
Instructions
(a) Using horizontal analysis, show the percentage change for each balance sheet item using
2013 as a base year.
(b) Using vertical analysis, prepare a common size comparative balance sheet.
Ans: N/A, LO: 4, 5, Bloom: AP, Difficulty: Medium, Min: 14, AACSB: Analytic, AICPA BB: Legal/Regulatory Perspective, AICPA FN: Reporting, AICPA PC:
Problem Solving, IMA: Performance Measurement
Solution 248 (14-19 min.)
Ex. 249
The following information was taken from the financial statements of Bjorg Company:
2014 2013
Gross profit on sales ................................................................. $600,000 $680,000
Income before income taxes ..................................................... 230,000 221,000
Net income ................................................................................ 180,000 153,000
Net income as a percentage of net sales .................................. 10% 9%
Instructions
(a) Compute the net sales for each year.
(b) Compute the cost of goods sold in dollars and as a percentage of net sales for each year.
(c) Compute operating expenses in dollars and as a percentage of net sales for each year.
(Income taxes are not operating expenses).
Ans: N/A, LO: 5, Bloom: AN, Difficulty: Medium, Min: 12, AACSB: Analytic, AICPA BB: Legal/Regulatory Perspective, AICPA FN: Reporting, AICPA PC:
Problem Solving, IMA: Performance Measurement
Test Bank for Accounting: Tools for Business Decision Making, Fifth Edition
FOR INSTRUCTOR USE ONLY
13-76
Solution 249 (12-15 min.)
Ex. 250
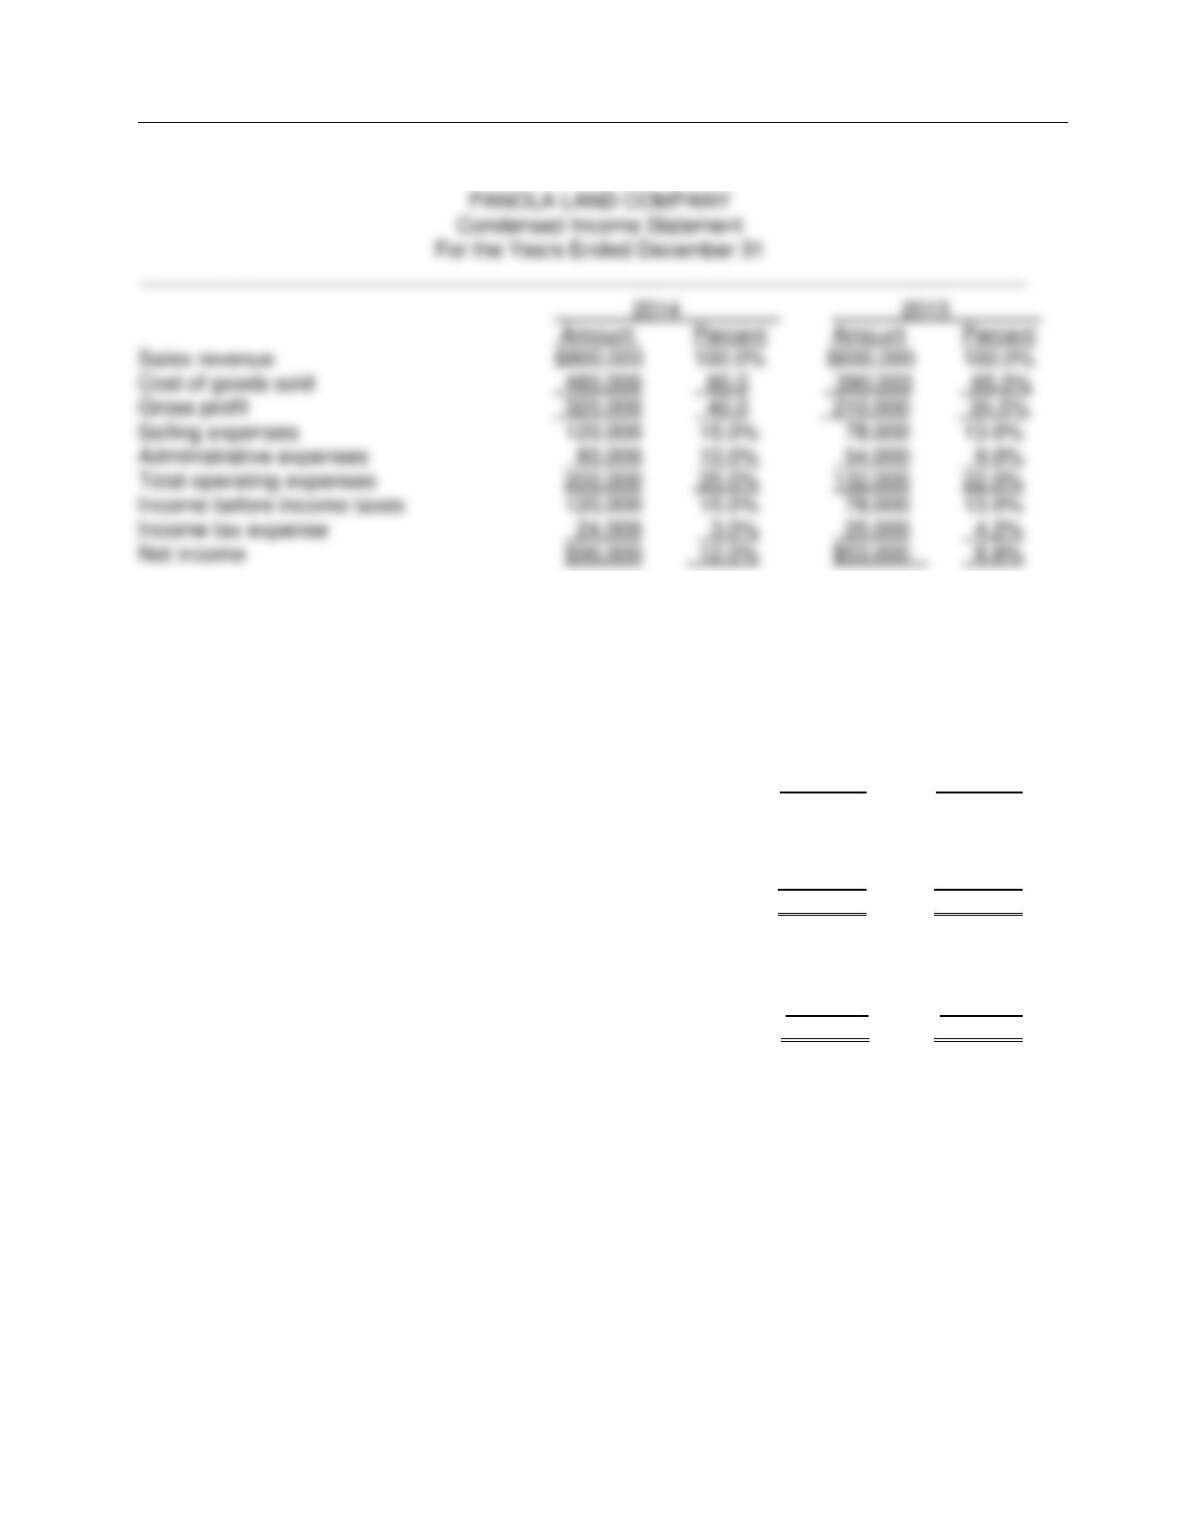
Operating data for Panola Land Corporation are presented below
2014 2013
Sales revenue $800,000 $600,000
Cost of goods sold 480,000 390,000
Selling expenses 120,000 78,000
Administrative expenses 80,000 54,000
Income tax expense 24,000 25,000
Net income 96,000 53,000
Instructions
Prepare a schedule showing a vertical analysis for 2014 and 2013.
Ans: N/A, LO: 5, Bloom: AP, Difficulty: Medium, Min: 10, AACSB: Analytic, AICPA BB: Legal/Regulatory Perspective, AICPA FN: Reporting, AICPA PC:
Problem Solving, IMA: Performance Measurement
Financial Analysis: The Big Picture
FOR INSTRUCTOR USE ONLY
13-77
Solution 250 (10 min.)
Ex. 251
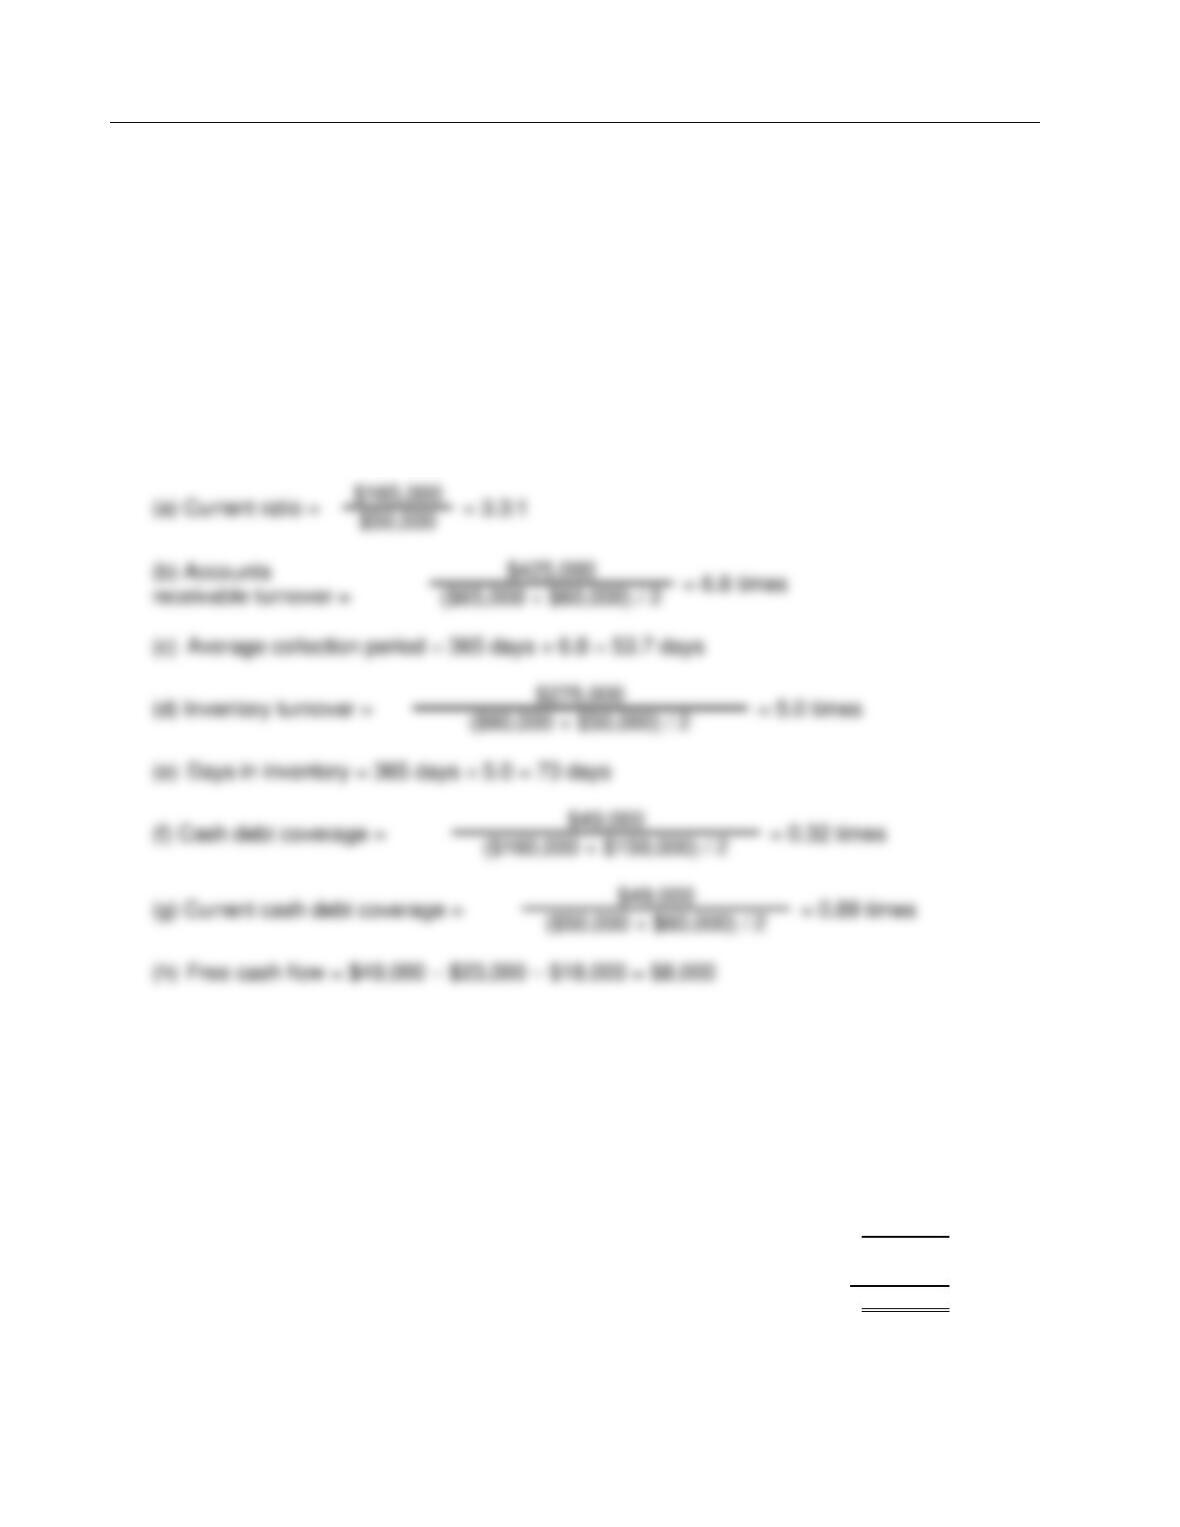
Armada Company has these comparative balance sheet data:
ARMADA COMPANY
Balance Sheets
December 31,
2014 2013
Cash $ 40,000 $ 30,000
Accounts receivable (net) 65,000 60,000
Inventories 60,000 50,000
Plant assets (net) 185,000 180,000
$350,000 $320,000
Accounts payable $ 50,000 $ 60,000
Mortgage payable (15%, due in 15 years) 100,000 100,000
Common stock, $10 par 140,000 120,000
Retained earnings 60,000 40,000
$350,000 $320,000
Additional information for 2014:
1. Net income was $25,000.
2. Sales on account were $450,000. Sales returns and allowances amounted to $25,000.
3. Cost of goods sold was $275,000.
4. Net cash provided by operating activities was $49,000.
5. Capital expenditures were $23,000, and cash dividends were $18,000.
Test Bank for Accounting: Tools for Business Decision Making, Fifth Edition
FOR INSTRUCTOR USE ONLY
13-78
Ex. 251 (Cont.)
Instructions
Compute the following ratios at December 31, 2014.
(a) Current. (e) Days in inventory
(b) Accounts receivable turnover. (f) Cash debt coverage.
(c) Average collection period. (g) Current cash debt coverage.
(d) Inventory turnover. (h) Free cash flow.
Ans: N/A, LO: 6, 8, Bloom: AP, Difficulty: Medium, Min: 10, AACSB: Analytic, AICPA BB: Legal/Regulatory Perspective, AICPA FN: Reporting, AICPA PC:
Problem Solving, IMA: Performance Measurement
Solution 251 (10 min.)
Ex. 252
Here is the income statement for Ginsberg, Inc.
GINSBERG, INC.
Income Statement
For the Year Ended December 31, 2014
___________________________________________________________________________
Sales revenue $400,000
Cost of goods sold 250,000
Gross profit 150,000
Expenses (including $12,000 interest and $22,000 income taxes) 100,000
Net income $ 50,000


