Unlock document.
This document is partially blurred.
Unlock all pages and 1 million more documents.
Get Access

If the government intervened in the market by lowering the price of a good below the
equilibrium price, which of the following would NOT occur?
A) Some consumers would receive an increase in consumer surplus.
B) Producers would likely lose some producer surplus.
C) The outcome would be efficient.
D) Total surplus would be lower.
If, for Adam, the marginal utility of ties is greater than the marginal utility of shirts, to
maximize utility, Adam should:
A) buy more ties and fewer shirts.
B) buy more shirts and fewer ties.
C) buy the same amount of each.
D) determine the price of ties and the price of shirts before he decides how many of
each to buy.
The amount by which an additional unit of an activity increases total benefit is:
A) net benefit.

B) marginal benefit.
C) marginal cost.
D) utility.
Which of the following cost concepts is correctly defined?
A) MC = DTC / DFC
B) ATC = VC + FC
C) ATC = AVC + AFC
D) TC = AVC + AFC
With tradable emissions permits, the main problem is to determine the _____, while
with emissions taxes the main problem is to determine the _____.
A) optimal quantity of pollution; optimal tax rate
B) optimal price of the permits; optimal level of pollution
C) optimal quantity of pollution; marginal social benefit of pollution
D) marginal social cost of pollution; optimal tax rate
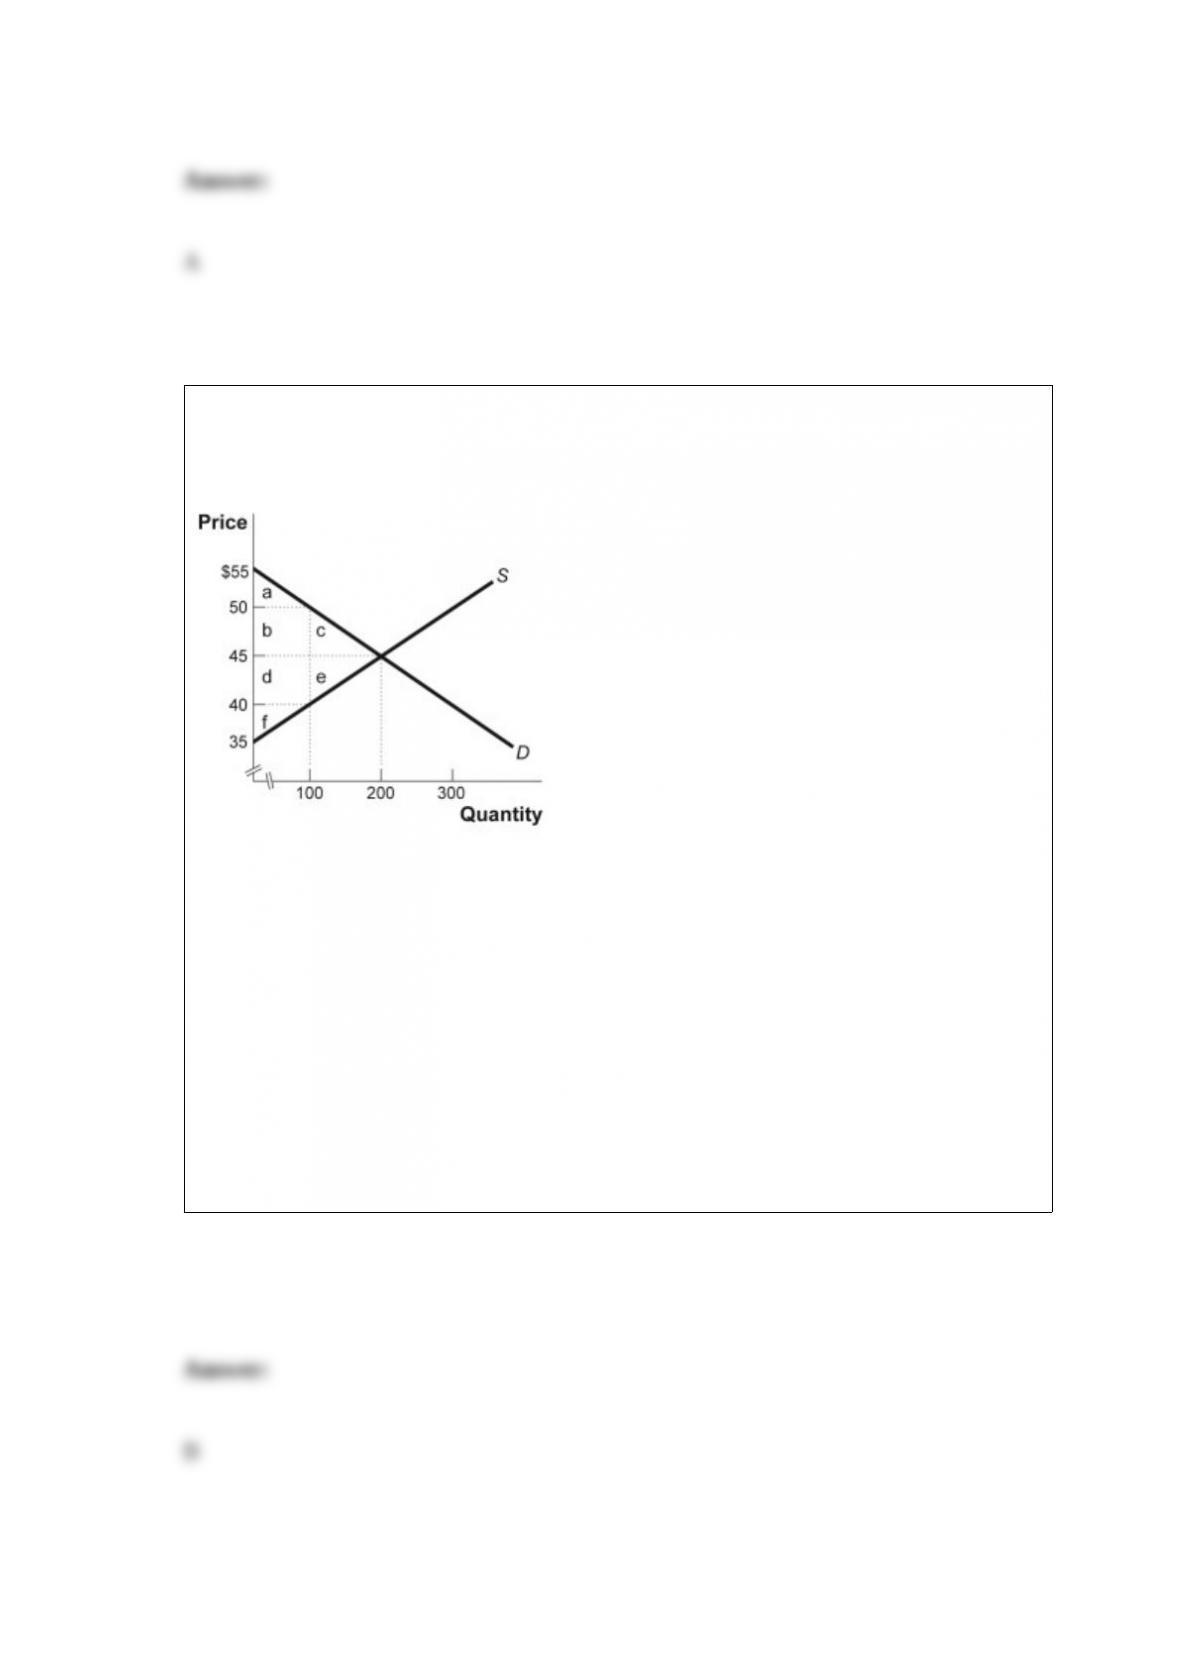
Figure: The Market for Blue Jeans
(Figure: The Market for Blue Jeans) Look at the figure The Market for Blue Jeans. The
government recently levied a $10 tax on the producers of blue jeans. What area or areas
in the graph identify the loss of consumer surplus due to the tax?
A) c
B) b + c
C) b
D) a + b + c
In the short run, the average total cost curve slopes upward because of:
A) economies of scale.
B) diseconomies of scale.
C) increasing returns.
D) diminishing returns.
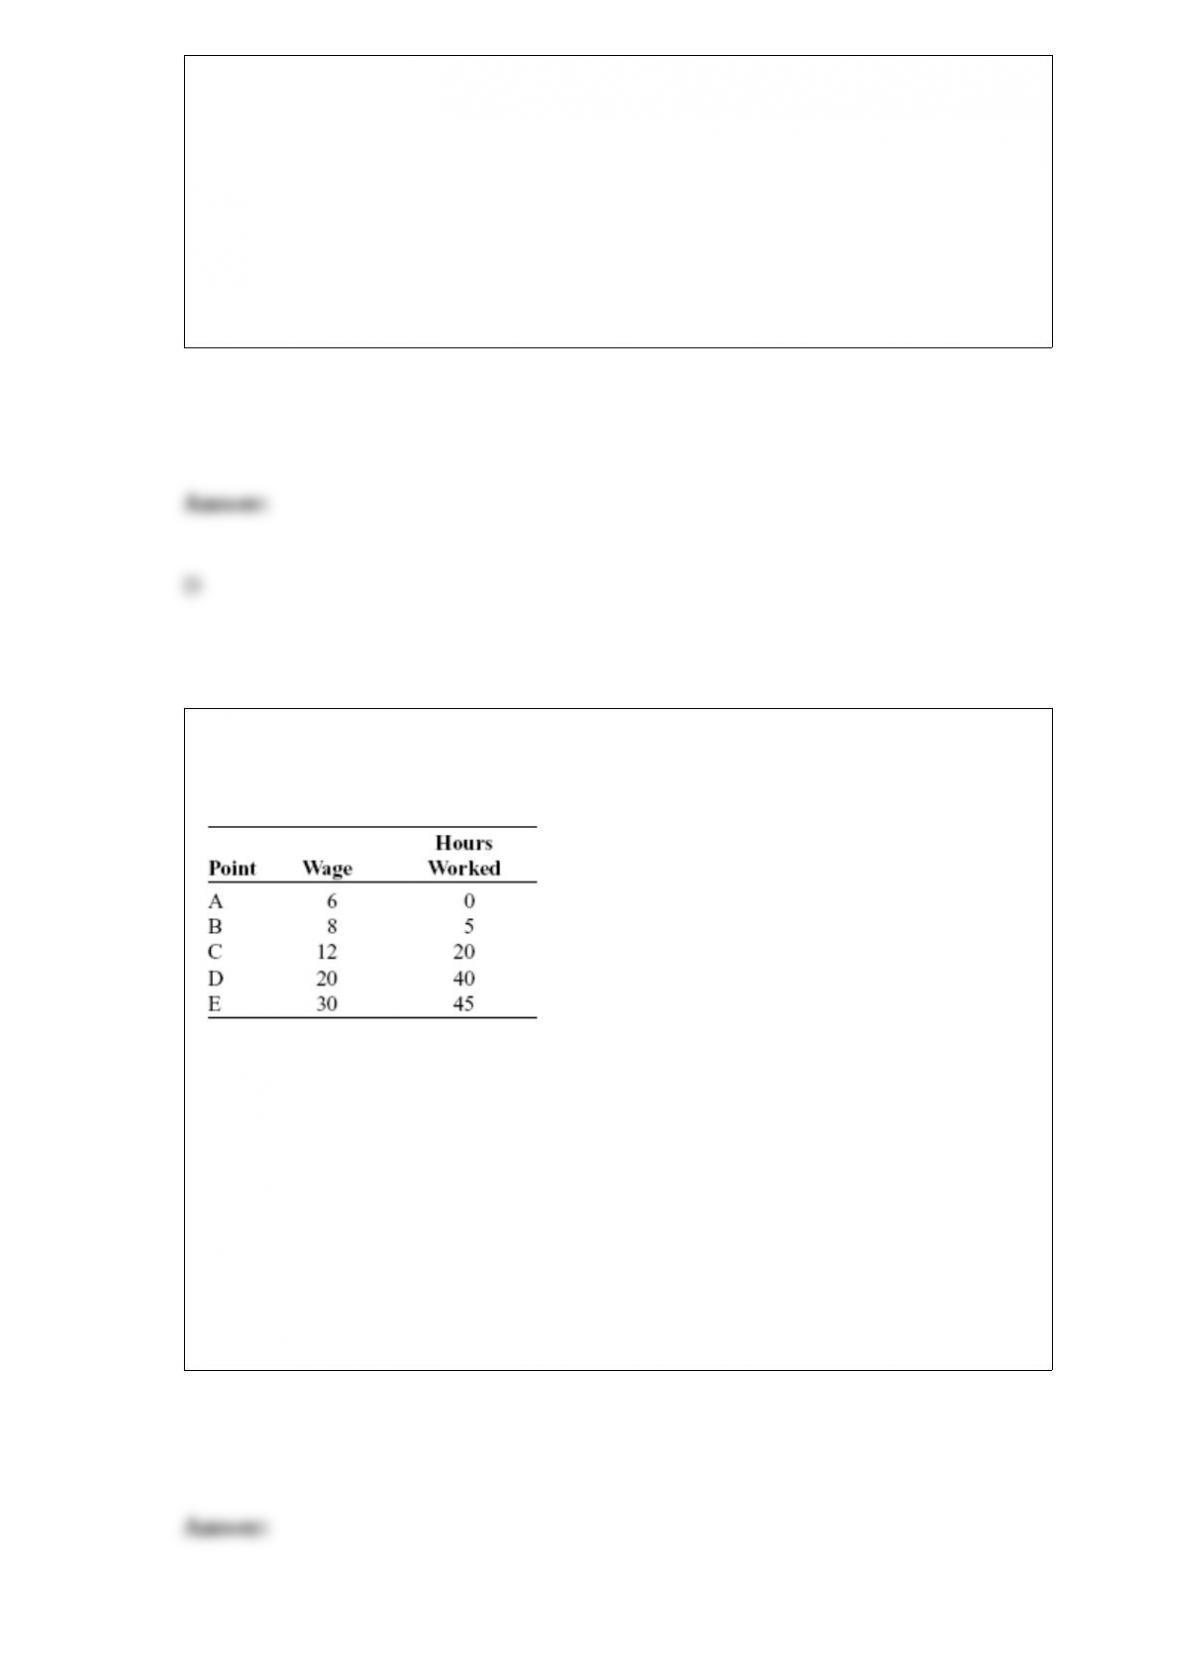
Table: Wages and Hours Willing to Work
(Table: Wages and Hours Willing to Work) Look
at the table Wages and Hours Willing to Work, which shows data on wage per hour and
the number of hours someone is willing to work. Which variable would economists put
on the vertical axis?
A) Either variable
B) the wage, because even though it is the independent variable, it is a price
C) hours willing to work, because it is the dependent variable
D) neither variable

Figure: Rita's Time Allocation Budget Line
(Figure: Rita's Time Allocation Budget Line) Look at the figure Rita's Time Allocation
Budget Line. It is based on 80 hours available for labor and leisure. If her hourly wage
doubles, the vertical intercept will be:
A) $1,120.
B) $1,400.
C) $1,600.
D) $2,000.
Coffee and tea are substitutes in consumption. If there is an increase in the price of
coffee, assuming a positively sloped supply curve and a negatively sloped demand
curve, total surplus in the tea market:
A) will increase.
B) will decrease.
C) will not change.
D) may change, but we cannot determine the change without more information.
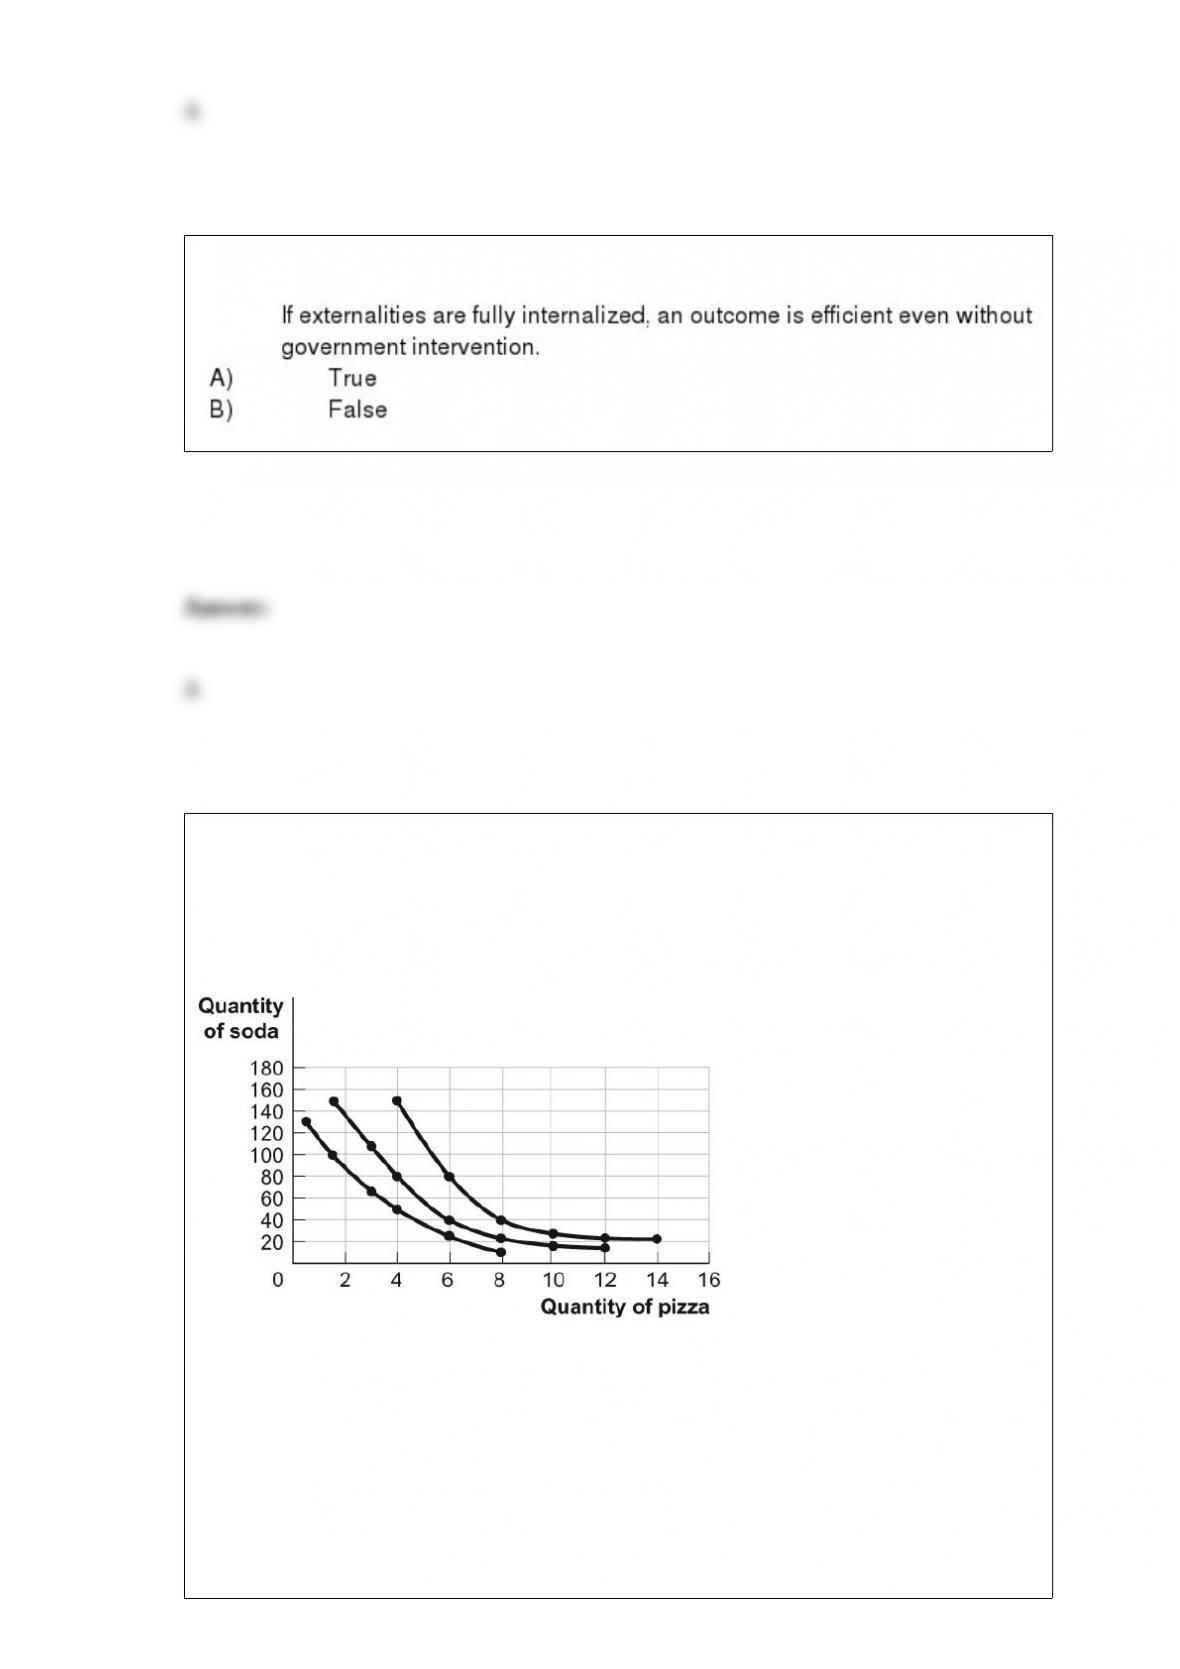
Figure: Consumer Equilibrium I The figure shows three of Owen's indifference
curves for pizza and soda per week. Owen has $180 per month to spend on the two
goods. The price of a pizza is $20, and the price of a soda is $1.50.
(Figure: Consumer Equilibrium I) Look at the figure Consumer Equilibrium I. If in
equilibrium Owen receives marginal utility of 10 utils from the last pizza he consumes,
his marginal utility from the last soda must be _____ utils.
A) 0.50
B) 0.75

C) 1.5
D) 13.3
On a linear demand curve, the price elasticity of demand at higher prices will be:
A) price-inelastic.
B) price-elastic.
C) price unit-elastic.
D) perfectly price-inelastic.
When each factor is paid an amount equal to the value of the marginal product of the
last unit of that factor employed in the factor market as a whole, this is:
A) the marginal productivity theory of income distribution.
B) diminishing marginal product.
C) the factor distribution of income.
D) the efficiency wage model.
The marginal productivity theory of income distribution assumes that factor markets
are:
A) monopolies.
B) oligopolies.
C) perfectly competitive.
D) allowed to pay only the wages that government approves.
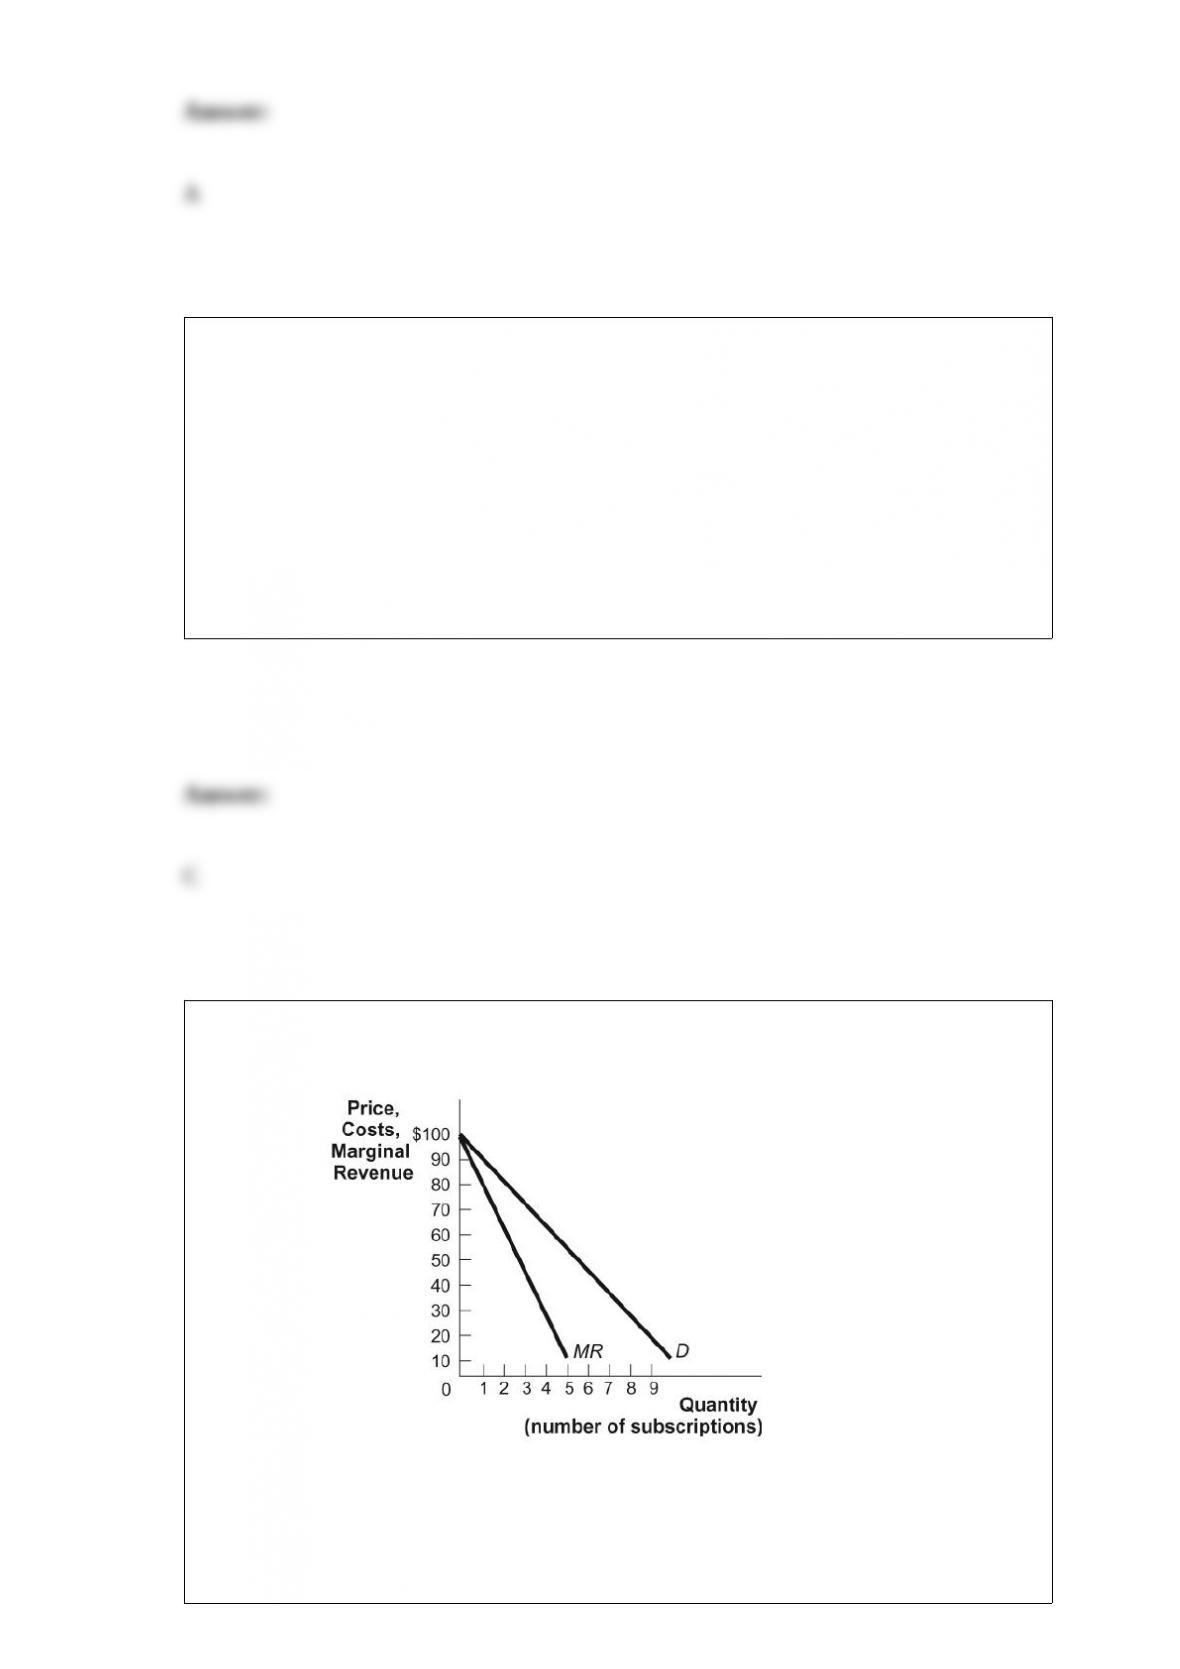
Figure: PPV
(Figure: PPV) Look at the figure PPV, which shows the demand and marginal revenue
for a pay-per-view football game on cable TV. Assume that the marginal cost and
average cost are a constant $20. If the cable company is a monopoly, how much will it
produce?

A) 2
B) 4
C) 6
D) 8
The production possibility frontier illustrates that:
A) the economy will automatically end up at full employment.
B) an economy's productive capacity increases one-for-one with its population.
C) if all resources of an economy are being used efficiently, more of one good can be
produced only if less of another good is produced.
D) economic production possibilities have no limit.
The change in total output resulting from a one-unit increase in the quantity of an input
used, holding the quantities of all other inputs constant, is:
A) average cost.
B) average product.

C) marginal cost.
D) marginal product.
If a country's price in the absence of trade is lower than the price with trade, then the
domestic quantity supplied with trade is _____ the domestic quantity demanded.
A) greater than
B) less than
C) equal to
D) not comparable to
Figure: The Quantity of Pollution
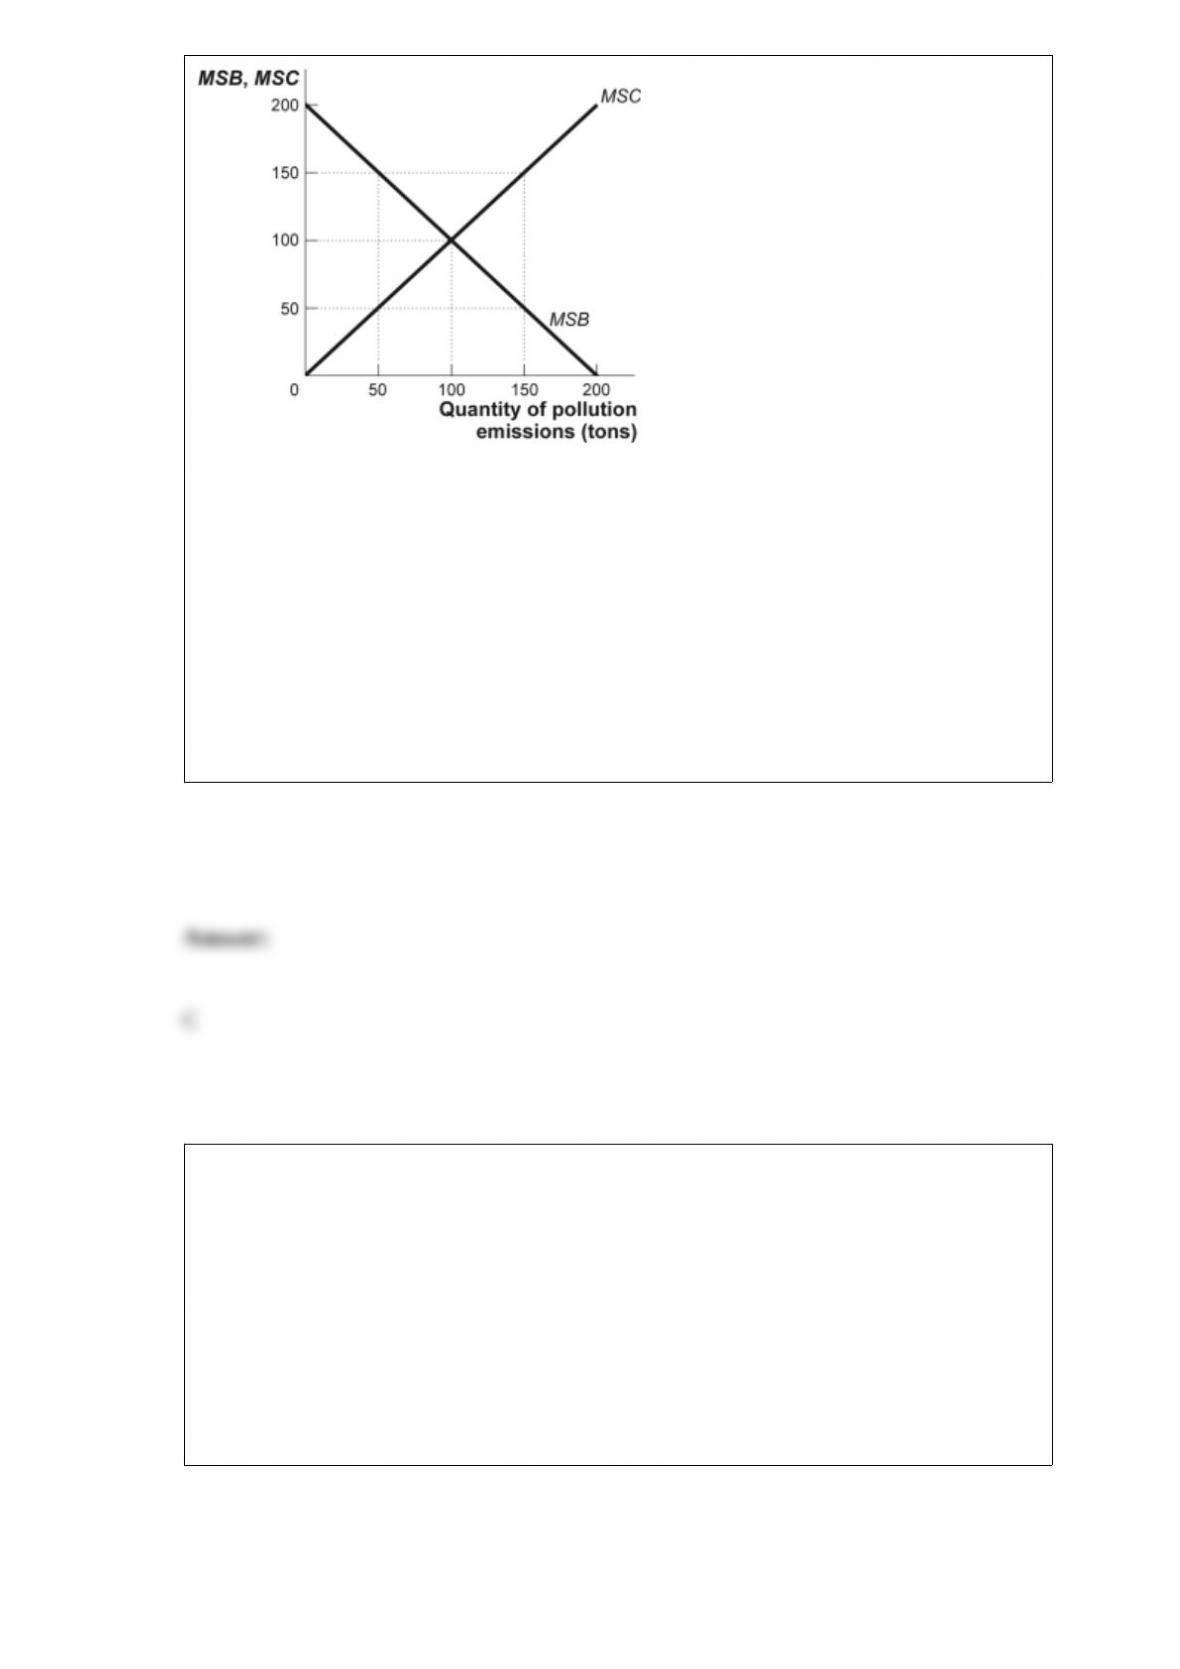
(Figure: The Quantity of Pollution) Look at the table The Quantity of Pollution. If the
amount of pollution emitted is 150:
A) this economy would benefit by increasing production of this good.
B) the marginal social benefit is greater than the marginal social cost of pollution.
C) the production of pollution is not socially optimal.
D) this economy is producing at the socially optimal level of pollution.
If the market produces an efficient level of a good, then we know that the good must be
_____ and _____ in consumption.
A) nonexcludable; nonrival
B) nonexcludable; rival
C) excludable; nonrival
D) excludable; rival
A farm can produce 1,000 bushels of wheat per year with two workers and 1,300
bushels of wheat per year with three workers. The marginal product of the third worker
is _____ bushels.
A) 100
B) 300
C) 1,300
D) 2,300
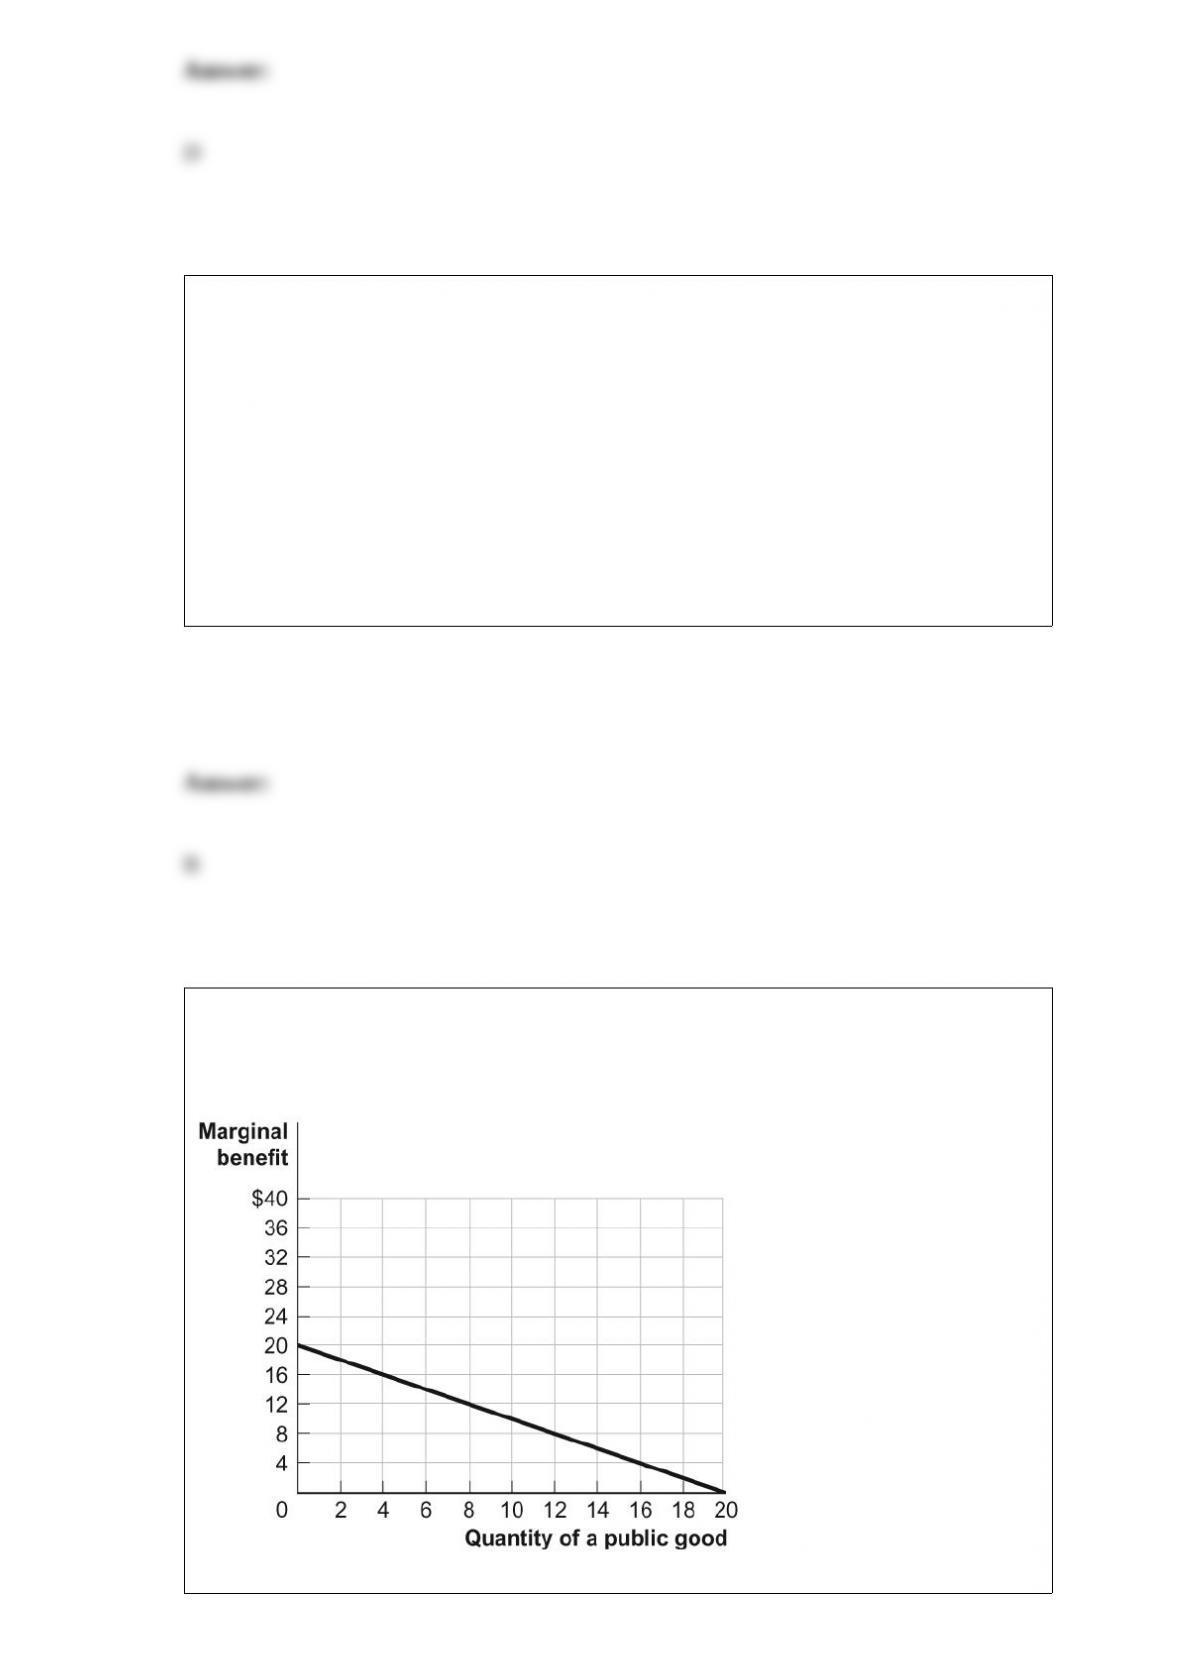
Figure: An Individual's Marginal Benefit from a Public Good

(Figure: An Individual's Marginal Benefit from a Public Good) Look at the figure An
Individual's Marginal Benefit from a Public Good. Assume that two individuals will
share consumption of a public good; each individual has the marginal benefit curve
shown in the figure. If the marginal cost of the good is $8, how many units of this
public good will maximize society's welfare?
A) 0
B) 8
C) 12
D) 16
Which of the following is the BEST example of social insurance?
A) liability insurance for automobiles
B) food stamps
C) housing subsidies
D) Social Security
A monopolistically competitive industry has some of the characteristics of perfect
competition, including:

A) many firms making economic profit in the long run.
B) easy entry and exit.
C) identical products.
D) easy entry and exit and identical products.
Scenario: Countries A and B Two countries, A and B, produce two goods, wheat (W)
and steel (S). Each has a linear production possibility frontier in both goods. If country
A spends all of its available resources to produce wheat, it can produce 500 tons of
wheat and no steel. If it uses all of its resources to produce steel, it can produce 250
tons of steel and no wheat. If country B spends all of its available resources producing
wheat, it can produce 400 tons of wheat, and if it spends all of its resources on the
production of steel, it can produce 400 tons of steel.
(Scenario: Countries A and B) Look at the scenario Countries A and B. Given this
information, country _____ has a comparative advantage in the production of wheat,
and country _____ has a comparative advantage in the production of steel.
A) A; A
B) A; B
C) B; B
D) B; A
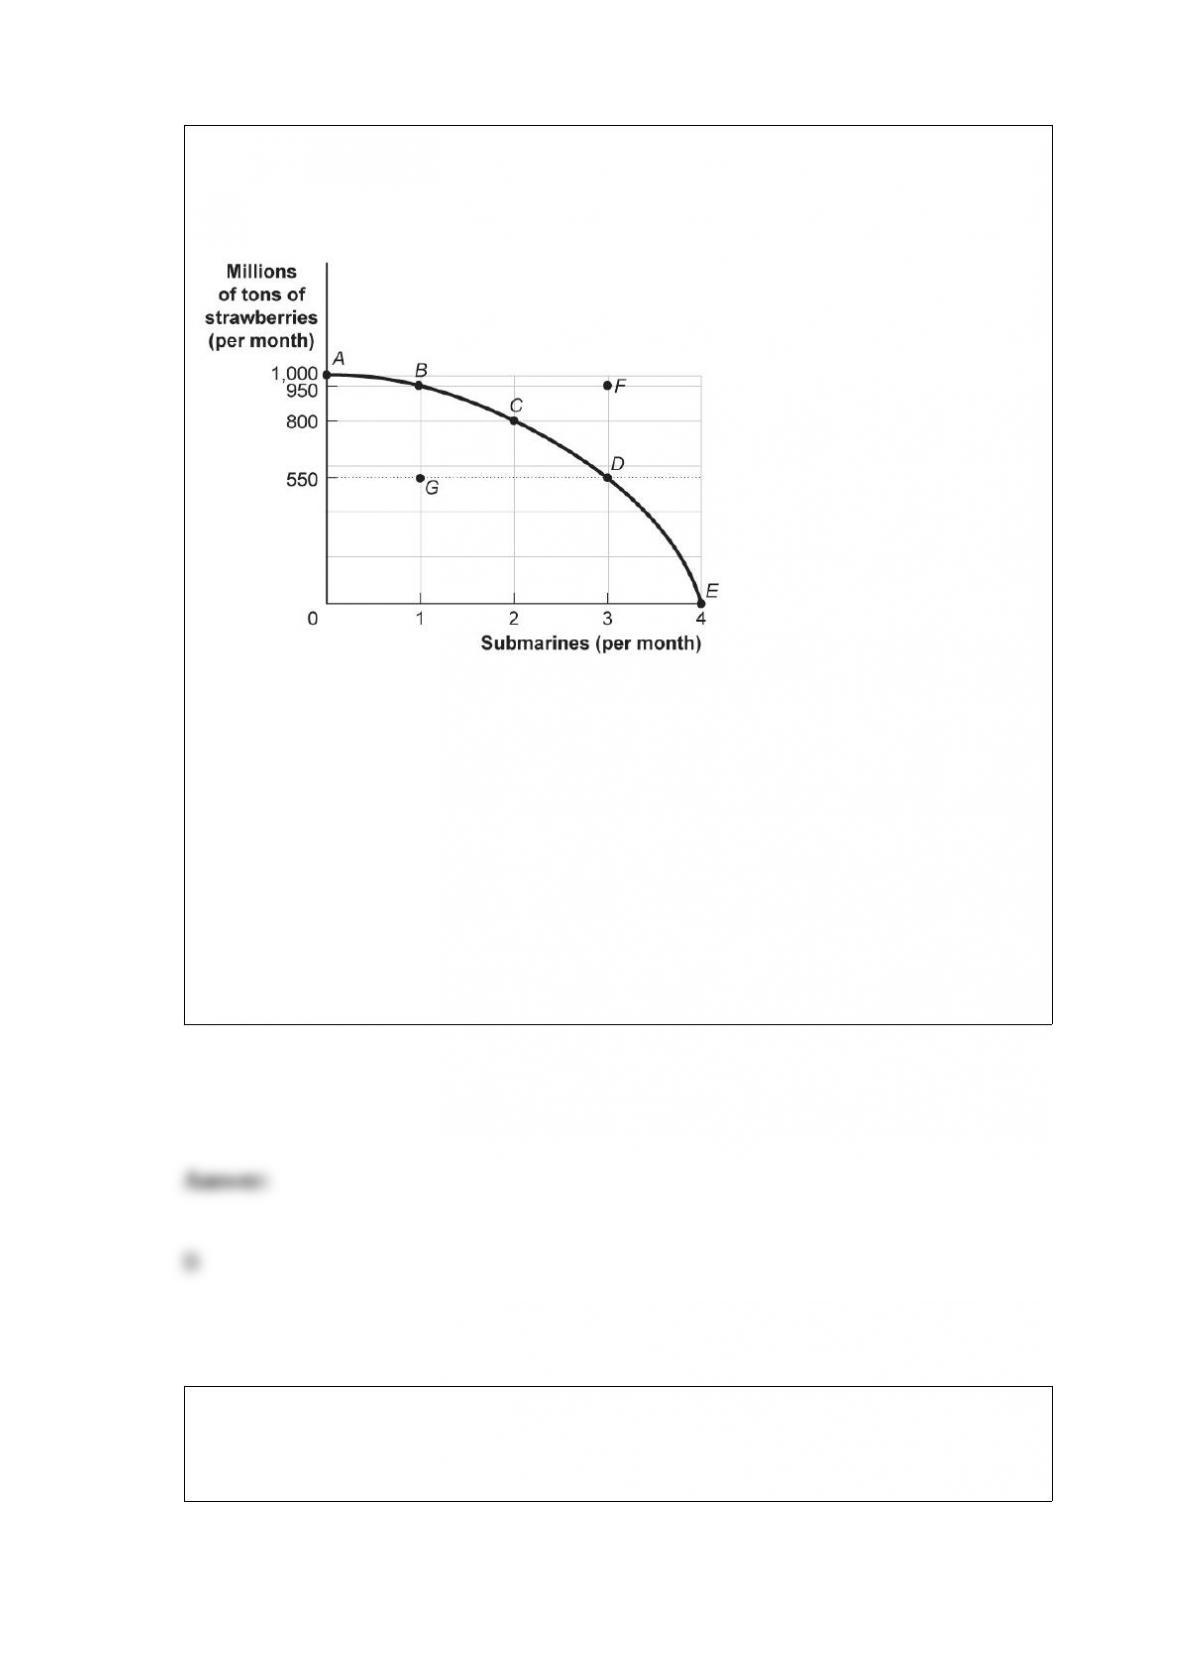
Figure: Strawberries and Submarines
(Figure: Strawberries and Submarines) Look at the figure Strawberries and Submarines.
As the economy moves from point A toward point D, it will find that the opportunity
cost of each additional submarine:
A) falls.
B) rises.
C) remains unchanged.
D) doubles.
Figure: The Market for Candy
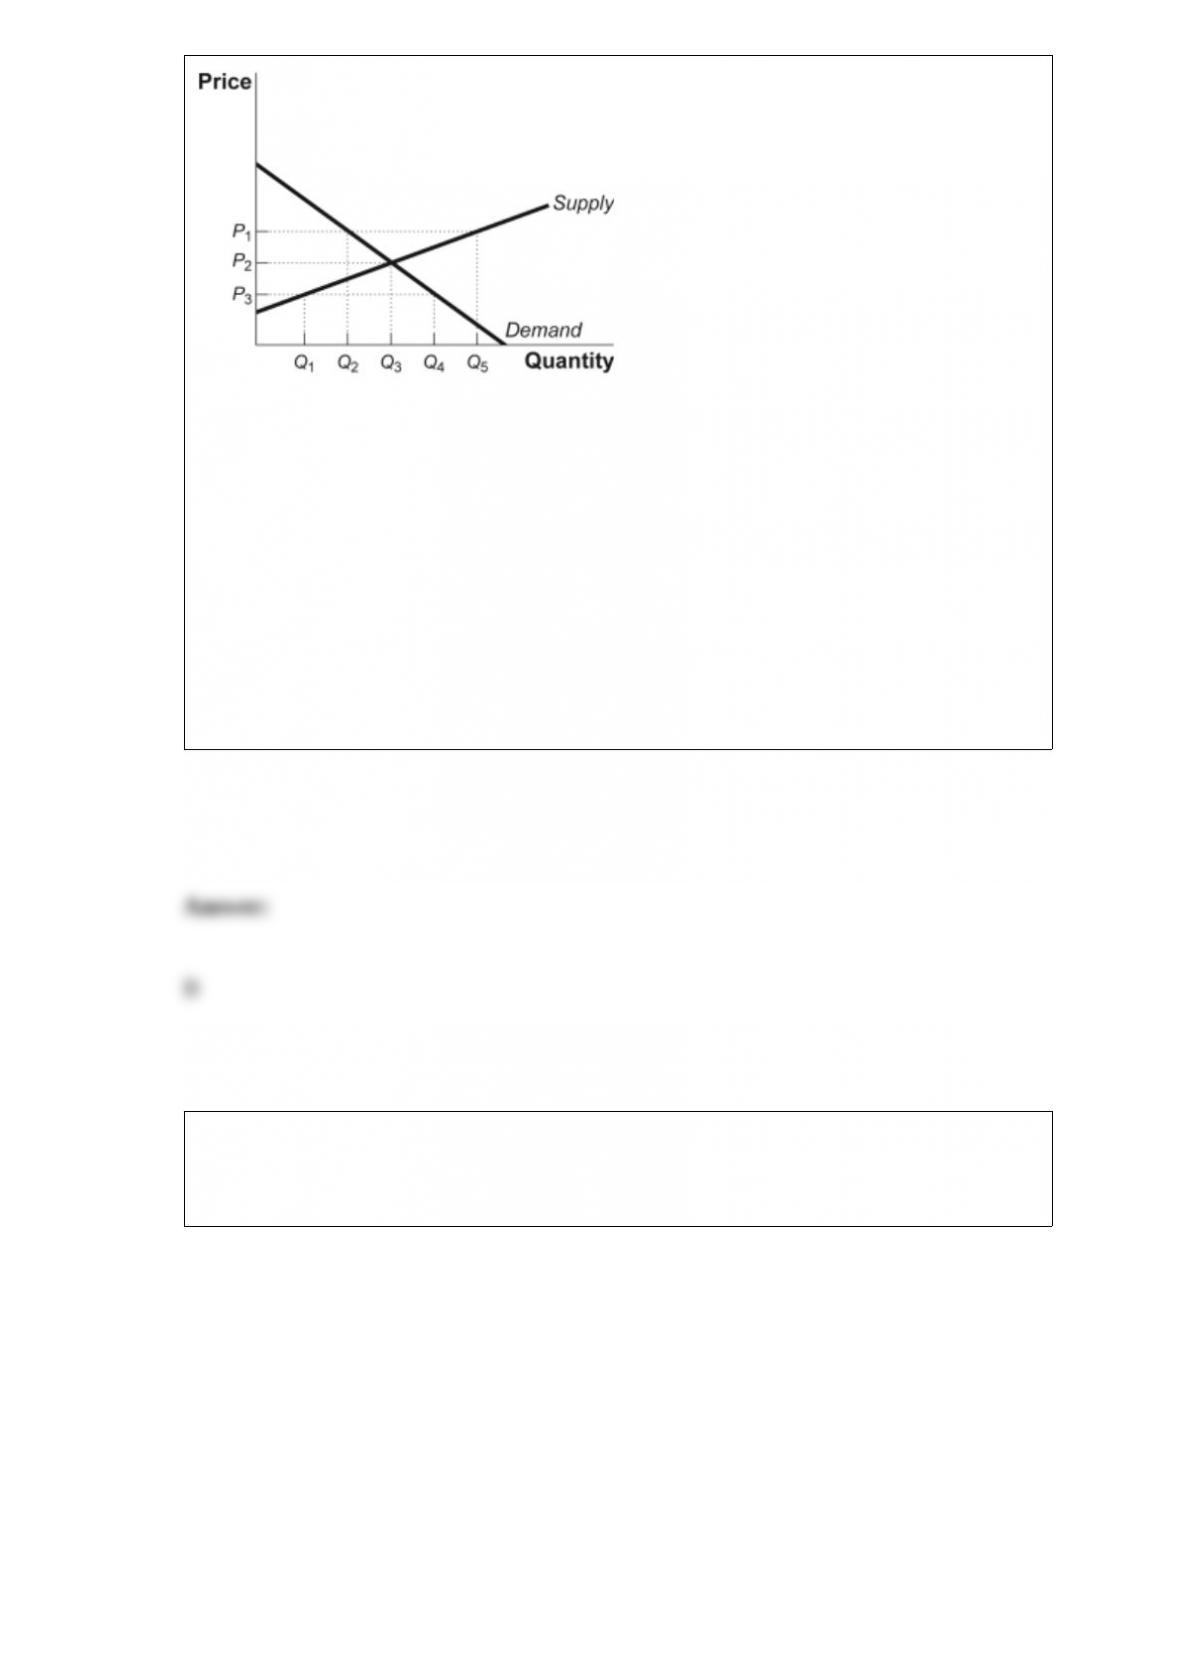
(Figure: The Market for Candy) Look at the figure The Market for Candy. Equilibrium
occurs at a price of _____, and the equilibrium quantity is equal to _____.
A) P1; Q5
B) P2; Q3
C) P3; Q2
D) P1; Q3
Figure: The Demand for Shirts
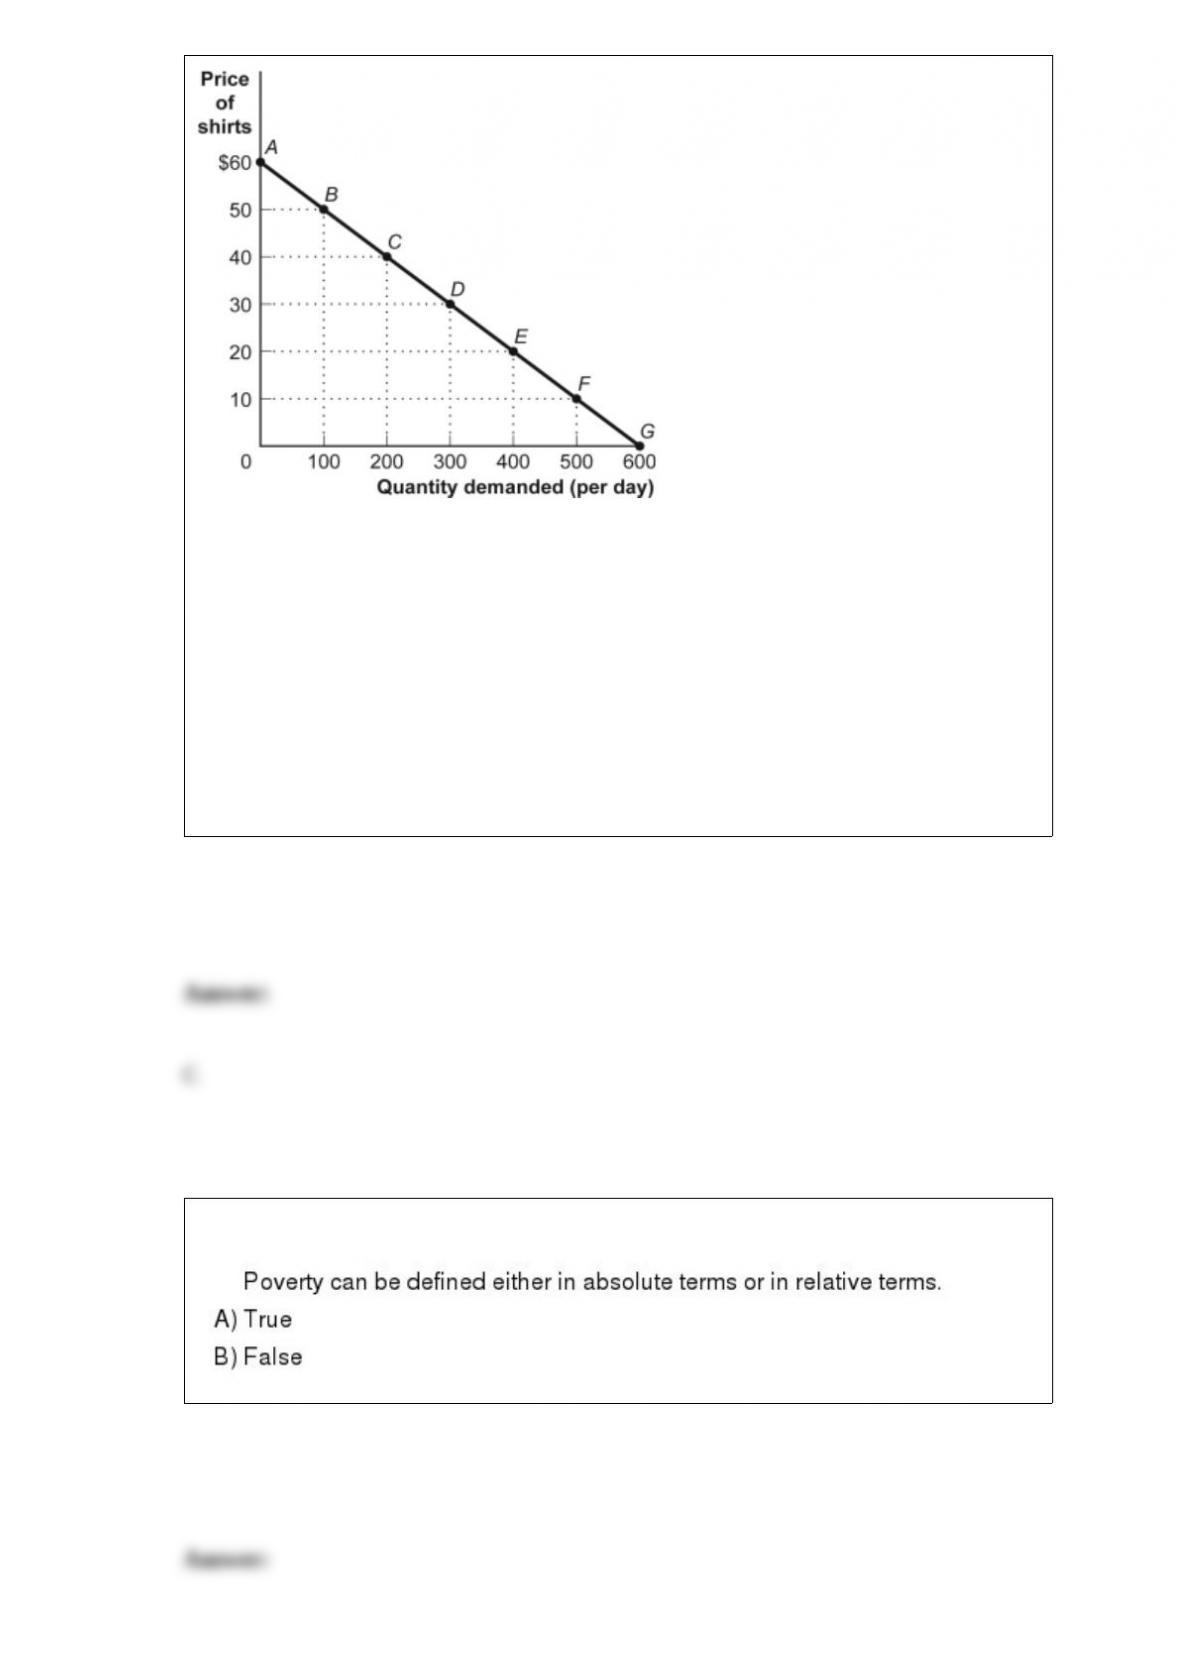
(Figure: The Demand for Shirts) Look at the figure The Demand for Shirts. By the
midpoint method, the price elasticity of demand for the segment CD is:
A) 0.71.
B) 1
C) 1.4.
D) 0.29.

Assuming that U.S. and French wines are substitutes in consumption, if the U.S.
government imposes a quota on the amount of French wine allowed into the United
States and the quota is set at a quantity below equilibrium, the price of French wine in
the United States will _____ while the price of the U.S.-produced wine will _____.
A) increase; increase
B) increase; decrease
C) decrease; increase
D) decrease; decrease
Consumption of more of a good that has become cheaper in place of a good that has
become relatively more expensive is the:
A) income effect.
B) substitution effect.
C) budget constraint.
D) inferior effect.

Owen had a typewriter shop, but he went out of business because no one buys
typewriters anymore. This statement best represents this economic concept:
A) Resources are scarce.
B) People usually exploit opportunities to make themselves better off.
C) Markets move toward equilibrium.
D) One person's spending is another person's income.
Economic analysis shows that workers pay _____ of the FICA.
A) exactly half
B) very little
C) most
D) none
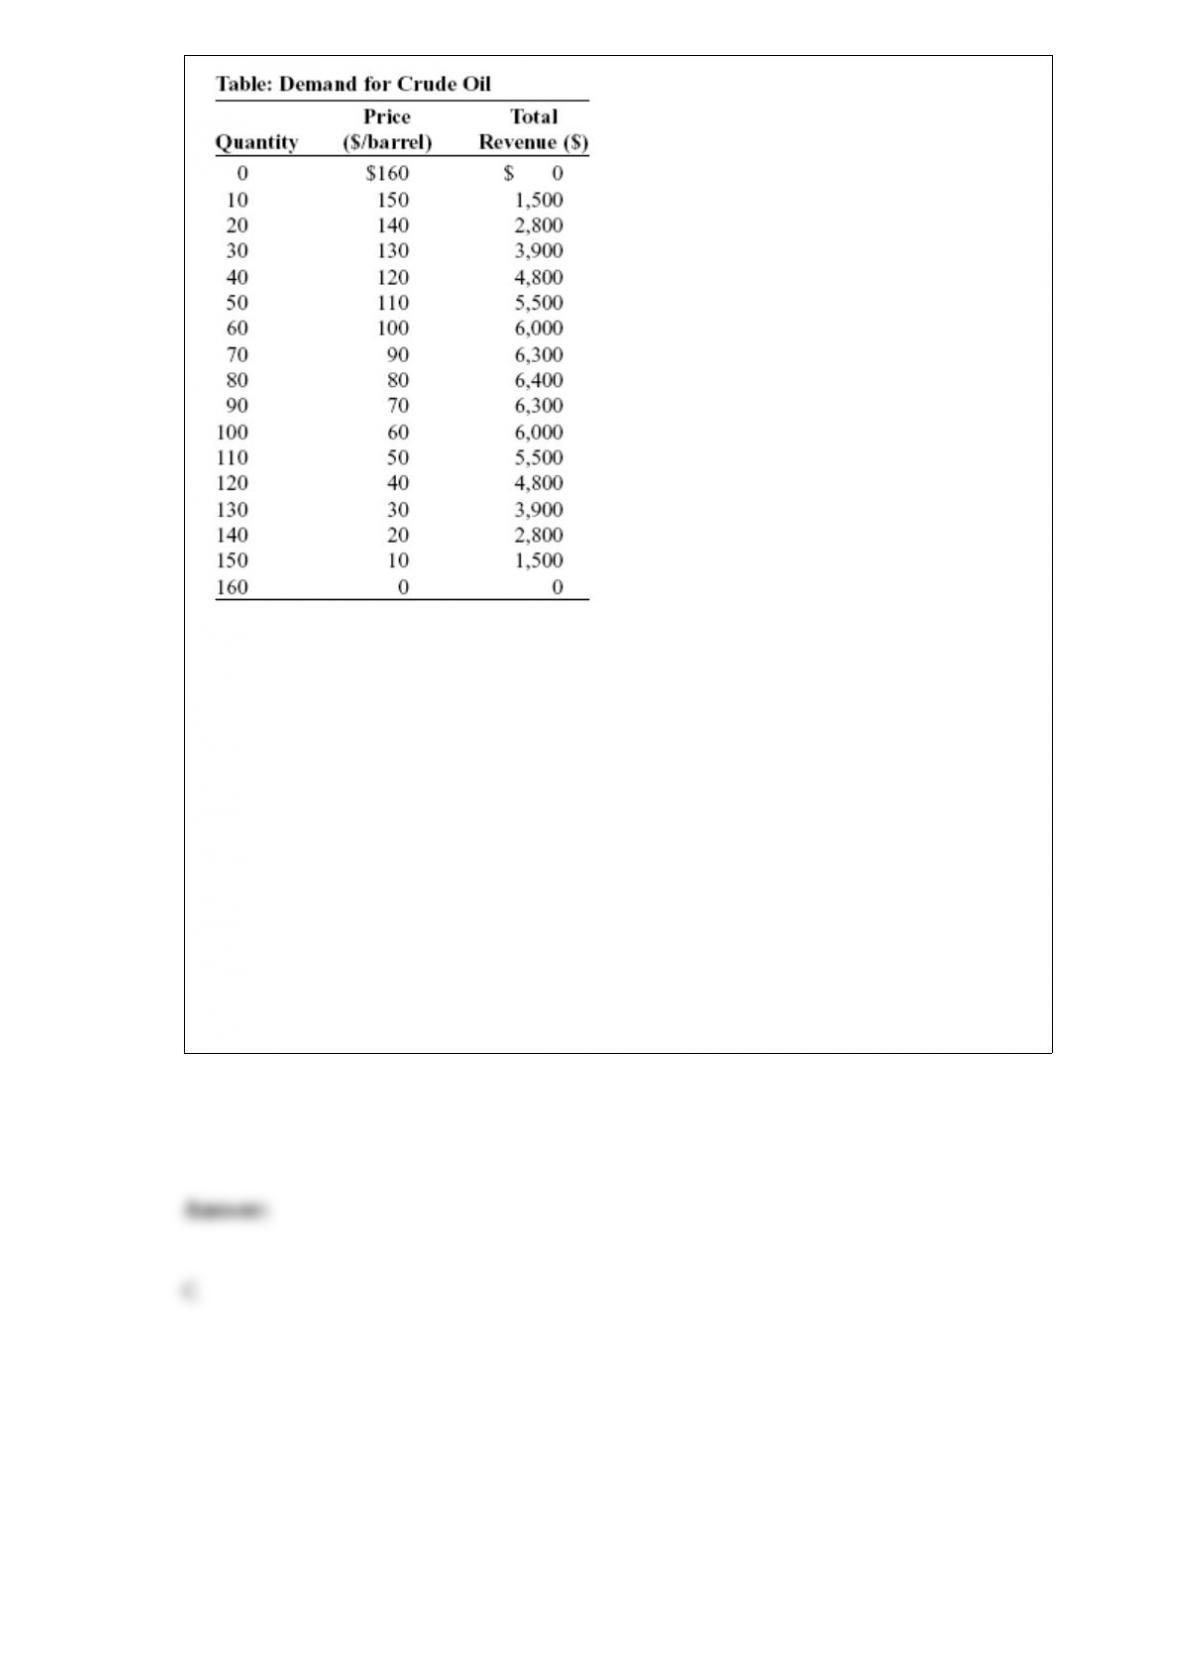
(Table: Demand for Crude Oil) Look at the table Demand for Crude Oil. Assume that
the crude oil industry is a duopoly and the marginal cost of producing crude oil is zero.
Suppose that the two firms are maximizing industry profit and splitting the profit
evenly. If firm 1 decides to cheat and increase production by 10 more barrels, total
industry output will be _____ barrels.
A) 160
B) 100
C) 90
D) 80


