Unlock document.
This document is partially blurred.
Unlock all pages and 1 million more documents.
Get Access

In statistical experiments, each time the experiment is repeated
a. the same outcome must occur
b. the same outcome cannot occur again
c. a different outcome may occur
d. None of the other answers is correct.
The value of F0.01 with 9 numerator and 20 denominator degrees of freedom is
a. 2.39
b. 2.94
c. 2.91
d. 3.46
The random variable x is known to be uniformly distributed between 70 and 90. The
probability of x having a value between 80 to 95 is
a. 0.75
b. 0.5
c. 0.05
d. 1
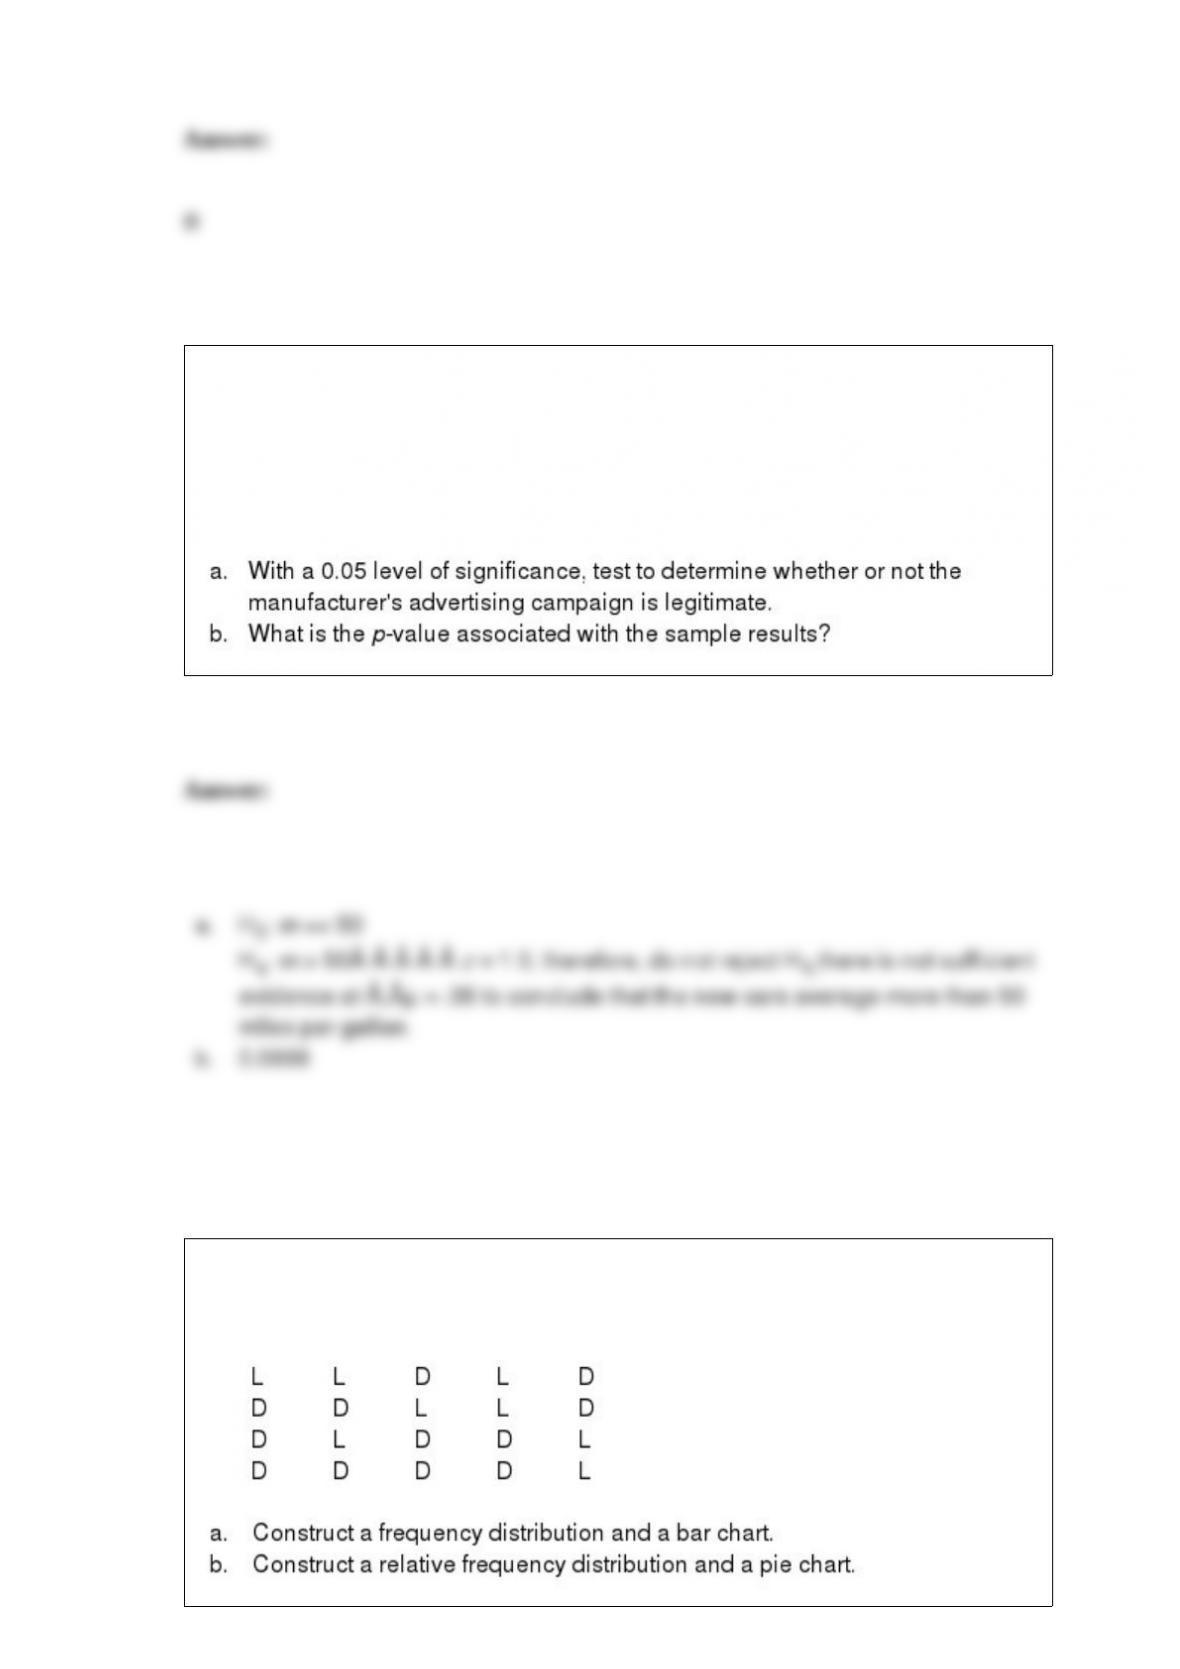
Bastien, Inc. has been manufacturing small automobiles that have averaged 50 miles
per gallon of gasoline in highway driving. The company has developed a more efficient
engine for its small cars and now advertises that its new small cars average more than
50 miles per gallon in highway driving. An independent testing service road-tested 36
of the automobiles. The sample showed an average of 51.5 miles per gallon. The
population standard deviation is 6 miles per gallon.
Twenty employees of ABC Corporation were asked if they liked or disliked the new
district manager. Below are their responses. Let L represent liked and D represent
disliked.

Exhibit 7-4
A random sample of 121 bottles of cologne showed an average content of 4 ounces. It is
known that the standard deviation of the contents (i.e., of the population) is 0.22
ounces.
Refer to Exhibit 7-4. The point estimate of the mean content of all bottles is
a. 0.22
b. 4
c. 121
d. 0.02
A perfectly balanced coin is tossed 6 times and tails appears on all six tosses. Then, on
the seventh trial
a. tails cannot appear

b. heads has a larger chance of appearing than tails
c. tails has a better chance of appearing than heads
d. None of the other answers is correct.
In tests about a population proportion, p0 represents the
a. hypothesized population proportion
b. observed sample proportion
c. observed p-value
d. probability of
The average weekly earnings of bus drivers in a city are $950 (that is
) with a standard
deviation of $45 (that is
). Assume that we select a random sample of 81 bus drivers.
a. Assume the number of bus drivers in the city is large compared to the sample size.
Compute the standard error of the mean.
b. What is the probability that the sample mean will be greater than $960?
c. If the population of bus drivers consisted of 400 drivers, what would be the standard
error of the mean?

Exhibit 5-9
Forty percent of all registered voters in a national election are female. A random sample
of 5 voters is selected.
Refer to Exhibit 5-9. The probability that the sample contains 2 female voters is
a. 0.0778
b. 0.7780
c. 0.5000
d. 0.3456
The proportion of Americans who support the death penalty is 0.53. A sample of 1000
randomly selected Americans is surveyed by telephone interview. Use Excel to answer
the following questions.
a. What is the probability that the sample proportion of those supporting the death
penalty will be less than 0.50?
b. What is the probability that the sample proportion of those supporting the death
penalty will be at least 0.55?
c. What is the probability that the sample proportion of those supporting the death
penalty will be between 0.50 and 0.55?
d. For samples of size 1000, 15% of all sample proportions are at most what value?

Exhibit 5-10
The probability that Pete will catch fish on a particular day when he goes fishing is 0.8.
Pete is going fishing 3 days next week.
Refer to Exhibit 5-10. The expected number of days Pete will catch fish is
a. .6
b. .8
c. 2.4
d. 3

In the two upcoming basketball games, the probability that UTC will defeat Marshall is
0.63, and the probability that UTC will defeat Furman is 0.55. The probability that UTC
will defeat both opponents is 0.3465.
a. What is the probability that UTC will defeat Furman given that they defeat Marshall?
b. What is the probability that UTC will win at least one of the games?
c. What is the probability of UTC winning both games?
d. Are the outcomes of the games independent? Explain and substantiate your answer.
A portion of the population selected to represent the population is called
a. statistical inference
b. descriptive statistics
c. a census
d. a sample
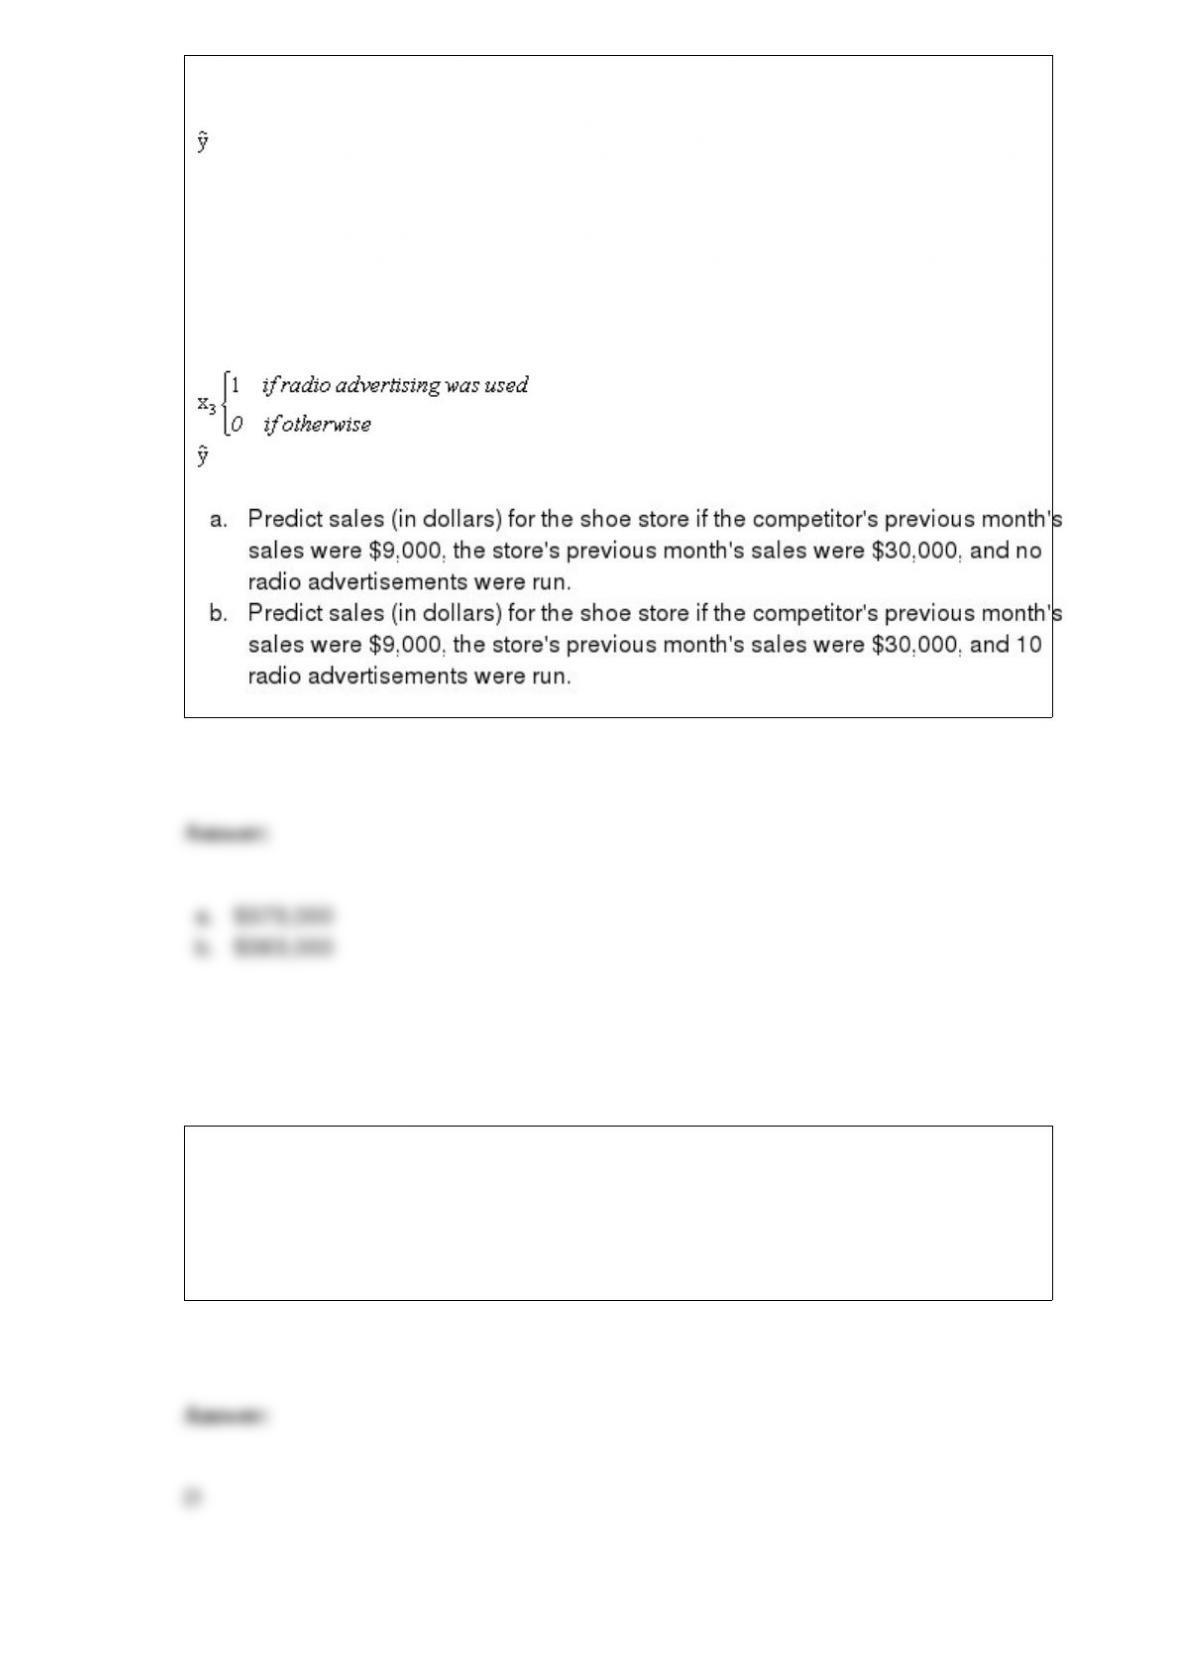
The following regression model has been proposed to predict monthly sales at a shoe
store.
= 40 - 3x1 + 12x2 + 10x3
where
x1 = competitor's previous month's sales (in $1,000s)
x2 = Stores previous month's sales (in $1,000s)
= sales (in $1000s)
The ANOVA procedure is a statistical approach for determining whether or not
a. the means of two samples are equal
b. the means of two or more samples are equal
c. the means of more than two samples are equal
d. the means of two or more populations are equal


